Numbers on the Italian Migrant Situation
A quantitative perspective on what's going on in Italy
Italy is in the news again, and it’s apparently struggling with another wave of migrants. Since this seems to come up all the time, I think it’s time we put some numbers on Italy’s troubles. Luckily, Chris Brunet of the blog Karlstack was able to provide those numbers.
Chris requested the Segreteria Ufficio Stampa Ministro dell’Interno provide statistics on the migrant situation and they immediately delivered! All the statistics reported in this article are current through September 30th. Let’s start with the basics: how many migrants have there been? A lot!
For reference, Italy processed 239,255 asylum applications between 2015 and 2017. This chart is for the total number of people disembarked so it’s not quite comparable, but since Italy appears to be taking in a large part of this number, it’s still worth comparing the numbers. Now, where are they going?
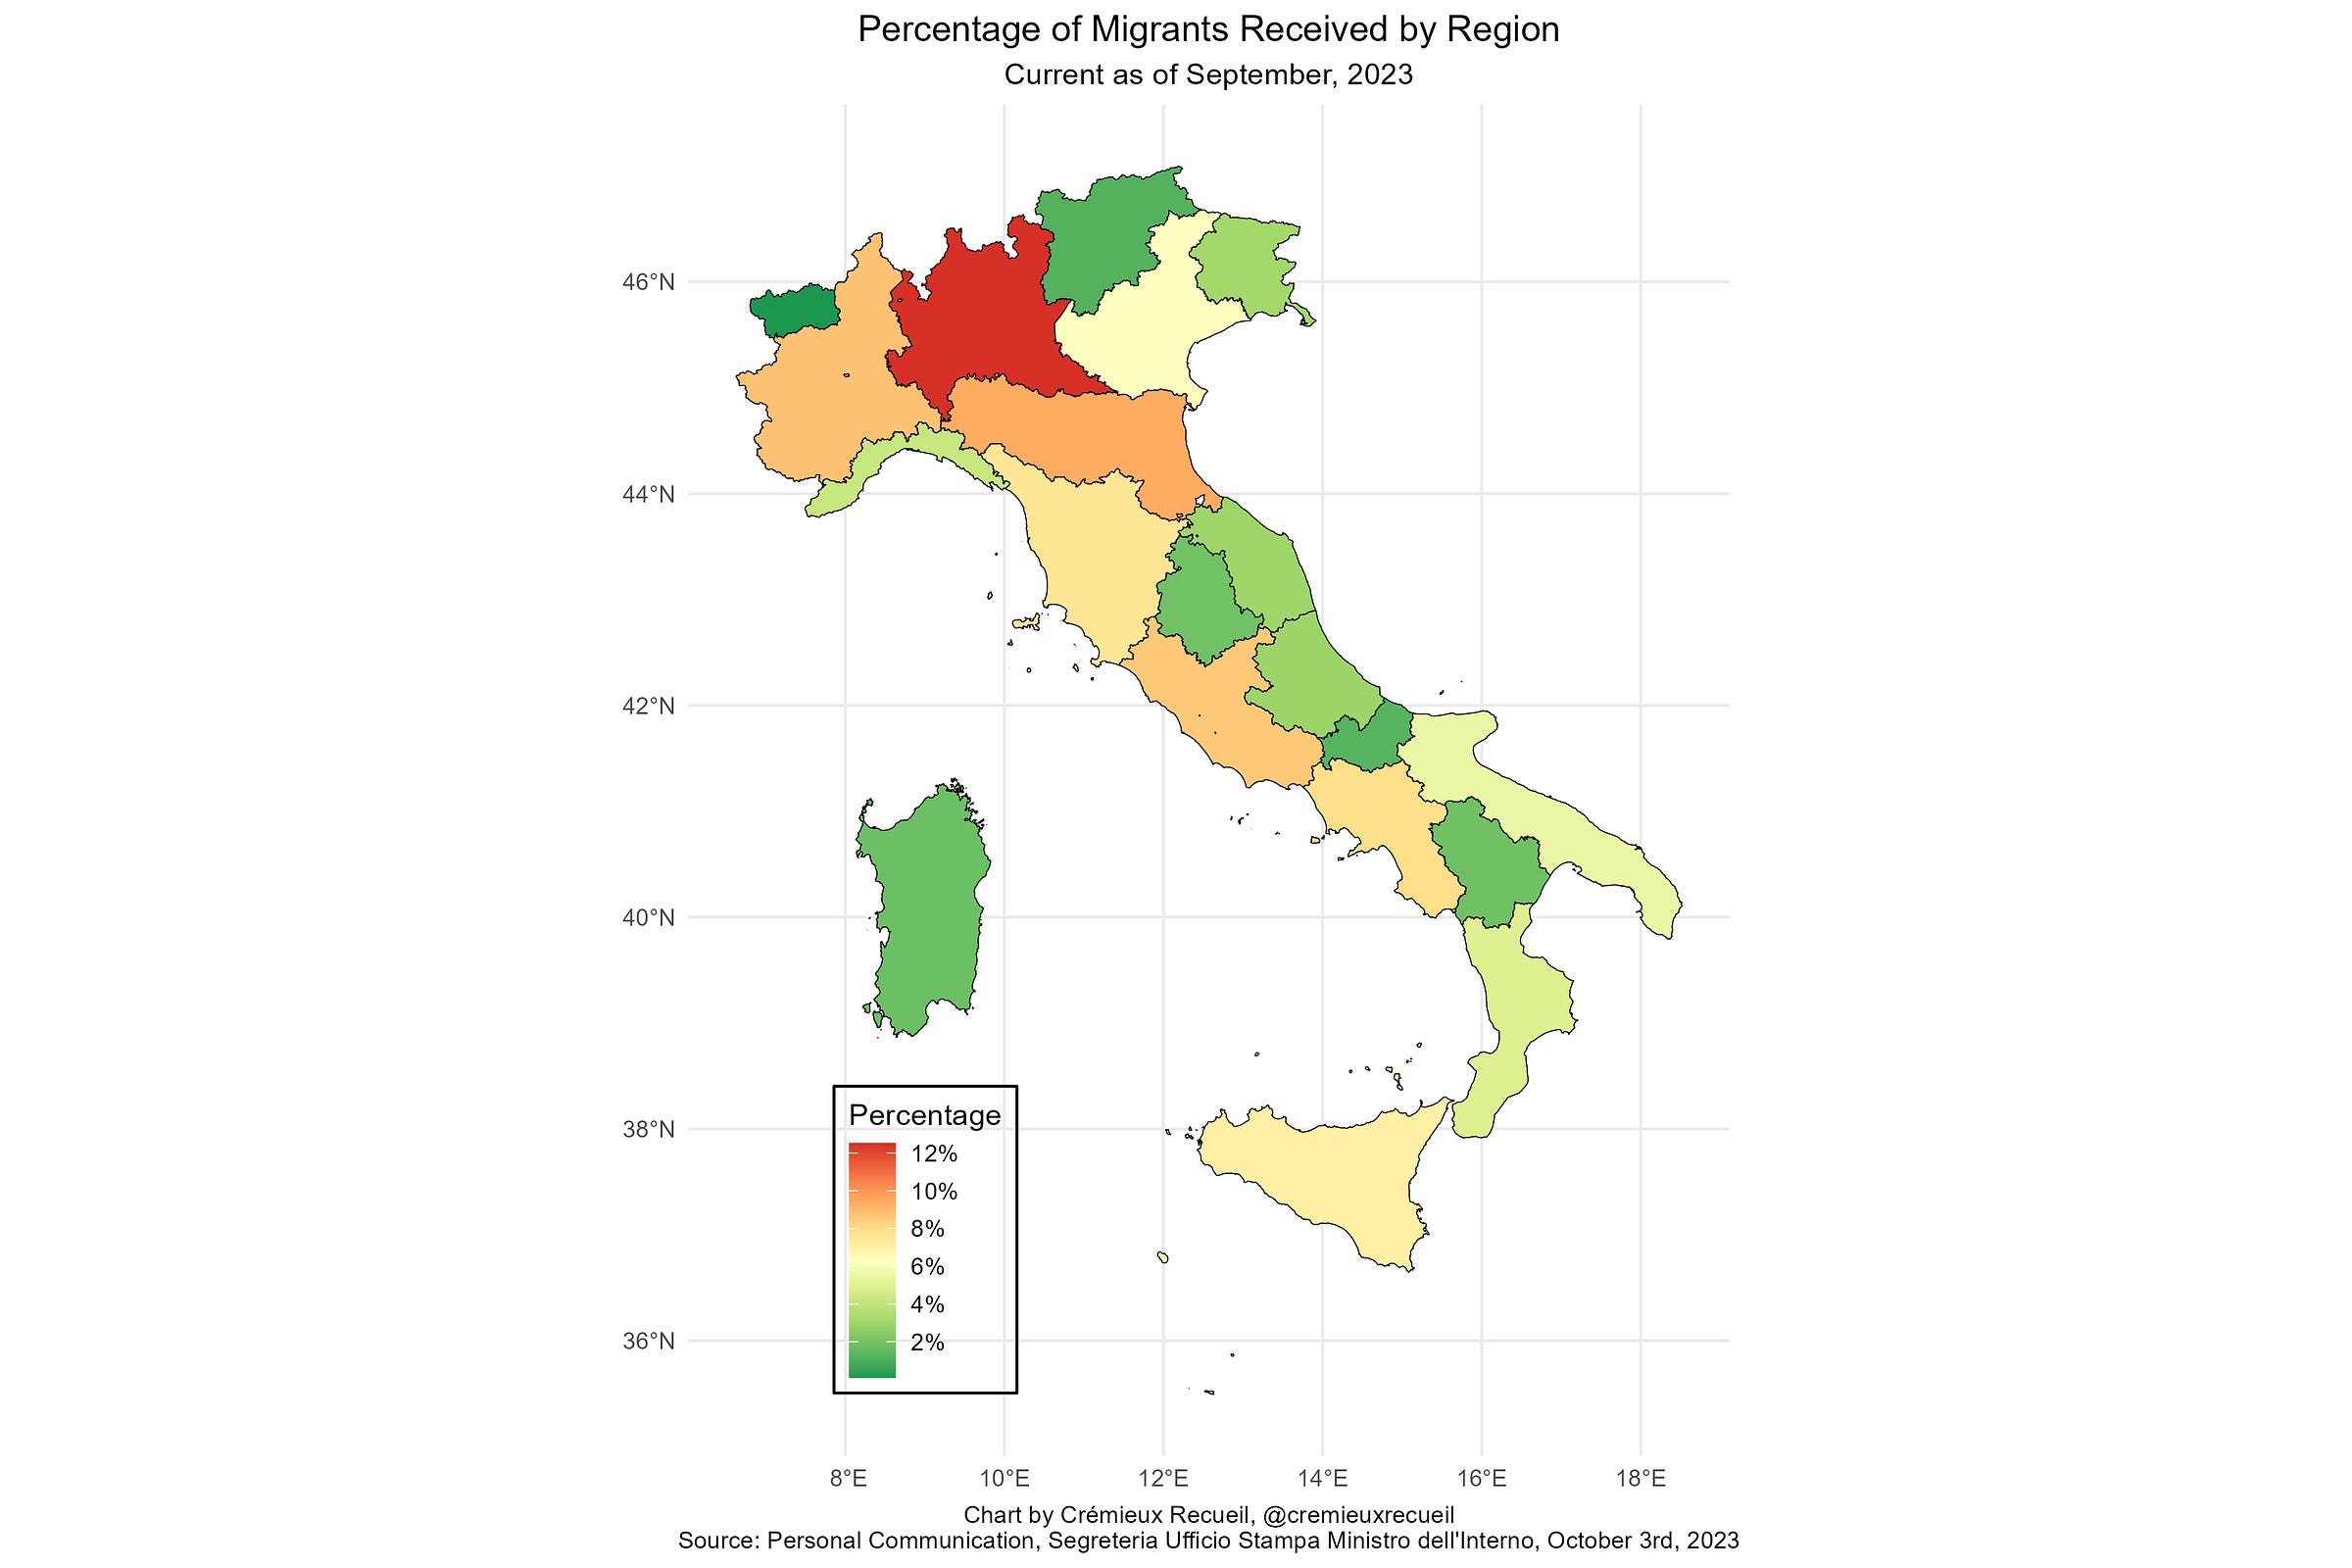
The region receiving the greatest proportion of the migrants is Lombardia (12.52%) followed by Emilia-Romagna (9.46%), Piemonte (8.78%), and Lazio (8.59%). Valle d’Aosta has only taken in 0.09% of the migrants, but in general, the south is taking fewer migrants, presumably because they’re less capable or willing.
Many of these migrants are minors, and a large portion of those minors are unaccompanied. How many? In 2021 and 2022, a total of 24,097 unaccompanied minor migrants were received. So far in 2023, 12,329 have been taken in. This year is set to break the previous years’ records.
So, where are these migrants from? Well, all over the place, but similar places as those who came over during the 2015 migrant crisis. Or in other words, places predicted by a combination of population size (+), wealth (-), and proximity (+), but not necessarily conflict.
To wrap this up, let’s look month-by-month at the migrant numbers. With these, we can make some reasonable speculations about how the total numbers for 2023 will end up.
Because migrant numbers have been fairly consistently greater in successive years, we can expect many more than 34,000 additional migrants to disembark by the end of the year. But we can be explicit with our projections. Here are the steps:
Calculate the month-to-month growth rate for the year 2023 through September.
Calculate the month-to-month growth rates for 2021 and 2022, and average them.
Average the growth rates obtained from steps 1 and 2 to obtain a combined growth rate.
Use this combined growth rate to project the numbers for October, November, and December of 2023.
If you know a more realistic means of doing projections, tell me what you think I should do and if it makes sense, I’ll post a graph of the result. I personally think this projection method overestimates, because it takes no account of seasonality. My personal estimate is around 187,000 without administrative action, which roughly splits the difference between averaging and linear projections. Here’s the result using both methods:
Finally, have you heard about Lampedusa? In the NPR article linked at the beginning of this article, there’s this quote:
Some 12,000 people — more than twice the population of this island — arrived here in a single week this month, according to deputy mayor Attilio Lucia.
While we do not have numbers for specific places like Lampedusa, we do have aggregated daily arrival numbers. So let’s see if they can support this claim.
If the majority of landings were in Lampedusa, then the claim is definitely possible.
The Situation in Italy
Italy has taken in a large number of migrants from the developing world. This number is likely to increase substantially if Italy doesn’t act. Only time will tell what happens next, but as for now, these are the numbers.


Great article! Who would have thought immigration could be weaponized against a country in such a way.