

Today’s post is brought to you by my sponsor, Mechanize. They’re hiring junior software engineers at $300K/year base salary.
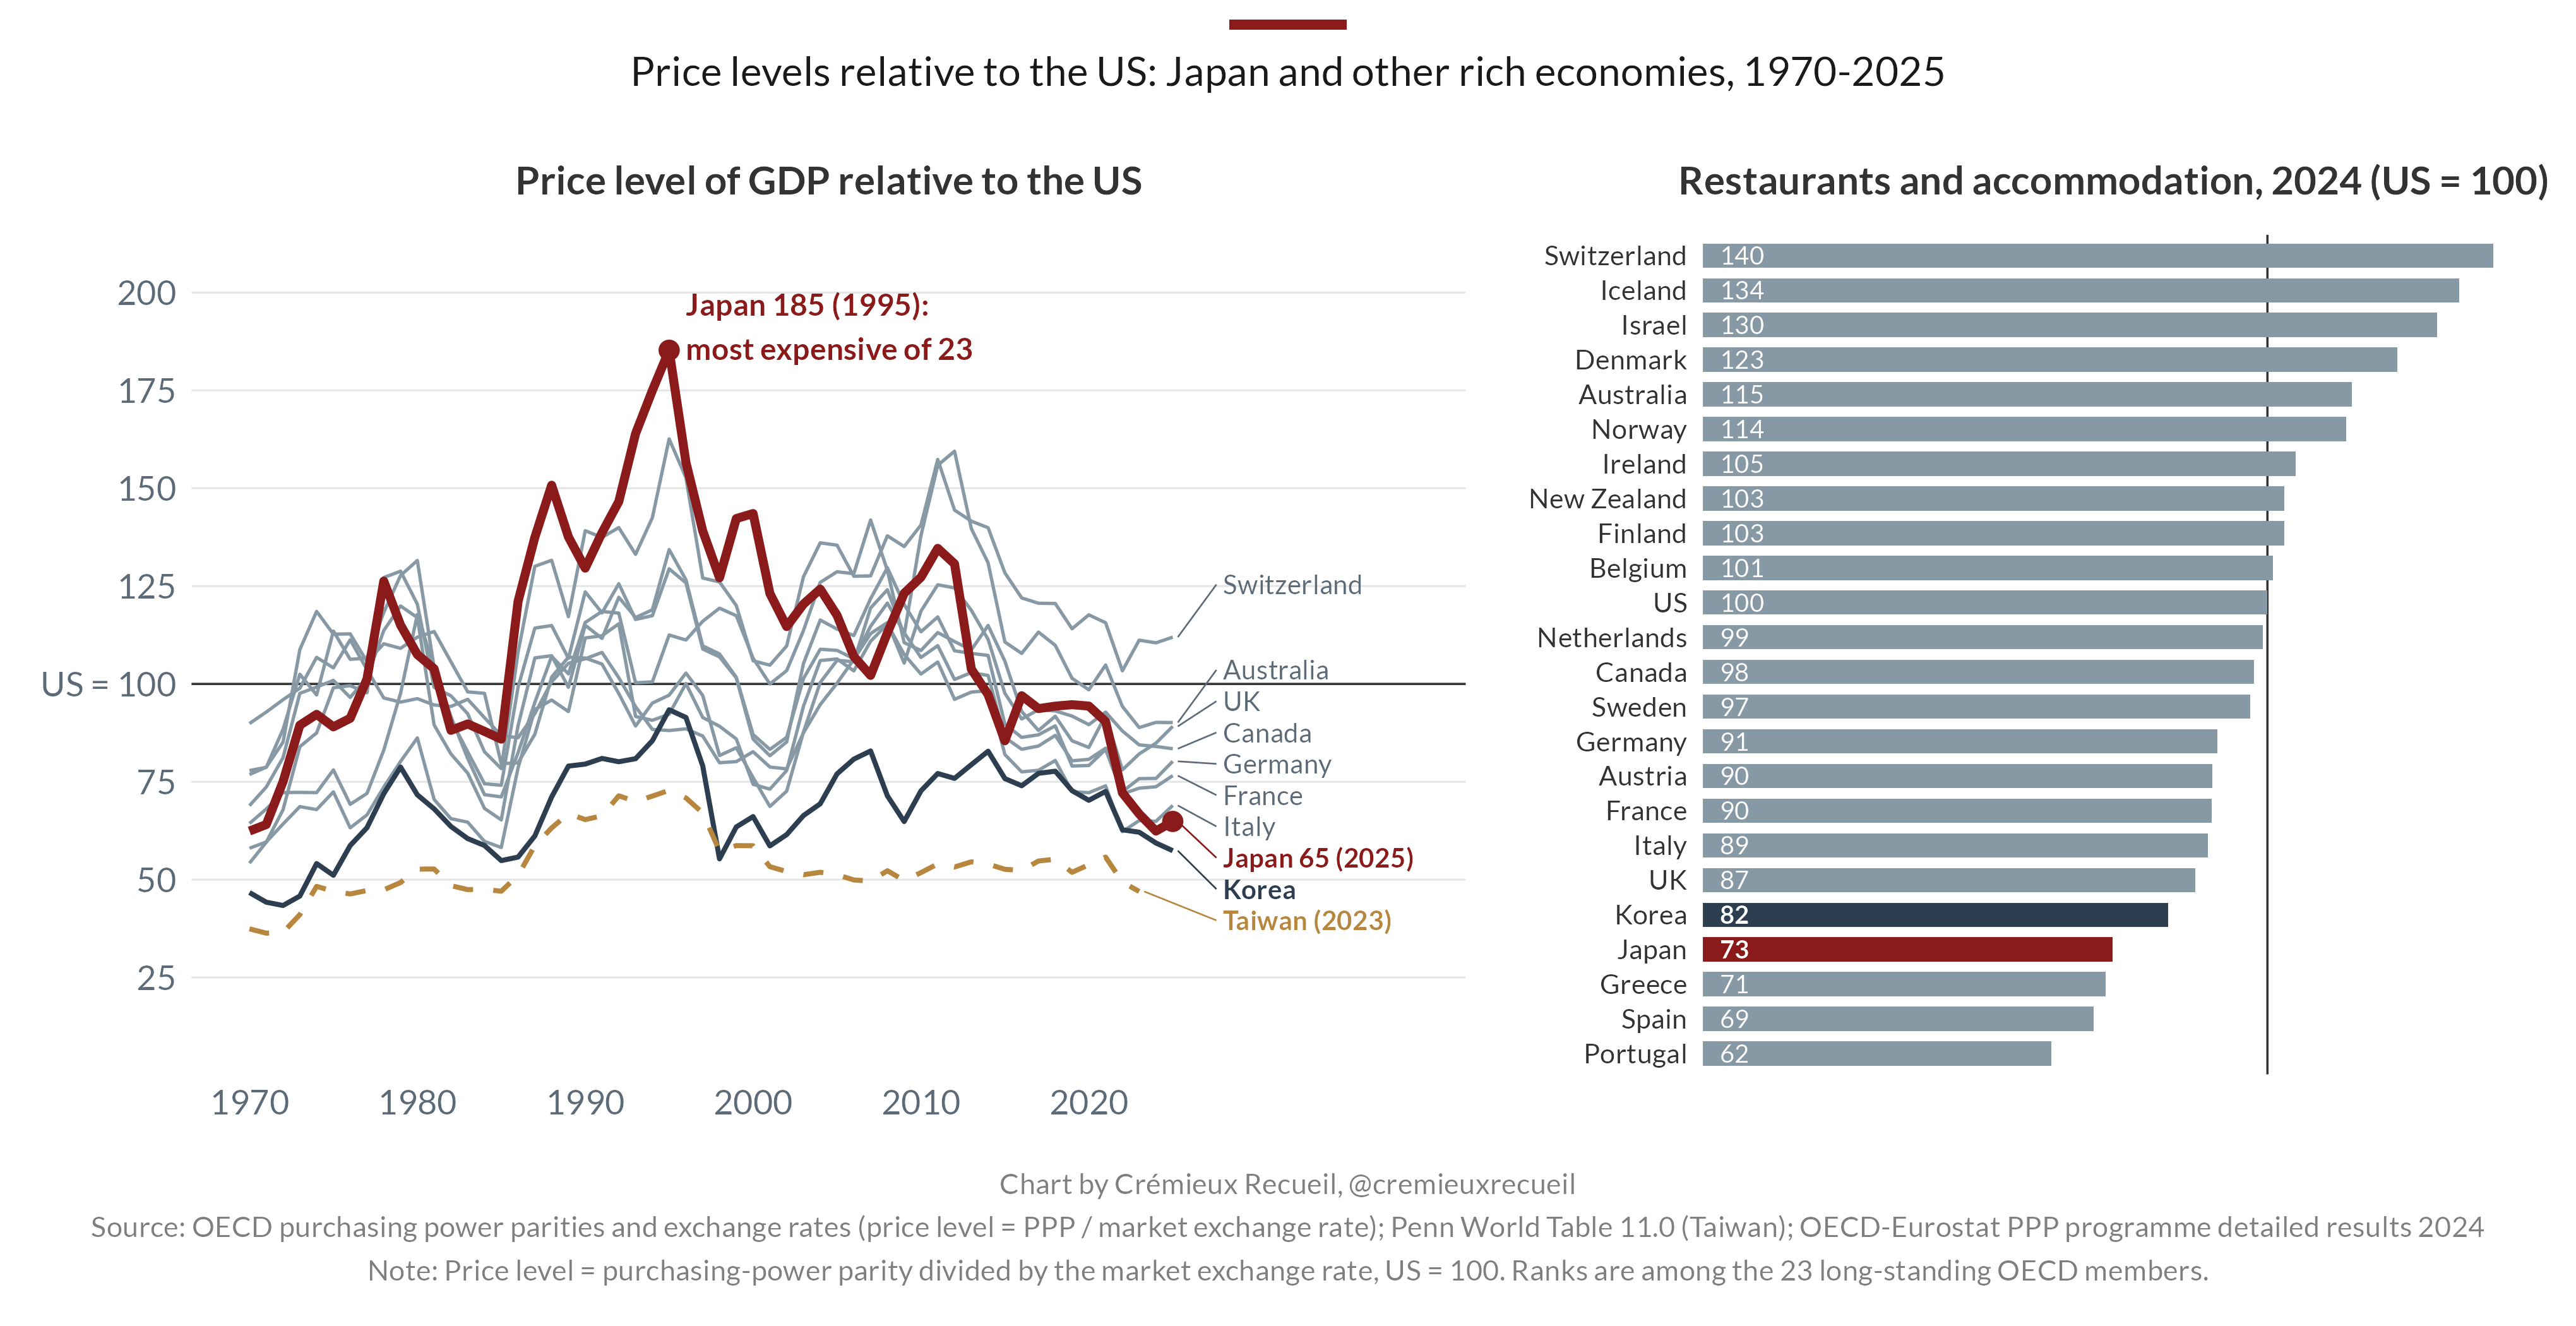
In 1995, Japan received 3.3 million foreign visitors. It was also the most expensive major economy, with a price level sitting at 185% of America’s, making it the highest of the 23 long-standing members of the OECD.
In 2025, Japan received 42.7 million visitors. Its price level was 65% of America’s, 20th of those same 23 countries. Only Spain, Portugal, and Greece clocked in cheaper.
Tourists have noticed: Japan is now renowned as a place where meals and hotels cost less than they do at home, where trains run on time, and where 7/11 clerks wrap your purchases like precious gifts. People return from Japan and ask:
Why isn’t America like this?
I want to propose an answer, not about every aspect of Japanese uniqueness, but why some of the key things tourists like about Japan—the low prices, the great service—are not distinct from the things that make Japan’s economy frustrating to regular Japanese people.
Japan Got Cheap and Tourists Followed
The Japanese tourism boom coincided with a collapse in the Japanese price level. Between 2012 and 2015, the price level collapsed from 131% of America’s to 85% while annual arrivals rose from 8.4 to 19.7 million. The real exchange rate for the yen fell simultaneously and now sits at its lowest level in more than half a century.
Prices rebounded somewhat and, between 2016 and 2019, Japan’s price level sat between 94 and 97% of America’s—around the middle of the pack for developed countries. But tourist numbers kept climbing to 31.9 million. The truly staggering cheapness of Japan is a post-2022 phenomenon.
Are Japan’s Low Prices Due to the Yen?
Is this rapid decline in prices just due to the yen’s exchange rate? It’s an obvious possibility if you know anything about Japan, and one could reasonably claim that the rise of tourism and the decline in the price level both stem from the weak yen. A regression of log arrivals on the log real exchange rate over 1990-2019 yields a very strong fit (R² = 0.64). Taking this at face value, it would seem that some 69% of the 2012-19 rise in tourism could be due to a weak yen.
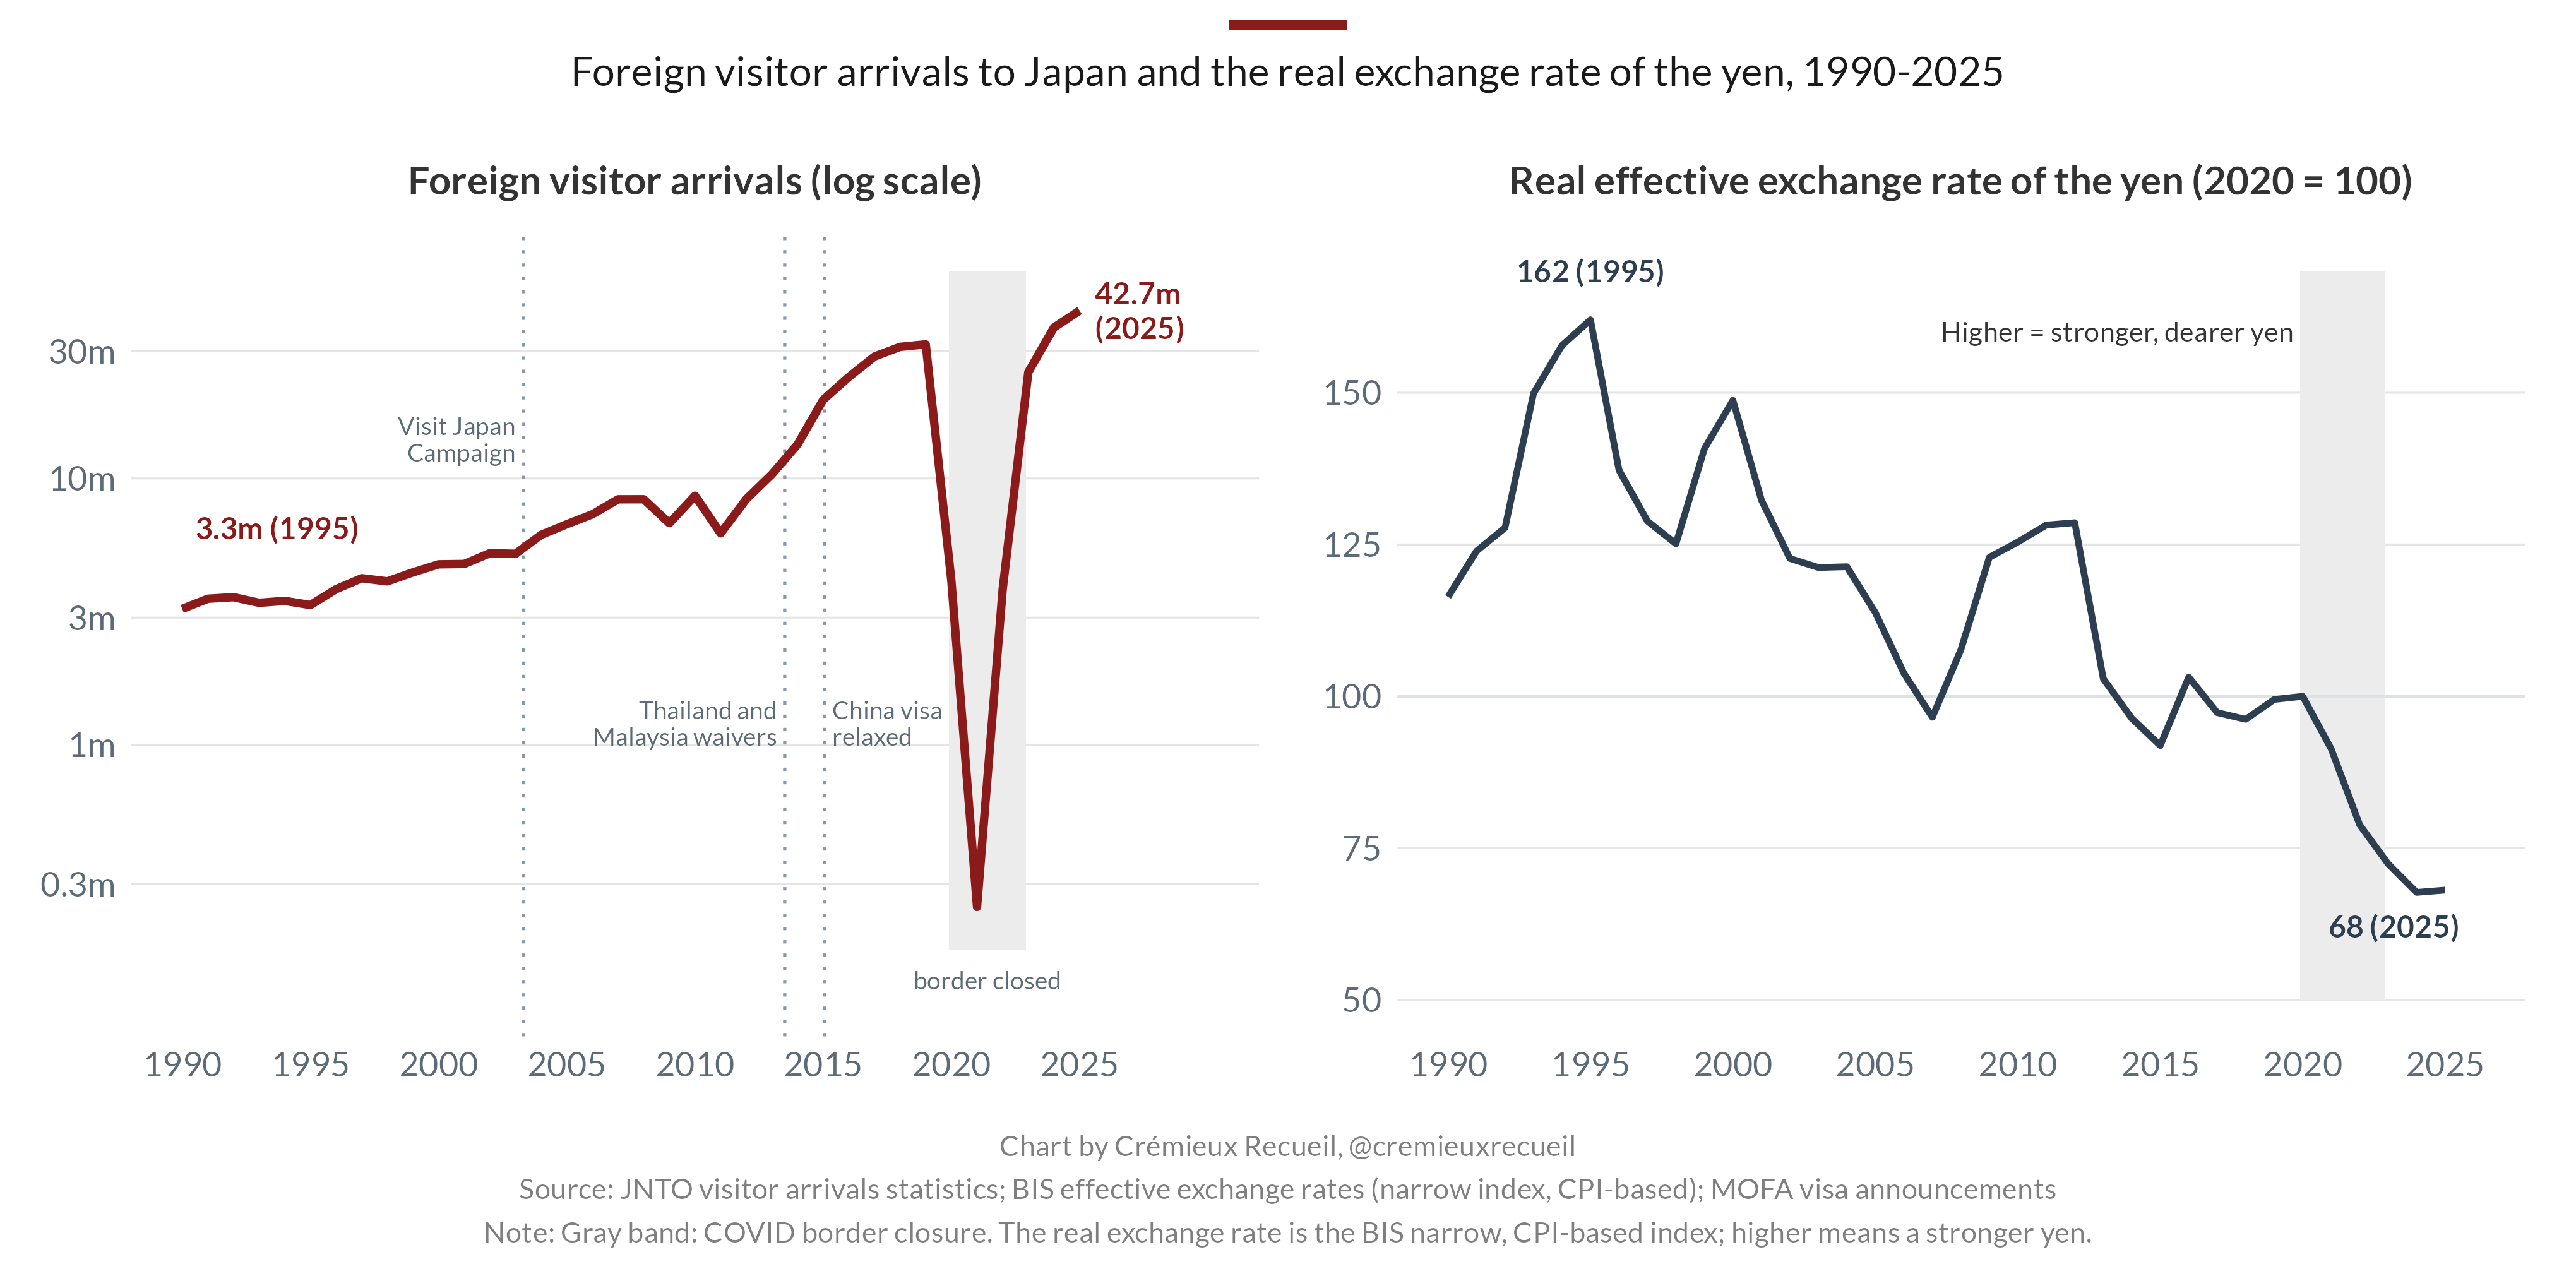
But such a model is univariate and liable to be incomplete. Japan’s government spent that same time deliberately courting visitors with initiatives like the Visit Japan Campaign (2003), expanded visa waivers for Thailand and Malaysia (2013), and relaxed visa rules for Chinese visitors (2015). If you add a time trend to the regression, the share explained by the yen falls to 23%; if you use those visa change steps, 6%; or with both, 11%.
There’s a case that the yen mattered, but not overwhelmingly or even dominantly.
If we take the case further and compare visitors’ home countries with each other, we can get a stronger answer because the yen did not fall equally against each currency. Between 2012 and 2019, the yen got 44% cheaper in real terms for Americans and 57% cheaper for Hong Kongers, but not cheaper for Australians or Russians. Australians got no cheaper yen, but three times as many of them showed up on Japanese shores. To be sure, arrivals from the countries whose currencies gained most did grow a bit faster, but in a panel of 20 different, prominent origin countries, the cheaper yen looks to only explain about a fifth of the rise between 2012 and 2019 (18%, 95% CI: 2-34%).1
The Two Japans
When thinking about Japan, one should think of two distinct economies. When you take Japan’s service and manufacturing sectors and adjust their outputs by their industry-specific price levels, you notice a gulf in productivity between the two. Japanese transport services, for example, cost 2.5-times what they do in America, and they trade at about 1.2-times, while their manufactured goods are 14% cheaper than American ones. Converting at those prices, Japan’s manufacturing output per worker is 69% of America’s and its market services output is 58%—close to the Japan Productivity Center’s 63% and 50% estimates.
This becomes a lot more dramatic when you think about it in terms of total factor productivity (TFP). Jorgenson, Nomura and Samuels found that Japanese manufacturing TFP was essentially at the U.S. level: the median manufacturing industry was at 0.995 of the U.S. level in 2005, 9-of-18 were at or above it, and primary metals and motor vehicles were well ahead of it. Non-manufacturing TFP, on the other hand, sat at 0.855, with wholesale and retail at 0.67. They found that manufacturing TFP peaked at 104% of the U.S. level in 1991 and the gap was basically negligible in 2012.


The curious thing is that Japanese manufacturing matches America on TFP, but not on output per worker. But this reflects the fact that Japan uses less capital per hour worked. For the whole economy, Japan’s TFP is way off from America’s, at 0.83 in 2012, with output per hour at 0.59. Both gaps are larger than they were in the 1990s.
Since then, Japan’s manufacturing TFP has slipped. Measuring it in the same ways in 1997 and 2017, their output per hour relative to the U.S. fell from 99.5% to 64% in machinery, electrical, and ICT equipment, from 87.7% to 60.8% in transport equipment, and from 95.6% to 75.4% in primary metals. Chemicals remained ahead of the U.S. and manufacturing as a whole hasn’t slid since the mid-2000s.
Unfortunately for Japan, at market exchange rates, the collapse looks catastrophic, from 74% of the U.S. level in 2005 to 35% in 2024, with almost all of that being due to the yen. And this happened even though Japanese value-added per manufacturing worker, in dollars, barely changed, from approximately $90,000 to $80,000, in a period where the American figure almost doubled.
Comparing Japan to Europe makes the peculiar Japanese situation even clearer. Japan’s manufacturing output per worker (69% of America’s) beats Germany (59%) and France’s (56%), while its market services (58%) trail Germany’s (82%), France’s (79%), and Britain’s (70%). In other words, Japan is great at making things, but it’s bad at selling them.
Check this footnote to read about the economic role of Japan’s aging population.2
Why Doesn’t Productive Manufacturing Make Services Expensive?
Economists have an explanation for why consumer prices and wages tend to be systematically higher in wealthier, more productive countries—the Balassa-Samuelson effect. Theoretically, highly-productive factories should pull up service-sector wages and prices, but in contemporary Japan, they don’t seem to.
To understand this, start by taking currency out of the picture. A swing in the yen changes the price of Japan’s good and its services by the same factor, so the price of services relative to goods isn’t dependent on it. By that measure, Japan has become cheap from the inside: in the OECD’s international price comparisons, Japan’s services relative to its good were priced 2% below the average in 1996 and 13% above it in 2002, while being 22% below in 2024. No other country’s relative price of services has fallen like this.
For factories to explain Japan’s cheap services, they would need to have fallen off, but they haven’t. In national accounts, real output per worker in Japanese manufacturing grew 2.2% per year from 2002 to 2022, which is very close to the 2.4% per year American growth rate. Contrarily, services grew just 0.2% per year versus America’s 2.1%. Japan’s factories pulled even further ahead of its services than those of any rich country.
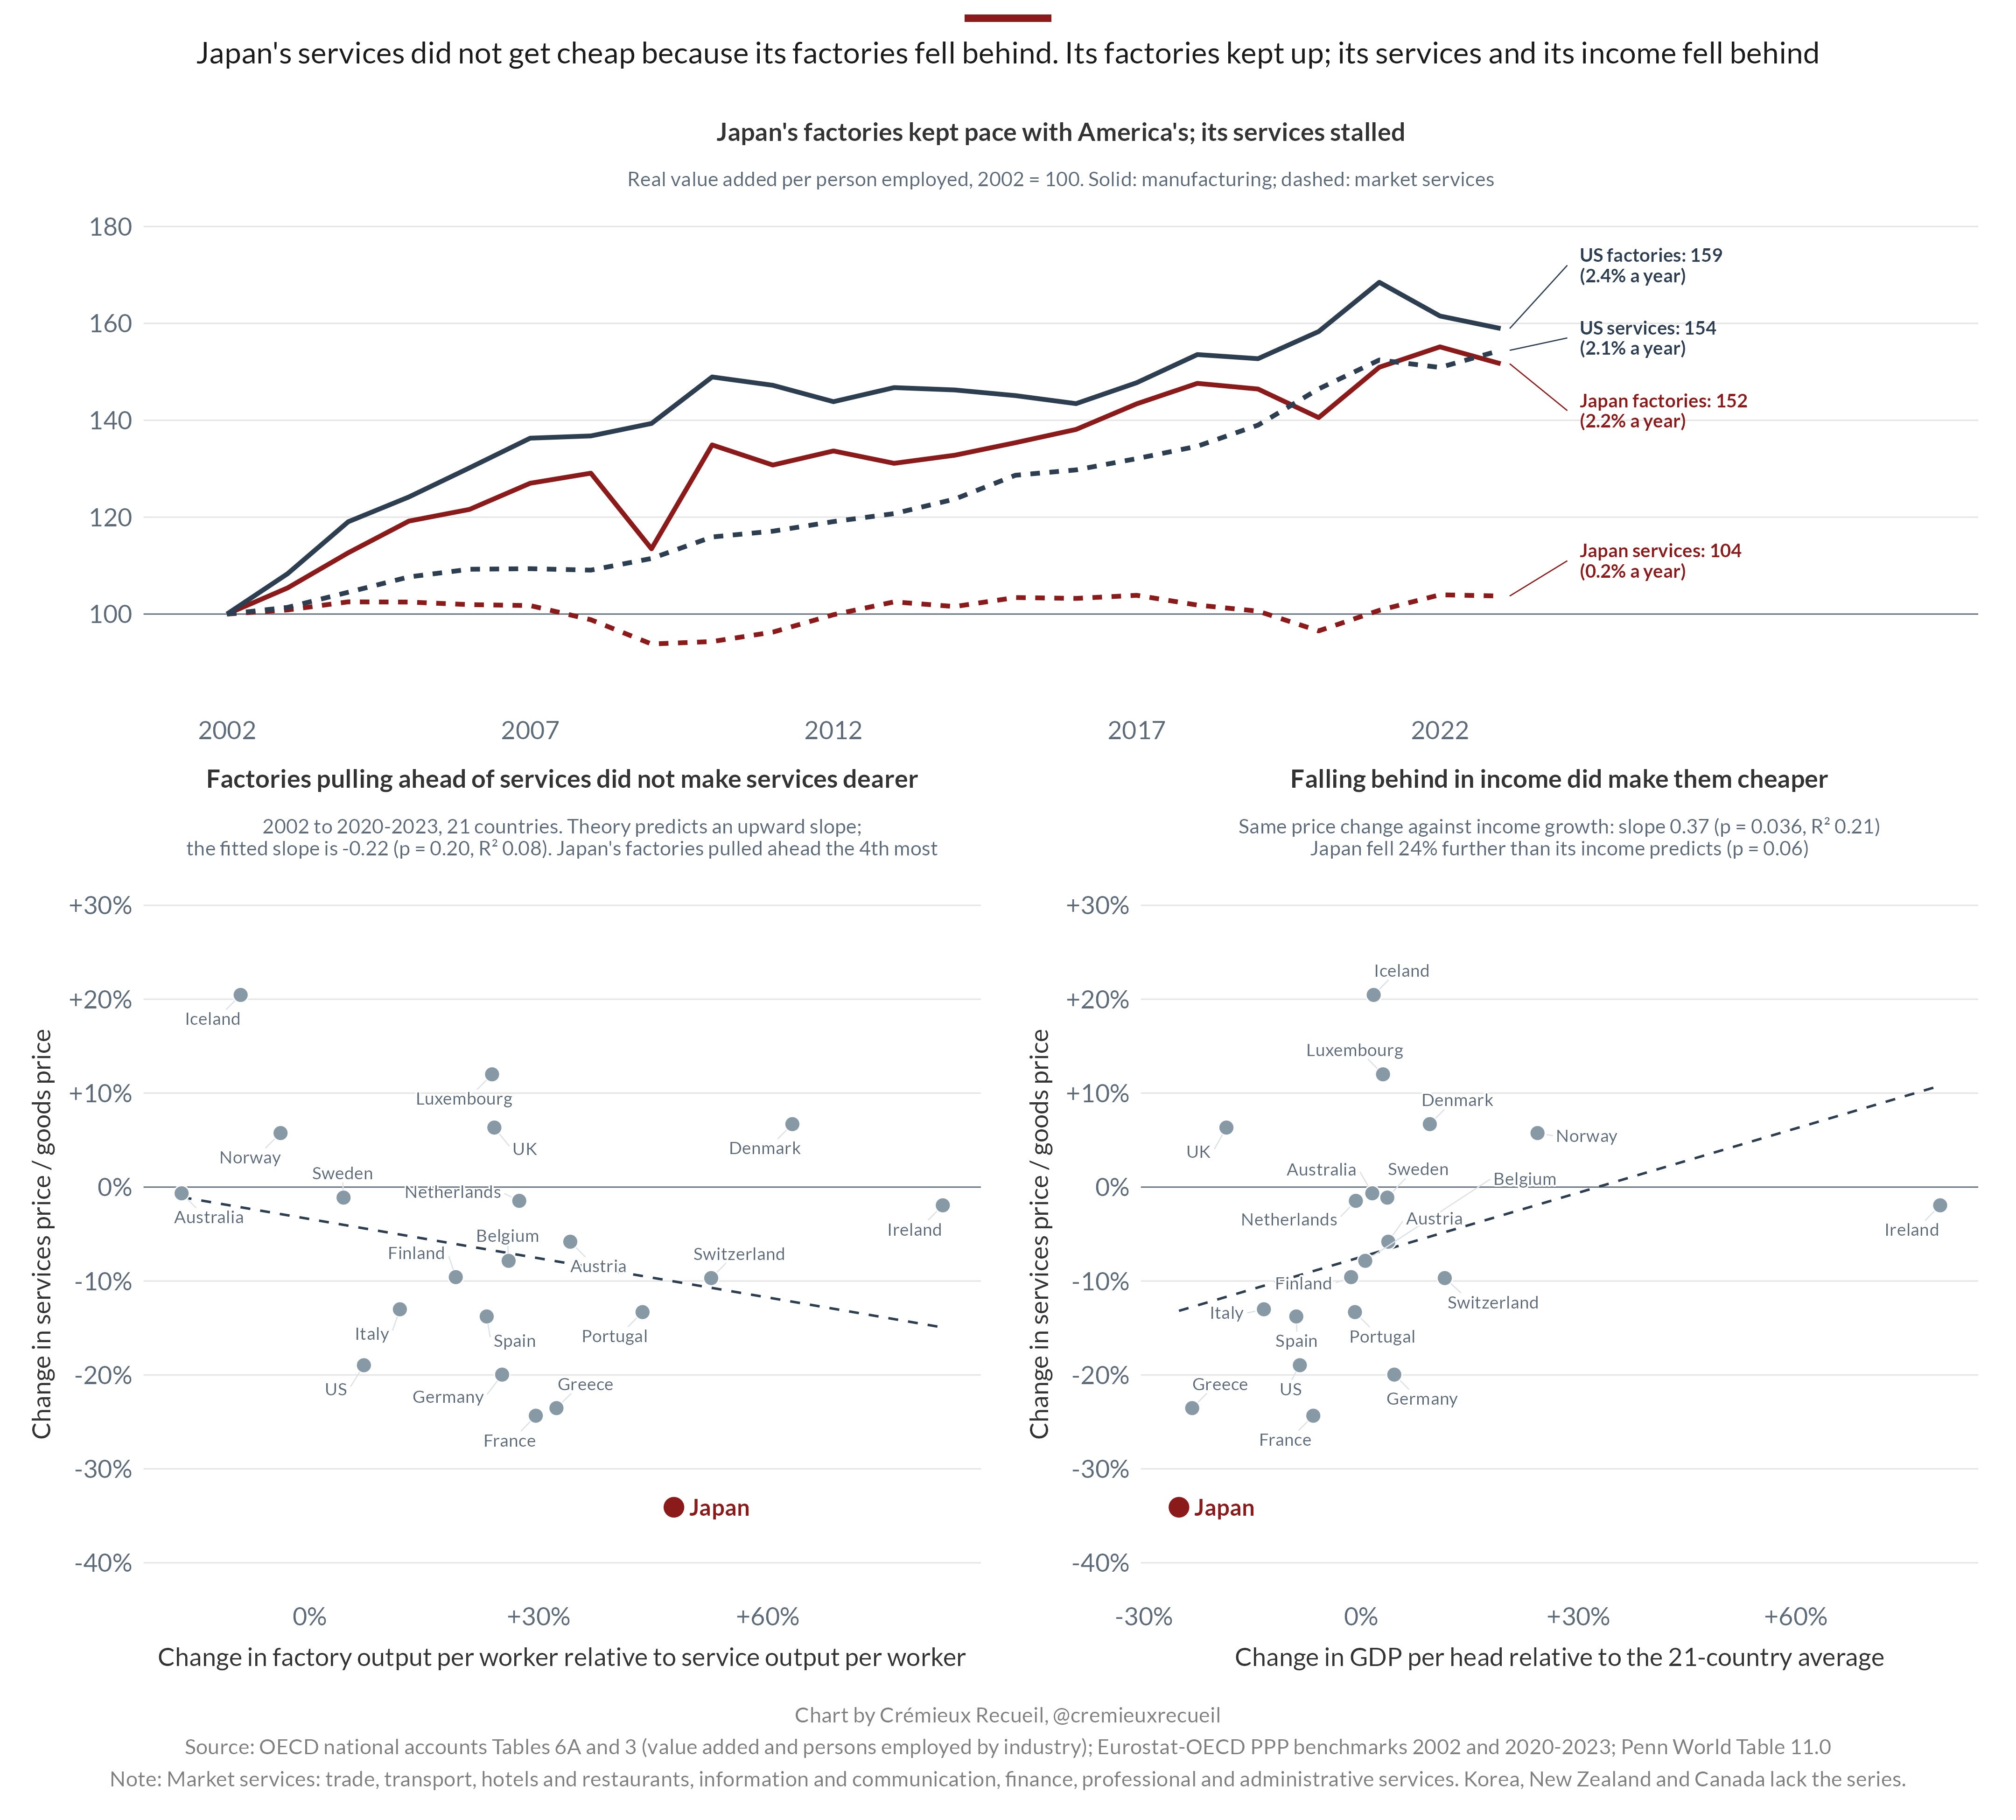
Across 21 developed countries, factories pulling ahead of services didn’t predict cheaper services; the slope, if anything, pointed the wrong way. Falling behind in income, however, did predict cheaper services. Measured from 2002, Japan’s fall is larger than income predicts (by 24%!), but measured from 2005, it lines up. So, Japan’s factories cannot explain why its services are cheap; its service industries and income both fell behind, and prices followed income.
In levels, Japan’s price levels sits about where its income predicts it should be. Services are relatively cheaper in richer countries, and at purchasing-power parity, Japan has gone from one of the richest developed countries in 1996 to being one of the poorest. At its current income, Japan’s services are about as cheap as the rest of the rich world’s pattern predicts, clocking in just 7% below the line. But, curiously, most of what makes Japan cheap is housing: rent, water, and energy are the fifth-cheapest among developed countries relative to goods; cut them out and Japan’s consumer services are just 1% below where they’re predicted to be.
Some of Japan’s declining income is a demographic phenomenon. Japan’s share of people aged 15 to 64 was roughly average for a rich country in 2002 (67%), but now it’s near the bottom (59% vs. 64% on average). This alone accounts for a third of the fall in their incomes relative to the rest of the OECD, but it still doesn’t account for prices, where Japan sits near the line either way. Further, Japan’s fall since 2002 beyond what income predicts is no smaller (28% vs. 24%). If anything, aging should push the other way in effect, making services more costly because the number of workers is declining.
Japan’s cheapness is not about the yen, and it isn’t a special Japanese discount on services either. It’s what a country that’s grown poorer than its peers—but which keeps building homes—looks like in prices.3
Another Two Japans?
A labor market split in two—beyond the services/manufacturing split—could help to explain why Japanese manufacturing pay doesn’t seem to spill over into the service sector. The share of Japanese employees on non-regular contracts rose from 15% in 1984 to 37% in 2025, and to 52% among women. Full-time non-regular workers earn two-thirds of what regular workers do, and that leaves our part-timers. A split like that could allow factory productivity to stay inside factories, instead of spilling into service wages. But the split runs across the economy rather than being concentrated in services: the non-regular vs. regular pay gap is no wider in hotels and restaurants—as a sector—than it is in manufacturing. The difference lies in the proportions within those industries.
Japanese employment law makes it incredibly hard to dismiss regular employees. The state subsidizes firms that keep workers on rather than laying them off and banks and governments have long been reluctant to let failing firms actually fail. Japanese firms are rarely born, but they also rarely die.
In 2015-17, new employer firms were born at a rate of 5.3% a year in Japan and they died at 3.5%—some of the lowest rates in the OECD. In Germany, by contrast, the rates were 6.6% and 7.6%, and even in infamously anemic Britain, they’re 15.1% and 10.9%. Over four decades, the gap has mostly been about entry in Japan, as the opening rate fell from 7.2% in 1981 to 3.8% in 2024 while the closure rate stagnated.
Caballero, Hoshi and Kashyap famously documented the phenomenon of “zombie” firms kept alive by bank forbearance in the 1990s. Unfortunately, those firms, and the phenomenon more generally, have not gone away. Teikoku Databank—Japan's largest and most prominent corporate credit research and business intelligence provider—counts firms that have failed to cover their interest payments for three years in a row, firms aptly considered to be “zombies”. About 10% of all Japanese firms met this definition in the period 2016-19, and this rose to 18.2% in 2022 after ¥44 trillion of pandemic “zero-zero” (zero-interest, zero-collateral requirement) loans. After a bit of post-COVID recovery, the number dropped to a still-staggering 14.3% in 2024.4
Is The Issue Staffing Numbers?
These firms are not very productive; they are not good places to put employees, making them a blight on Japanese labor productivity. But if Japan is keeping labors in low-productivity service jobs, which industries are they in? The tempting answer for visitors is that Japan just overstaffs generally, putting more people behind countries, having more staffer per hotel room, and bringing more servers to every table. But this turns out to be wrong.
Per establishment, Japanese shops, hotels, and restaurants staff their storefronts at German levels: 8.95 people per retail establishment in Japan versus 8.91 in Germany; 7.3 people per restaurant against 7.1 in Germany; 0.32 employees per hotel room versus 0.44 in Germany and 0.29 in France. But, unlike these heavily tourist-facing areas, Japan actually does stand out when it comes to retail per resident.
Japan has 49 full-time-equivalent retail workers for every 1,000 residents, making it the most well-staffed of any country in the OECD: 16% more than America and 46% more than Germany. It gets to this point by combining German-sized shops with greater numbers of shops (6.4 per 1,000 versus 4.7 for Germany; France, Italy, and Spain have more shops, but far fewer people staff them). And those workers? They produce about $20 of value-added per hour against $36-43 in France, Germany, and the U.S.
Hotels and restaurants do not follow this pattern, and per resident, Japan actually has the fewest accommodation workers in the OECD and fewer food-service workers than the U.S. or Korea. Productivity is low in those areas, but the idea that it’s low because of more people serving customers reaching diminishing returns is only true of shops, not the whole service sector.5
Is Is The Big Store Law?
People familiar with Japan might suspect that the explanation is Japan’s Large-Scale Retail Store Law, which gave local shopkeepers a say a bout big stores being opened near them between 1974 and 2000. If the law—enforced particularly strictly in the 1980s—built Japan’s retail sector, the labor occupying it might be a legacy of a particular regulation than of labor institutions more broadly.
This is a tempting idea, but it’s not likely to be a good explanation. Japan has 14.1 retail shops per 1,000 residents in 1982, when enforcement was at its strictest, comparing favorably to the 6.4 per 1,000 in 2021. Nearly all of the decline between these two periods was in family-run shops, which went from 10.7 to 2.2 per 1,000.
The decline began in the 1980s and after repeal in 2000, it accelerated, but the number of people working in retail never fell. Counting all heads in the industry rather than full-time equivalents alone, it was 50 per 1,000 in 1982 and 56 in 2021, as the average shop grew from 3.6 people to 8.7. Economists who have studied the law have noticed this. Flath found that he could predict Japanese shop density from car ownership, housing, and geography, without any need to invoke regulations. Accordingly, he estimated that fully cutting it would only reduce the number of shops by about 15%.6
The Real Culprit: Smart People in Dumb Jobs
In 2012, Japanese adults had the highest literacy of 21 OECD countries and the second-lowest use of their skills at work. When it comes to the gap between measured skills and their use, Japan is consistently #1 regardless of the measure being used. In the 2023 round of this survey, 35% of Japanese workers held qualifications about what their jobs required—the second-highest share in the whole OECD and among associated countries.
(A fascinating side note: if you ask Japanese people, they’ll say this is wrong. When asked directly, Japanese workers are the least likely in the OECD to say they are overskilled for their jobs, and the most likely to say they’re underqualified. I suspect this is just modesty, because we know they’re wrong based on testing skills, watching work, and measuring output.)
That number applies to the whole workforce. Looking only at shops, hotels, and restaurants, Japanese retail, wholesale, and lodging workers have a mean literacy score of 285, second only to Finland’s, and higher than the average for all workers in 26 of the 29 other countries in the survey. This score is 8 points below Japan’s as a whole, indicating something interesting: Japanese shops don’t recruit from higher in the skill range for Japan, they recruit from a population that is simply uniformly quite skilled by international standards. What stands out further is credentialing, where Japanese service and sales workers frequently have advanced degrees. In fact, 40% of them have a tertiary degree, the highest share across the whole OECD. Korea is #2 by this measure.
Talent For Cheap
Japan is clearly spending a lot of talent on service work that isn’t rewarded very heavily or producing very much. Given more talented people tend to do better work, you’d expect Japanese service quality to be quite good as a result, and you’d expect this to not be priced in, because nobody is paying people to be overqualified for their work.
A 2017 Japan Productivity Center survey looked at this in an interesting way: they asked Japanese people who had lived in the U.S. and Americans who had lived in Japan how much more they’d pay for the Japanese version of 28 services and how much more they thought it actually cost. Japanese respondents would pay more for 26 of the 28 categories, with parcel delivery and taxis at about 18% more, but they thought the Japanese versions cost about the same. Americans directionally agreed.
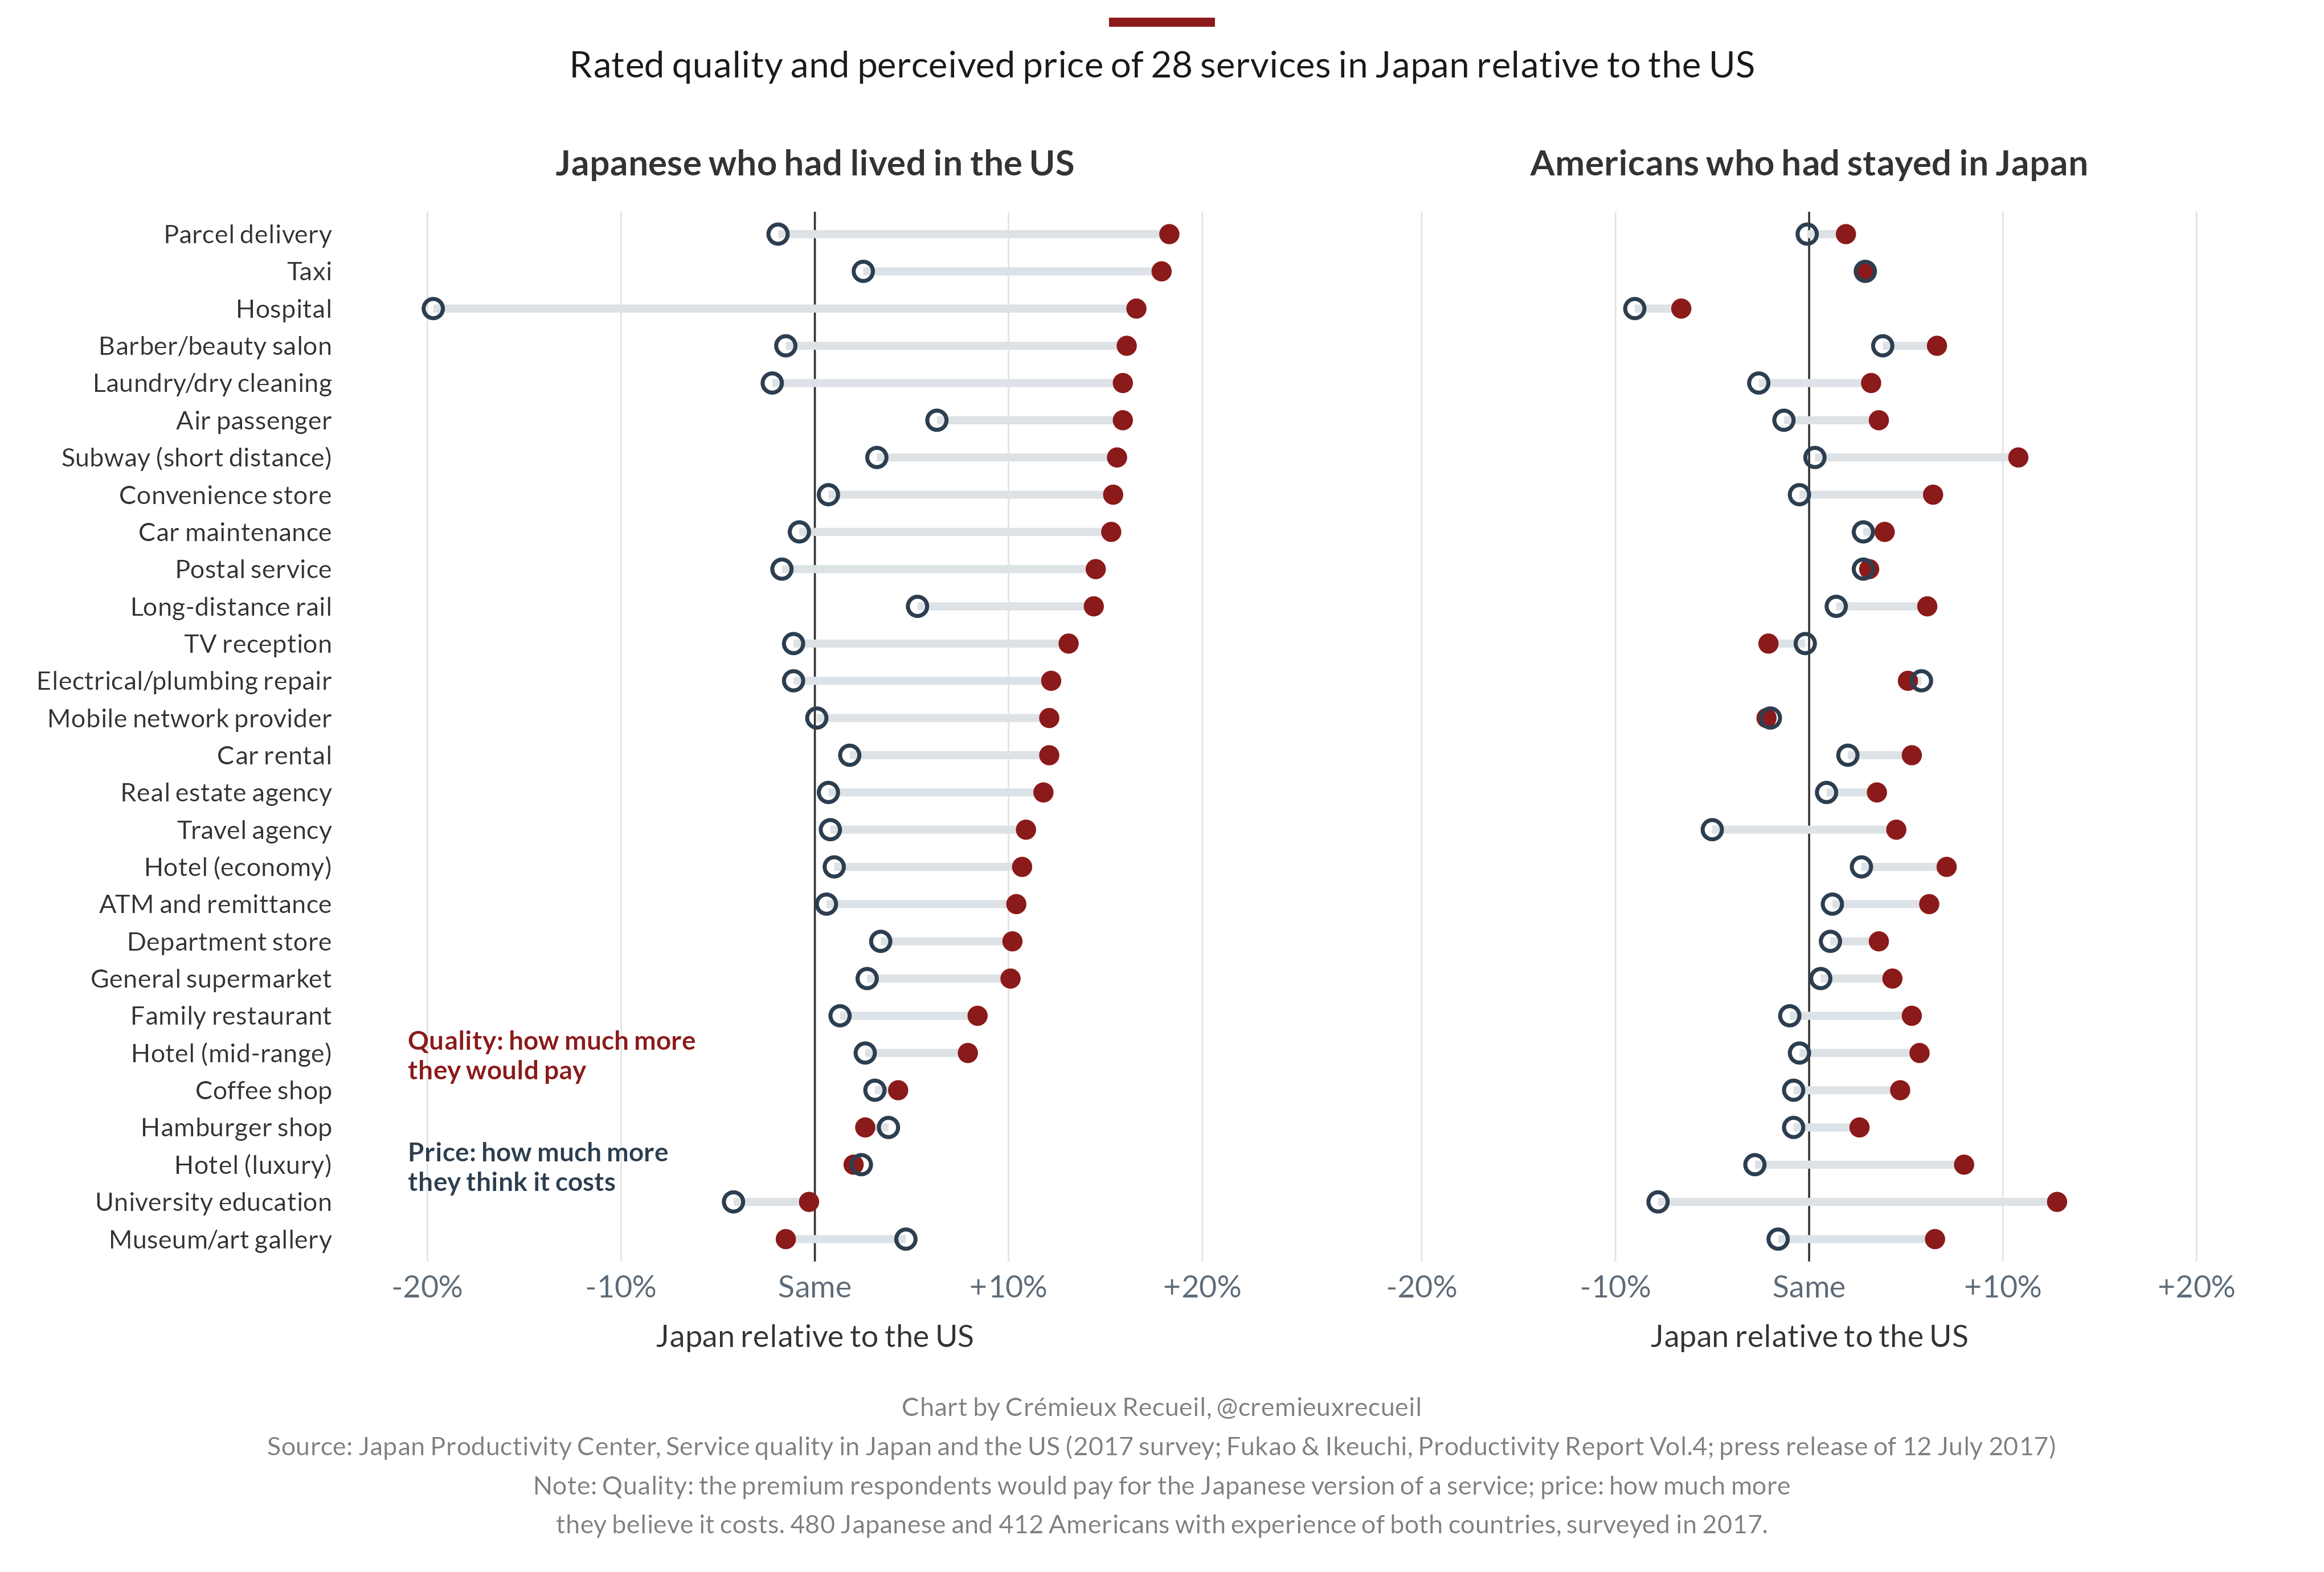
That premium is real, but quantitatively minor relative to the productivity gap. Adjusting for it raises Japan’s measured service productivity by 3-22%, but still leaves it at 40-54% of America’s. So the idea that Japan isn’t actually misallocating skilled workers because people value what they do wouldn’t hold up, as most of the gap is not quality anyone would actually pay for if it were an option.
Why do the Japanese Accept This?
I can’t speak to all the reasons for this, but I have a suspicion about a material reason why the Japanese accept this peculiar labor market: low wages are easier to live on when housing is cheap, and housing in Tokyo is extremely cheap because of how much Tokyo builds.
Compare Tokyo to California or England writ large—which should be able to match a highly-developed urban area!—and the building pace in the latter two places comes out looking totally laughable:
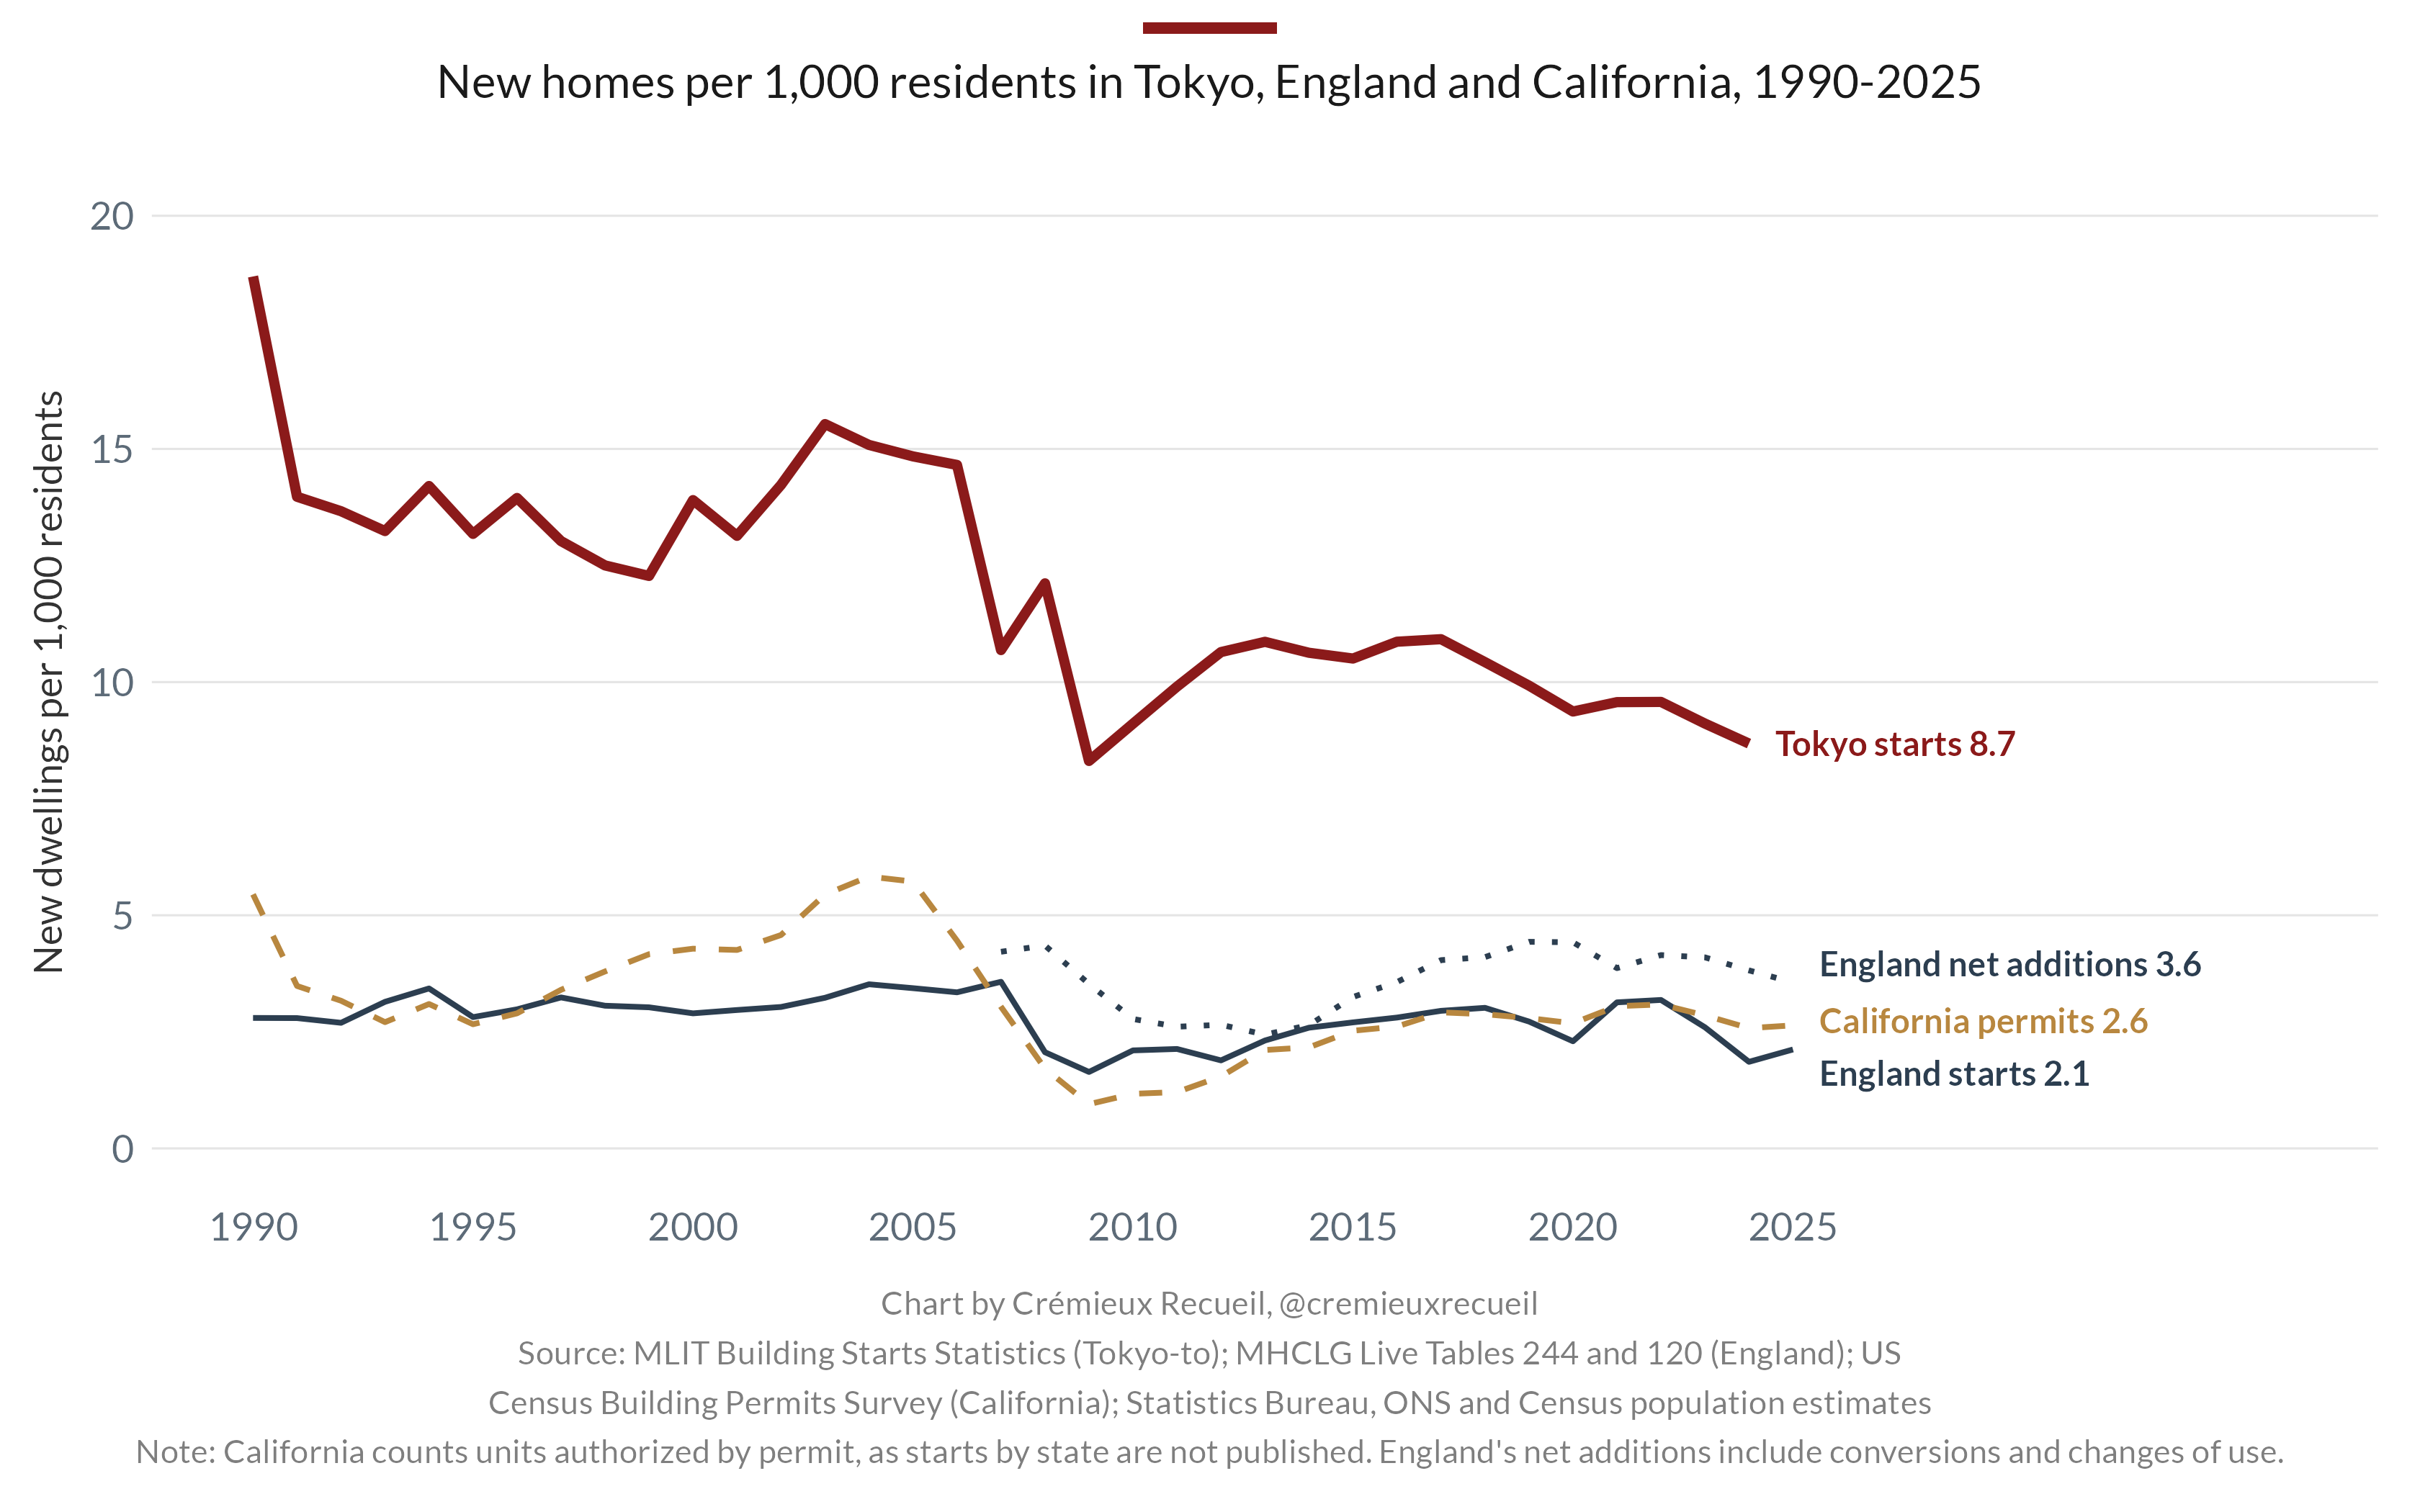
The result of this really is that, despite their low wages, Tokyoites can afford to live there. (The same is true for Seoulites, but not due to housing construction as much as being due to the lump-sum deposit worth about ten months of pay which tenants are compelled to hand over.)
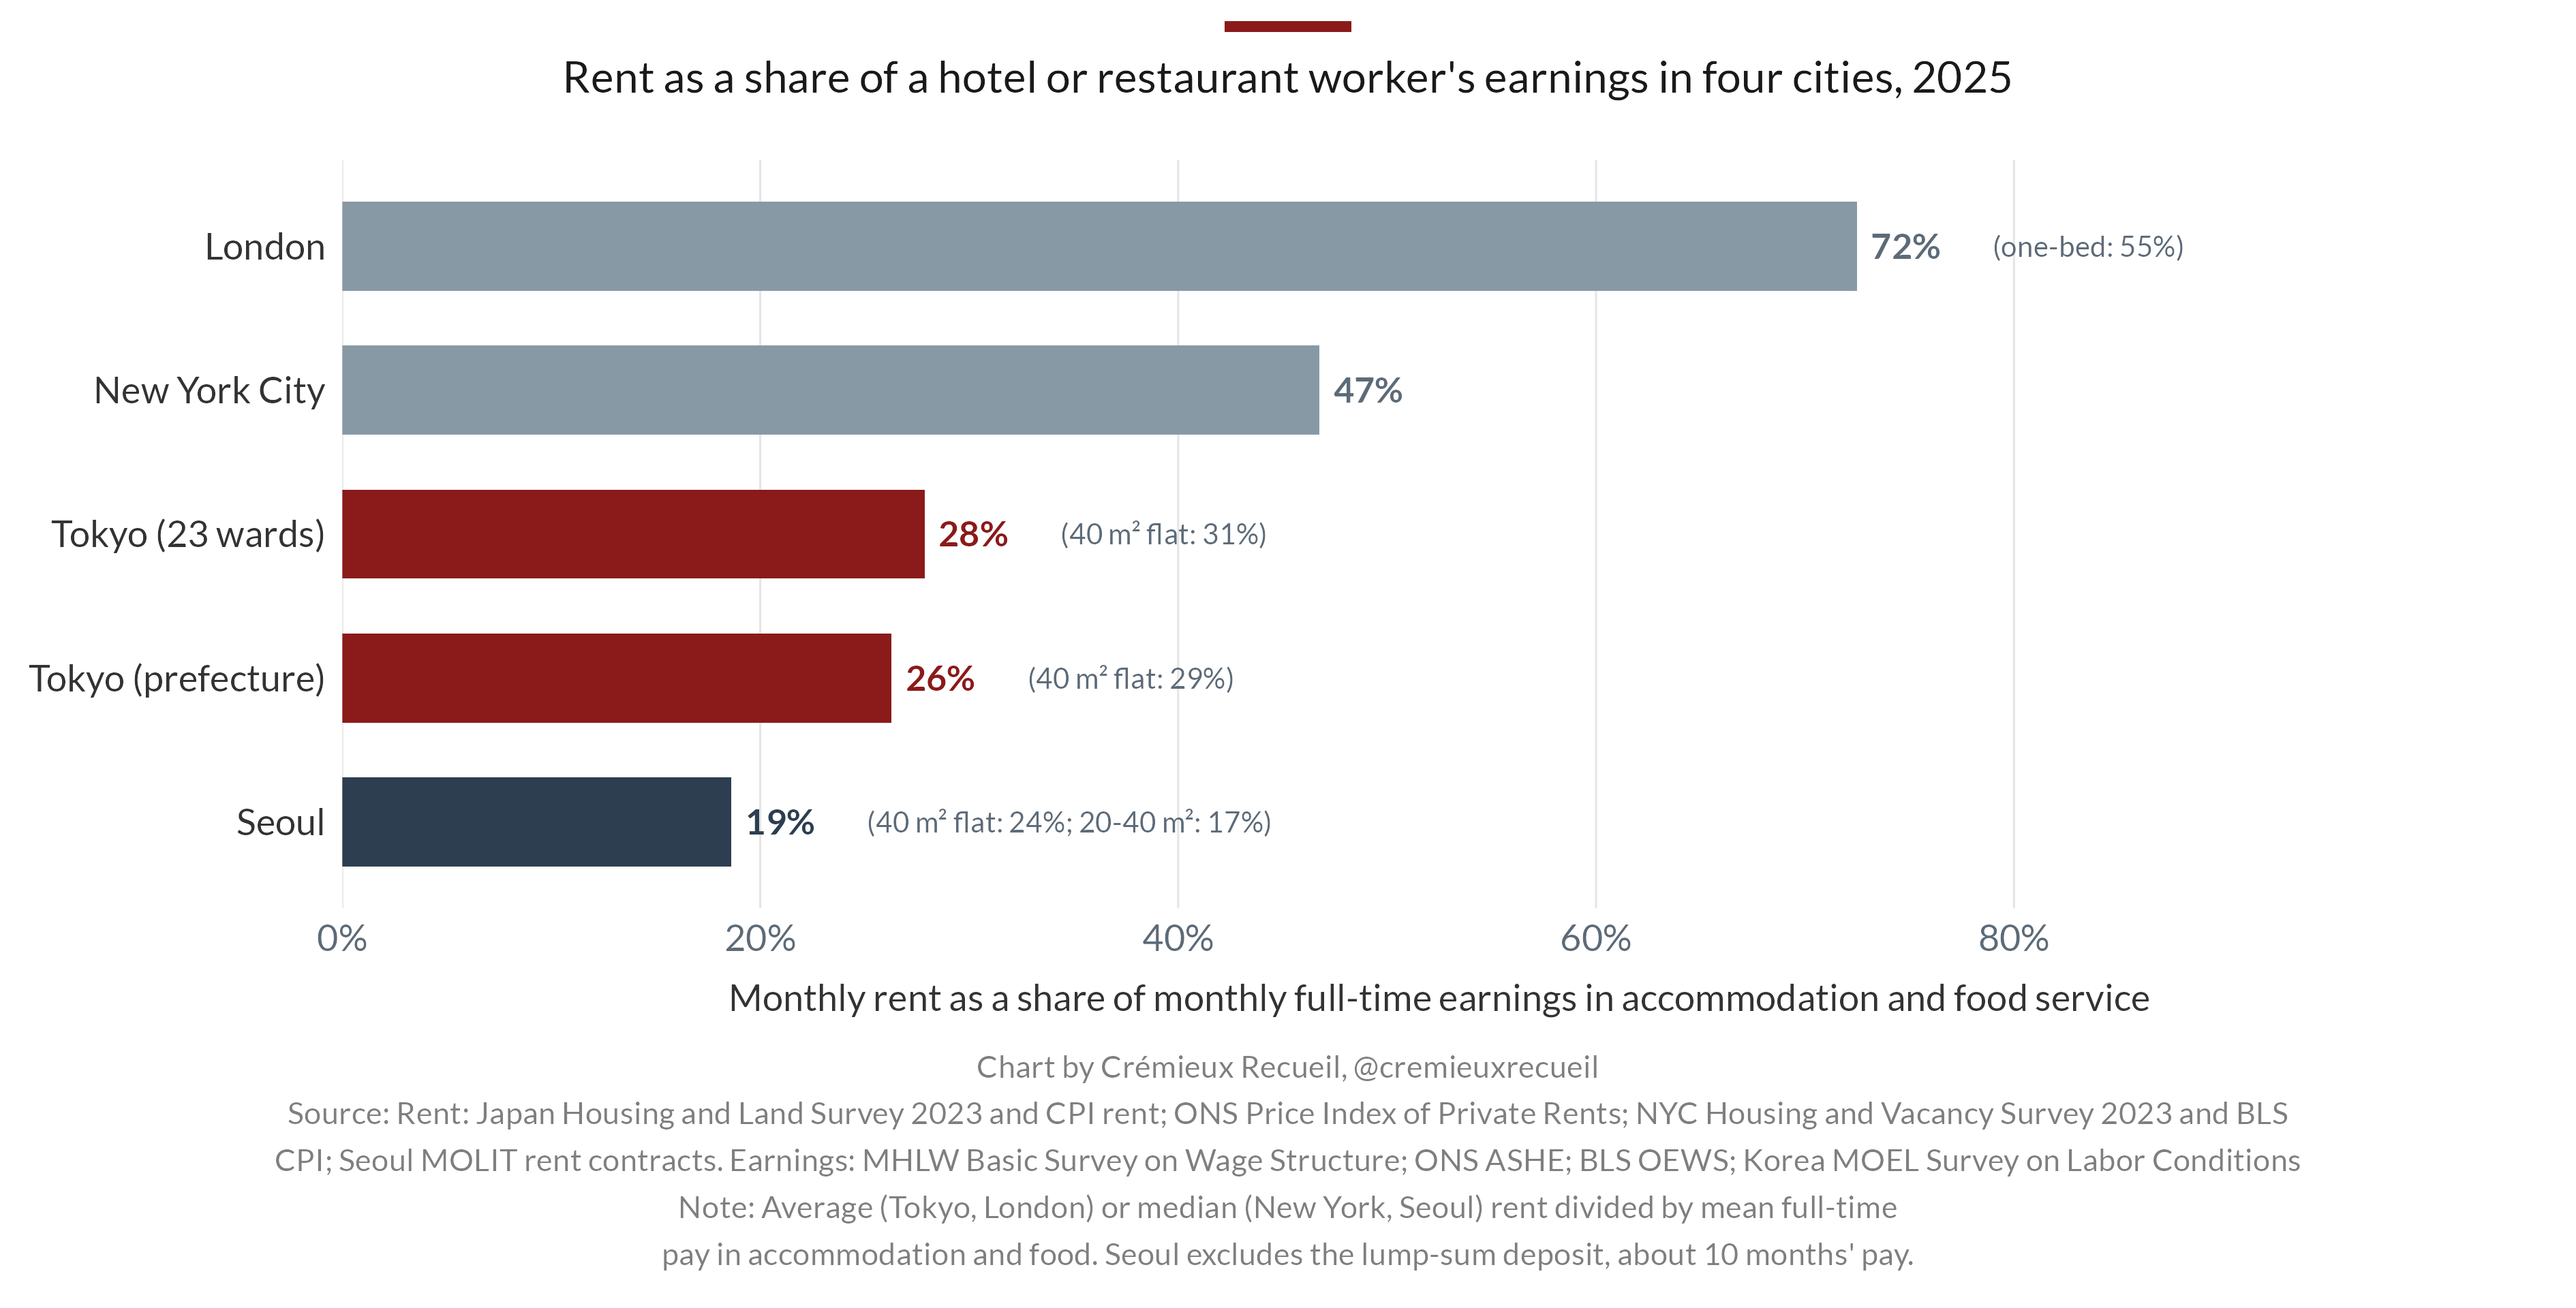
Full-time hotel and restaurant workers in Tokyo spend about 26% of their pay on rent against 47% in New York and a whopping 72% in London. On the London note, Britain really is Japan’s obvious counterfactual here. They’re both island nations that stopped getting richer, but unlike Japan, Britain stopped building. Both countries’ real wages stagnated by similar amounts after 2007 (Japan, 6%; Britain, 7%), but real rents in Japan are 17% below their 2000 levels, while in Britain, they’re above it.
Put It All Together
With all the pieces lined up and the parts explained, we can assemble our theory for one of the reasons people love Japan so much:
Japanese workers are among the world’s most skilled and the least used. More of them work in retail than anywhere else in the developed world, producing half of what American or German retail workers do on an hourly basis. Japan’s real wages, deflated by consumer prices, were 9% lower in 2025 than in 2000. Firms that can’t cover interest bills make up a seventh of the total number of firms in the country. And, as a result of all of this, visitors get to enjoy service whose quality nobody prices, at prices kept low by a weak yen, alongside cheap housing and incomes that have fallen behind the rest of the developed world.
That is the subsidy the Japanese pay to tourists. Tourists receive excellent service at low prices, and Japanese workers pay for it with their wages. For now.
A message from my sponsor, Mechanize:
We’re hiring software engineers to build environments and evals that frontier AI labs use to train coding agents.
To get a better sense of the work we do, you can check out GBA Eval, where we had models build Game Boy Advance emulators from scratch and scored their performance.
Base pay starts at $300K/year for junior software engineers, with more for senior roles, plus equity and performance bonuses. Apply here.
Subscriber Content: Does This Explain Japan’s Fertility?
Given the way people talk about Japan, you might think they have the world’s lowest fertility. But, in fact, they now have the highest fertility in East Asia.
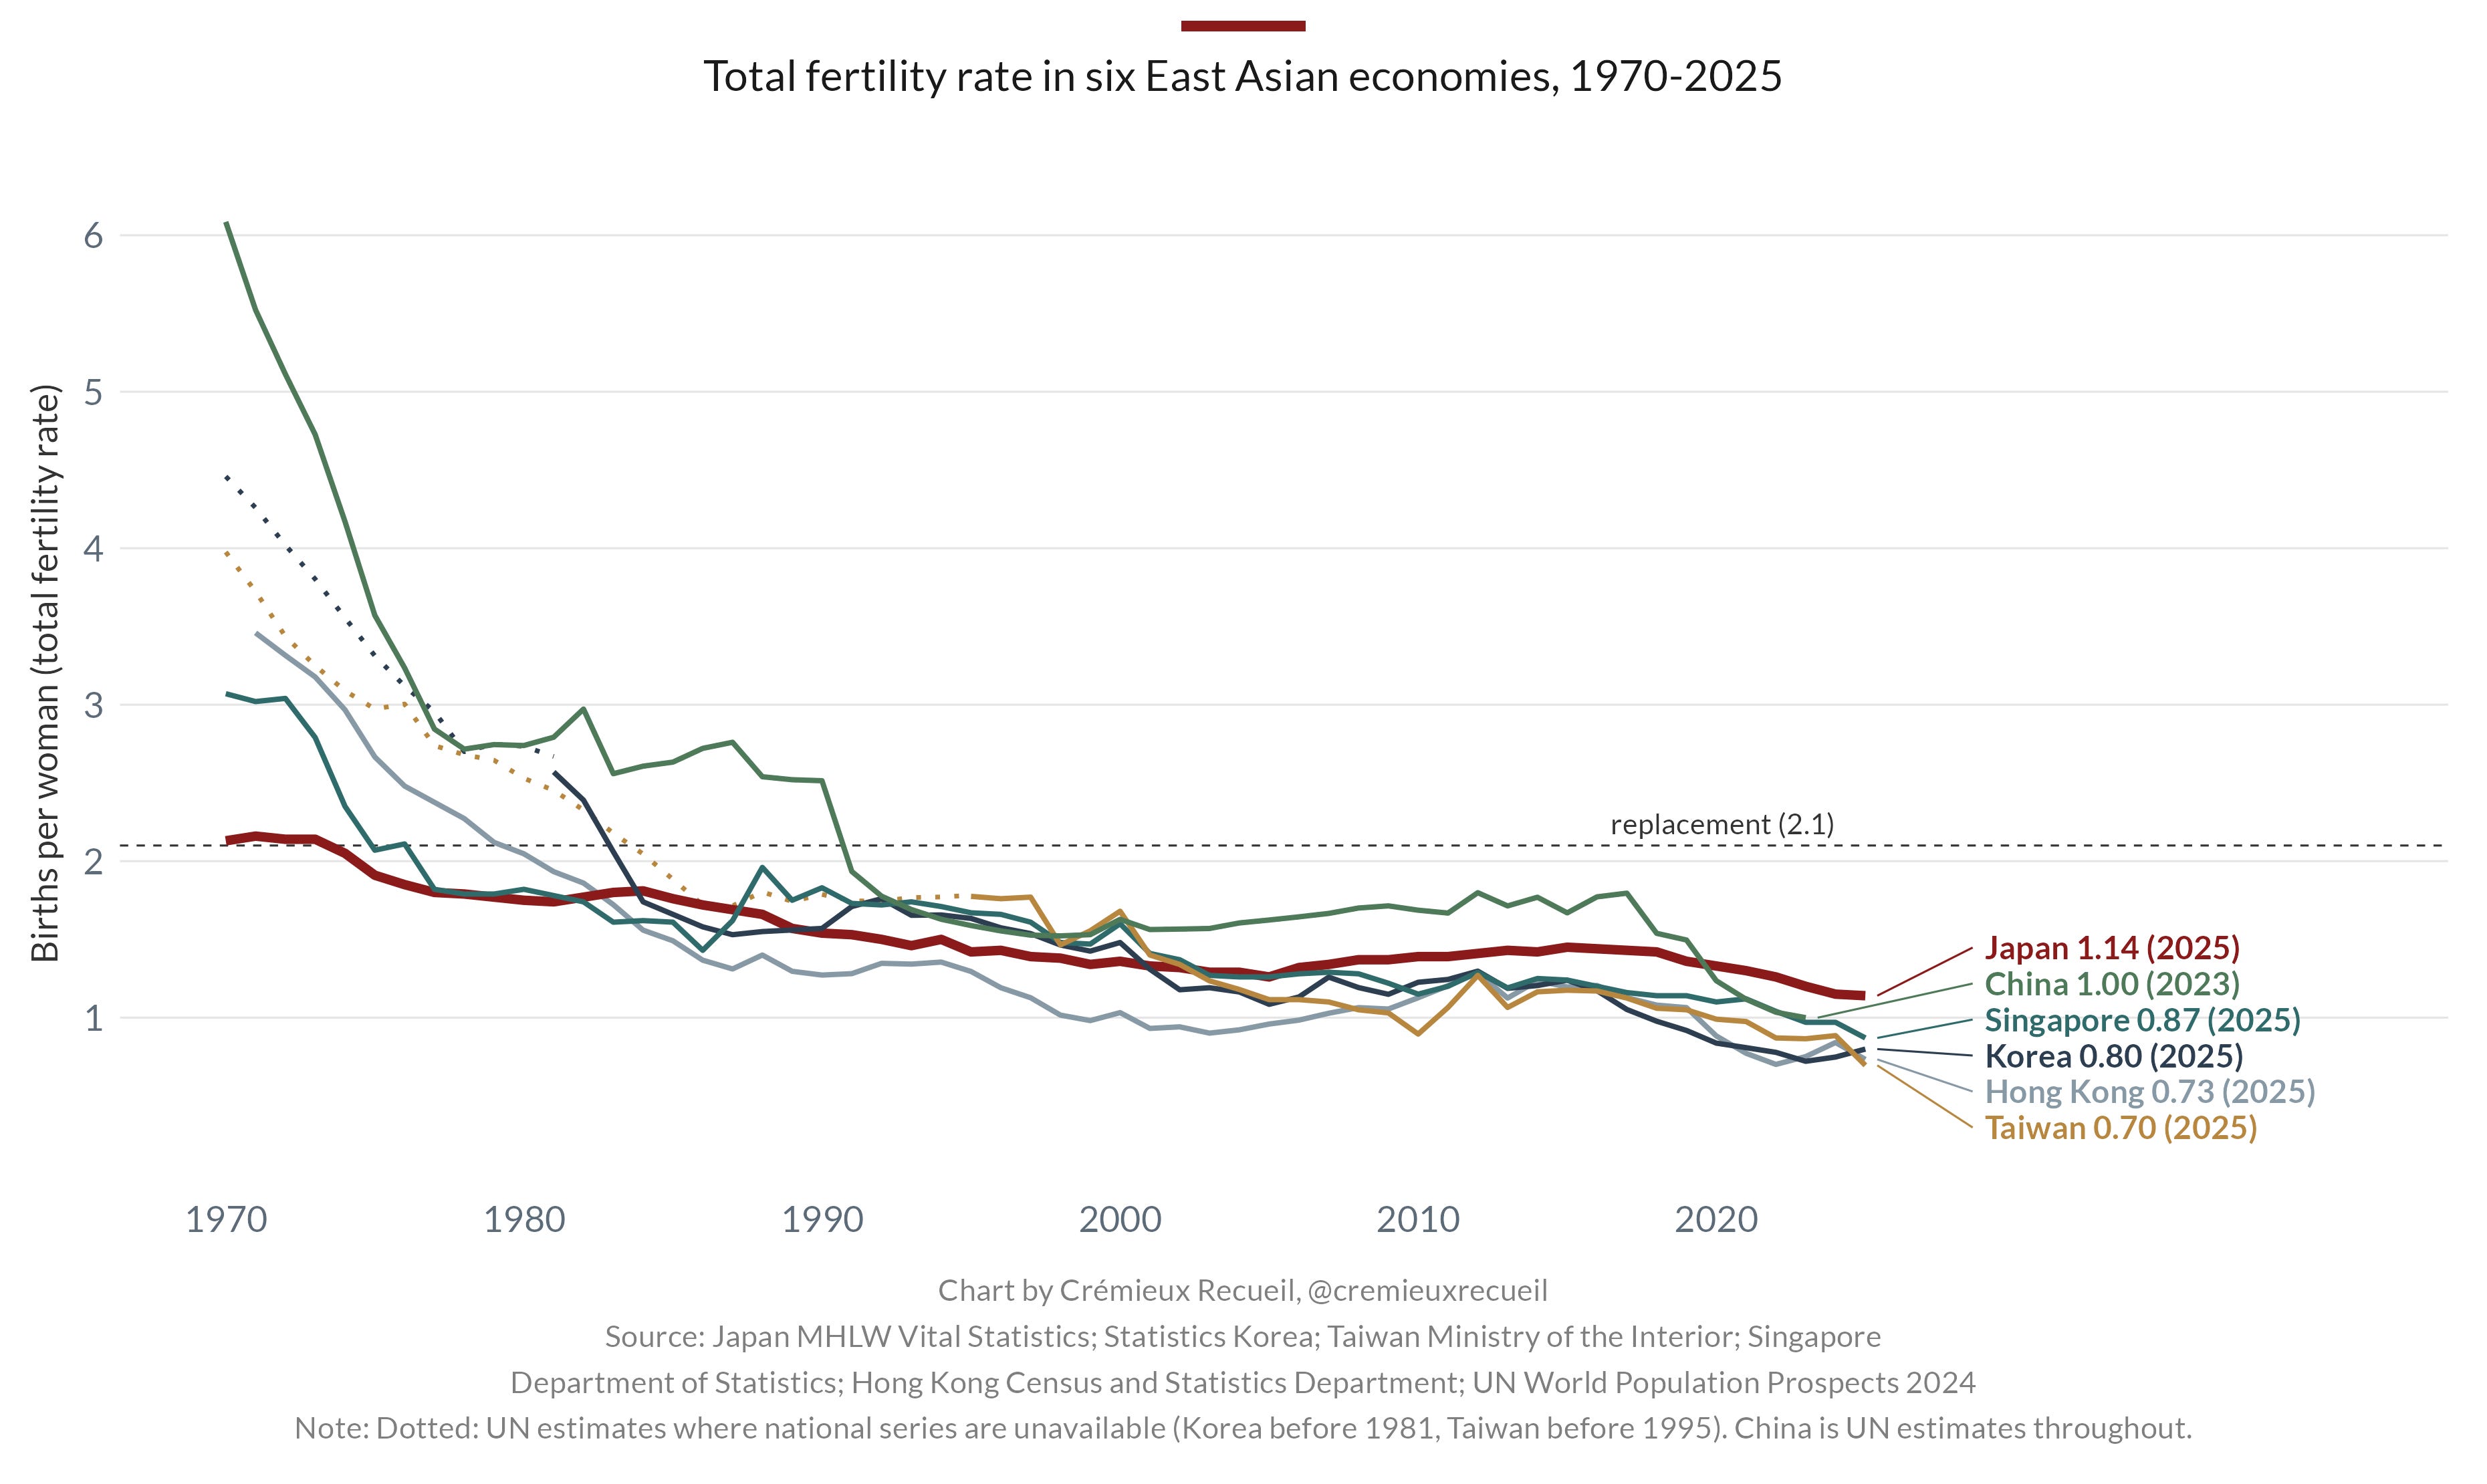
Nevertheless, by world standards, Japanese fertility is still very low. Might that be explained by the things that lead to Japan’s tourist subsidy? Let’s look.
