
When Did Poor People Get Fat?
Are poor people fat because of the welfare state? Probably not

This was a timed post. The way these work is that if it takes me more than an hour to complete the post, an applet that I made deletes everything I’ve written so far and I abandon the post. You can find my previous timed post here.
There’s a widespread belief online that, around the creation of modern welfare states, wealthier people went from being fatter than poor people to being skinnier. There has been inversion, but it doesn’t seem timed with the advent of welfare states. More likely, it’s tied to national development and when countries become sufficiently rich, the poor become fatter even without welfare states. There’s a clear case for this belief.
First, as countries get richer, they tend to get fatter.1
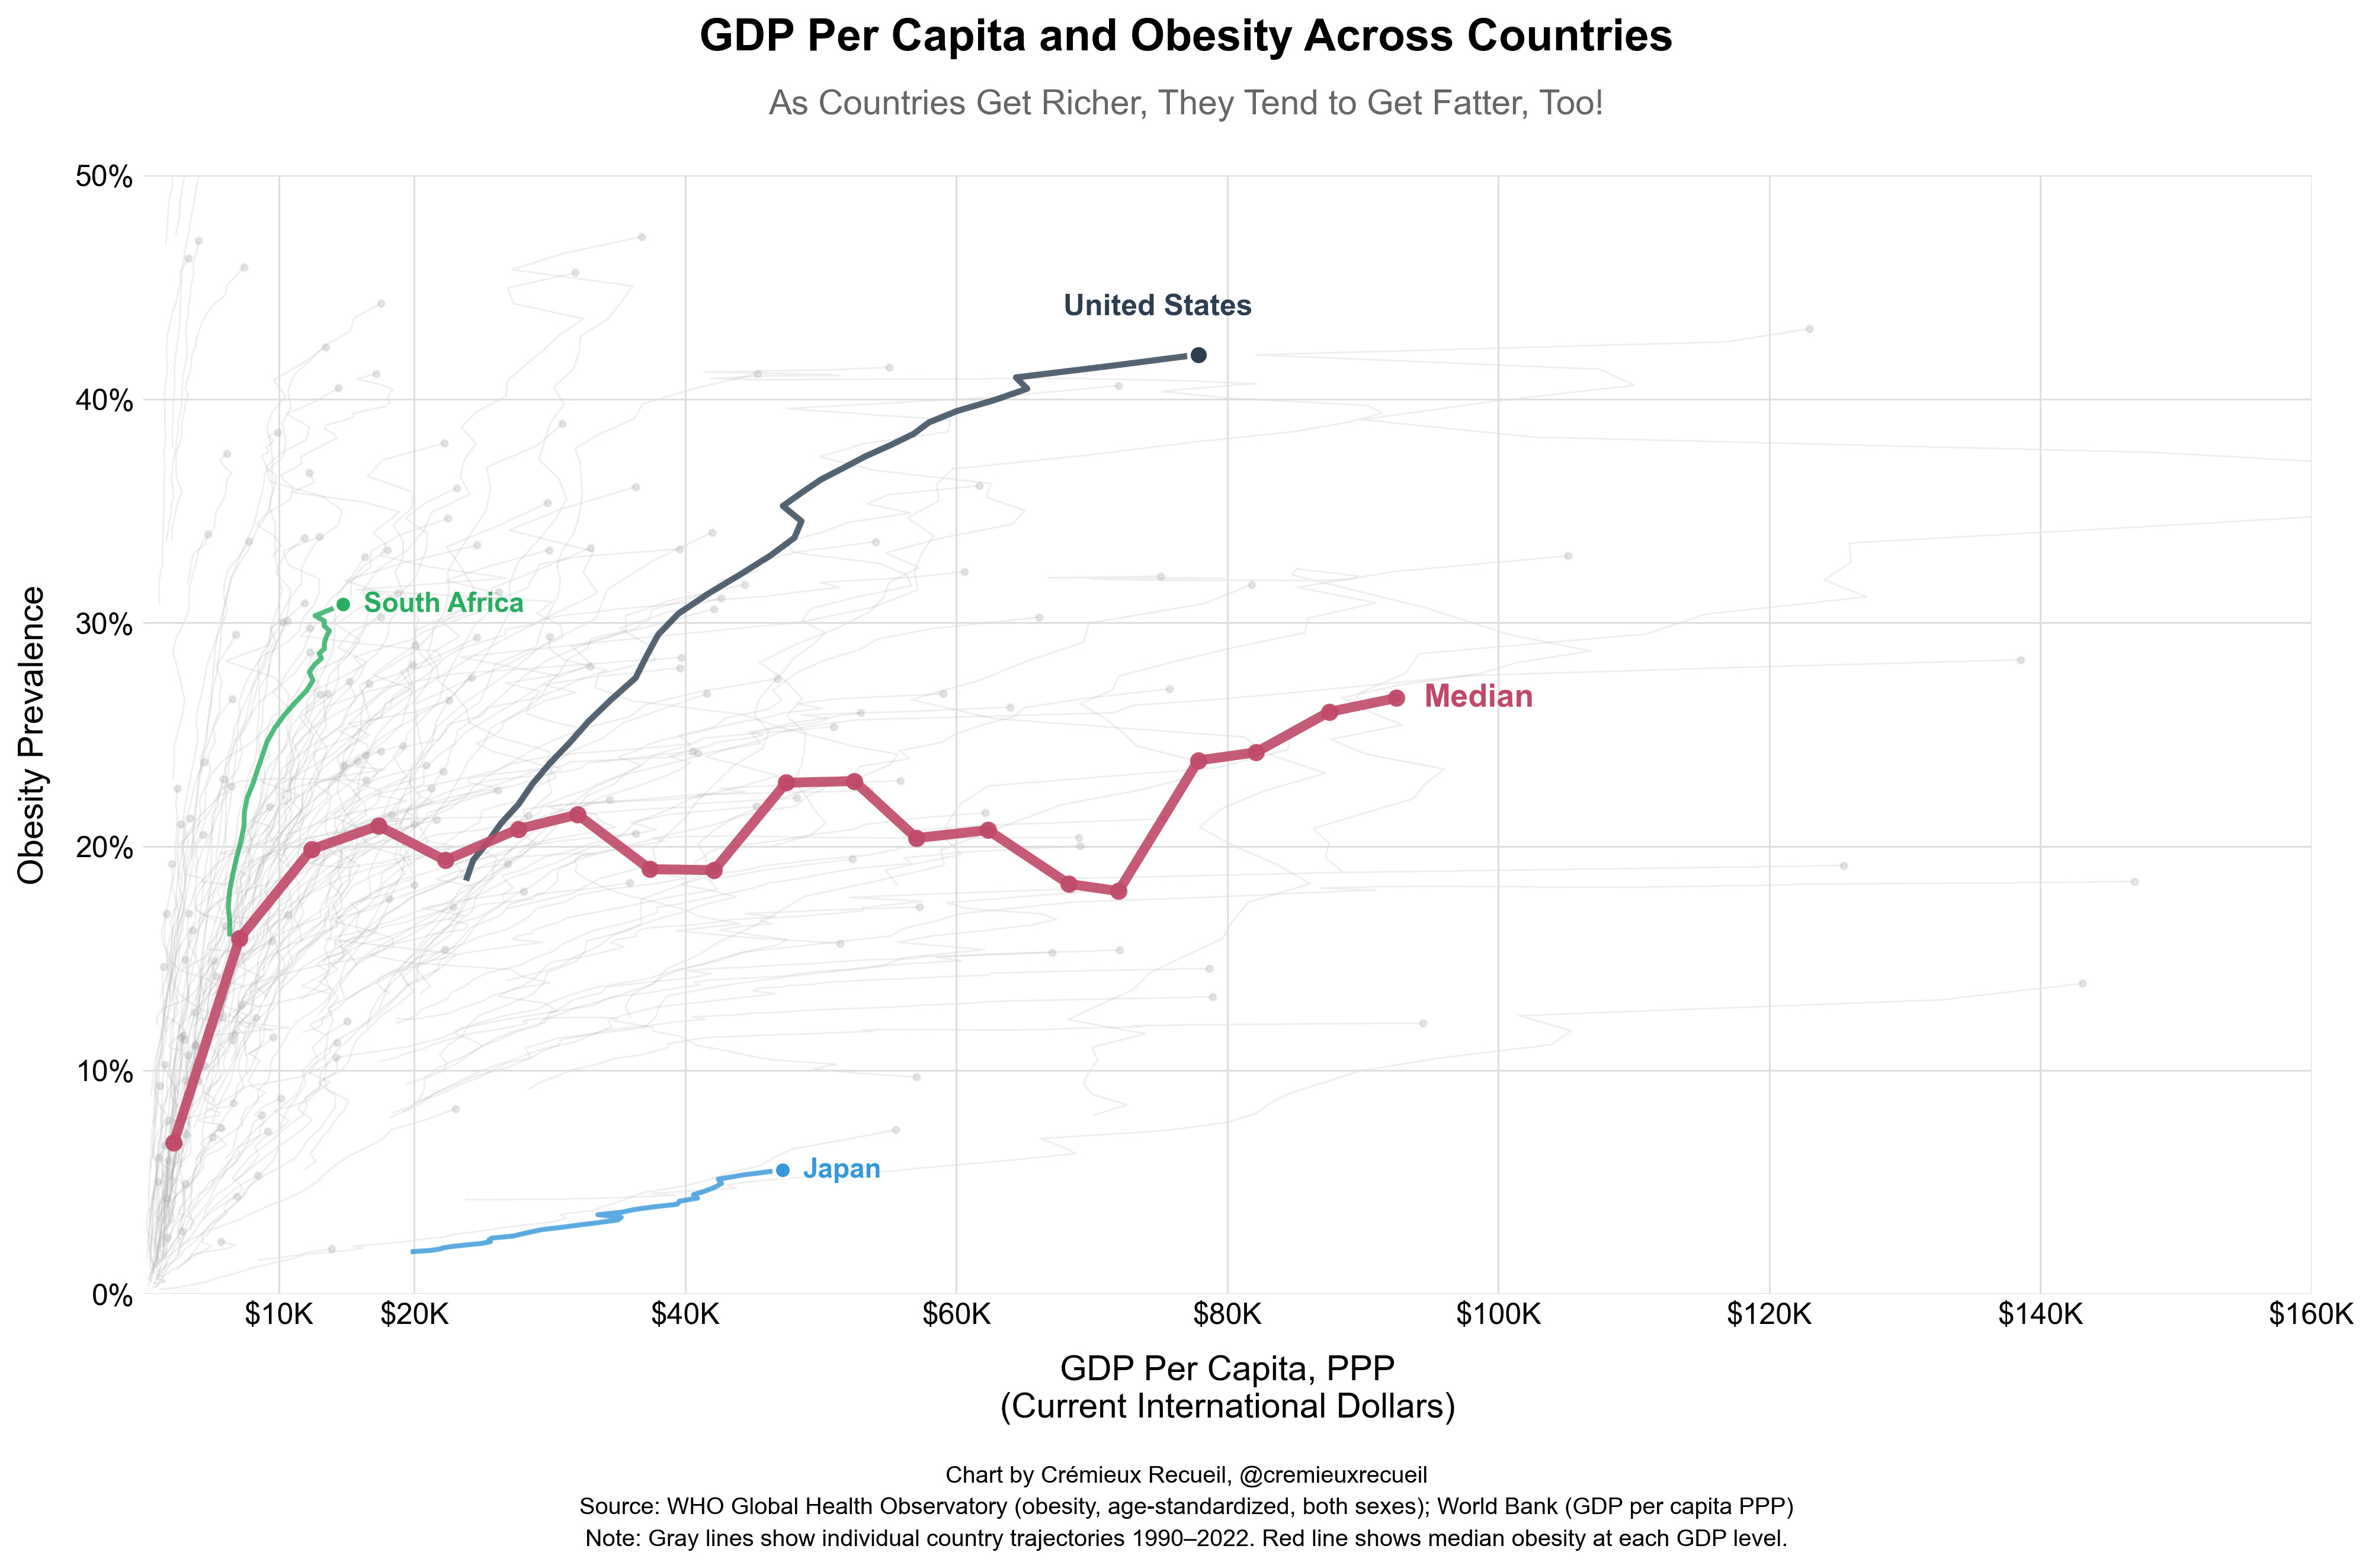
Second, we can see that, in the countries with good data, the poor become fatter than the rich before welfare states in some cases, and before welfare states become significant in some of the rest.
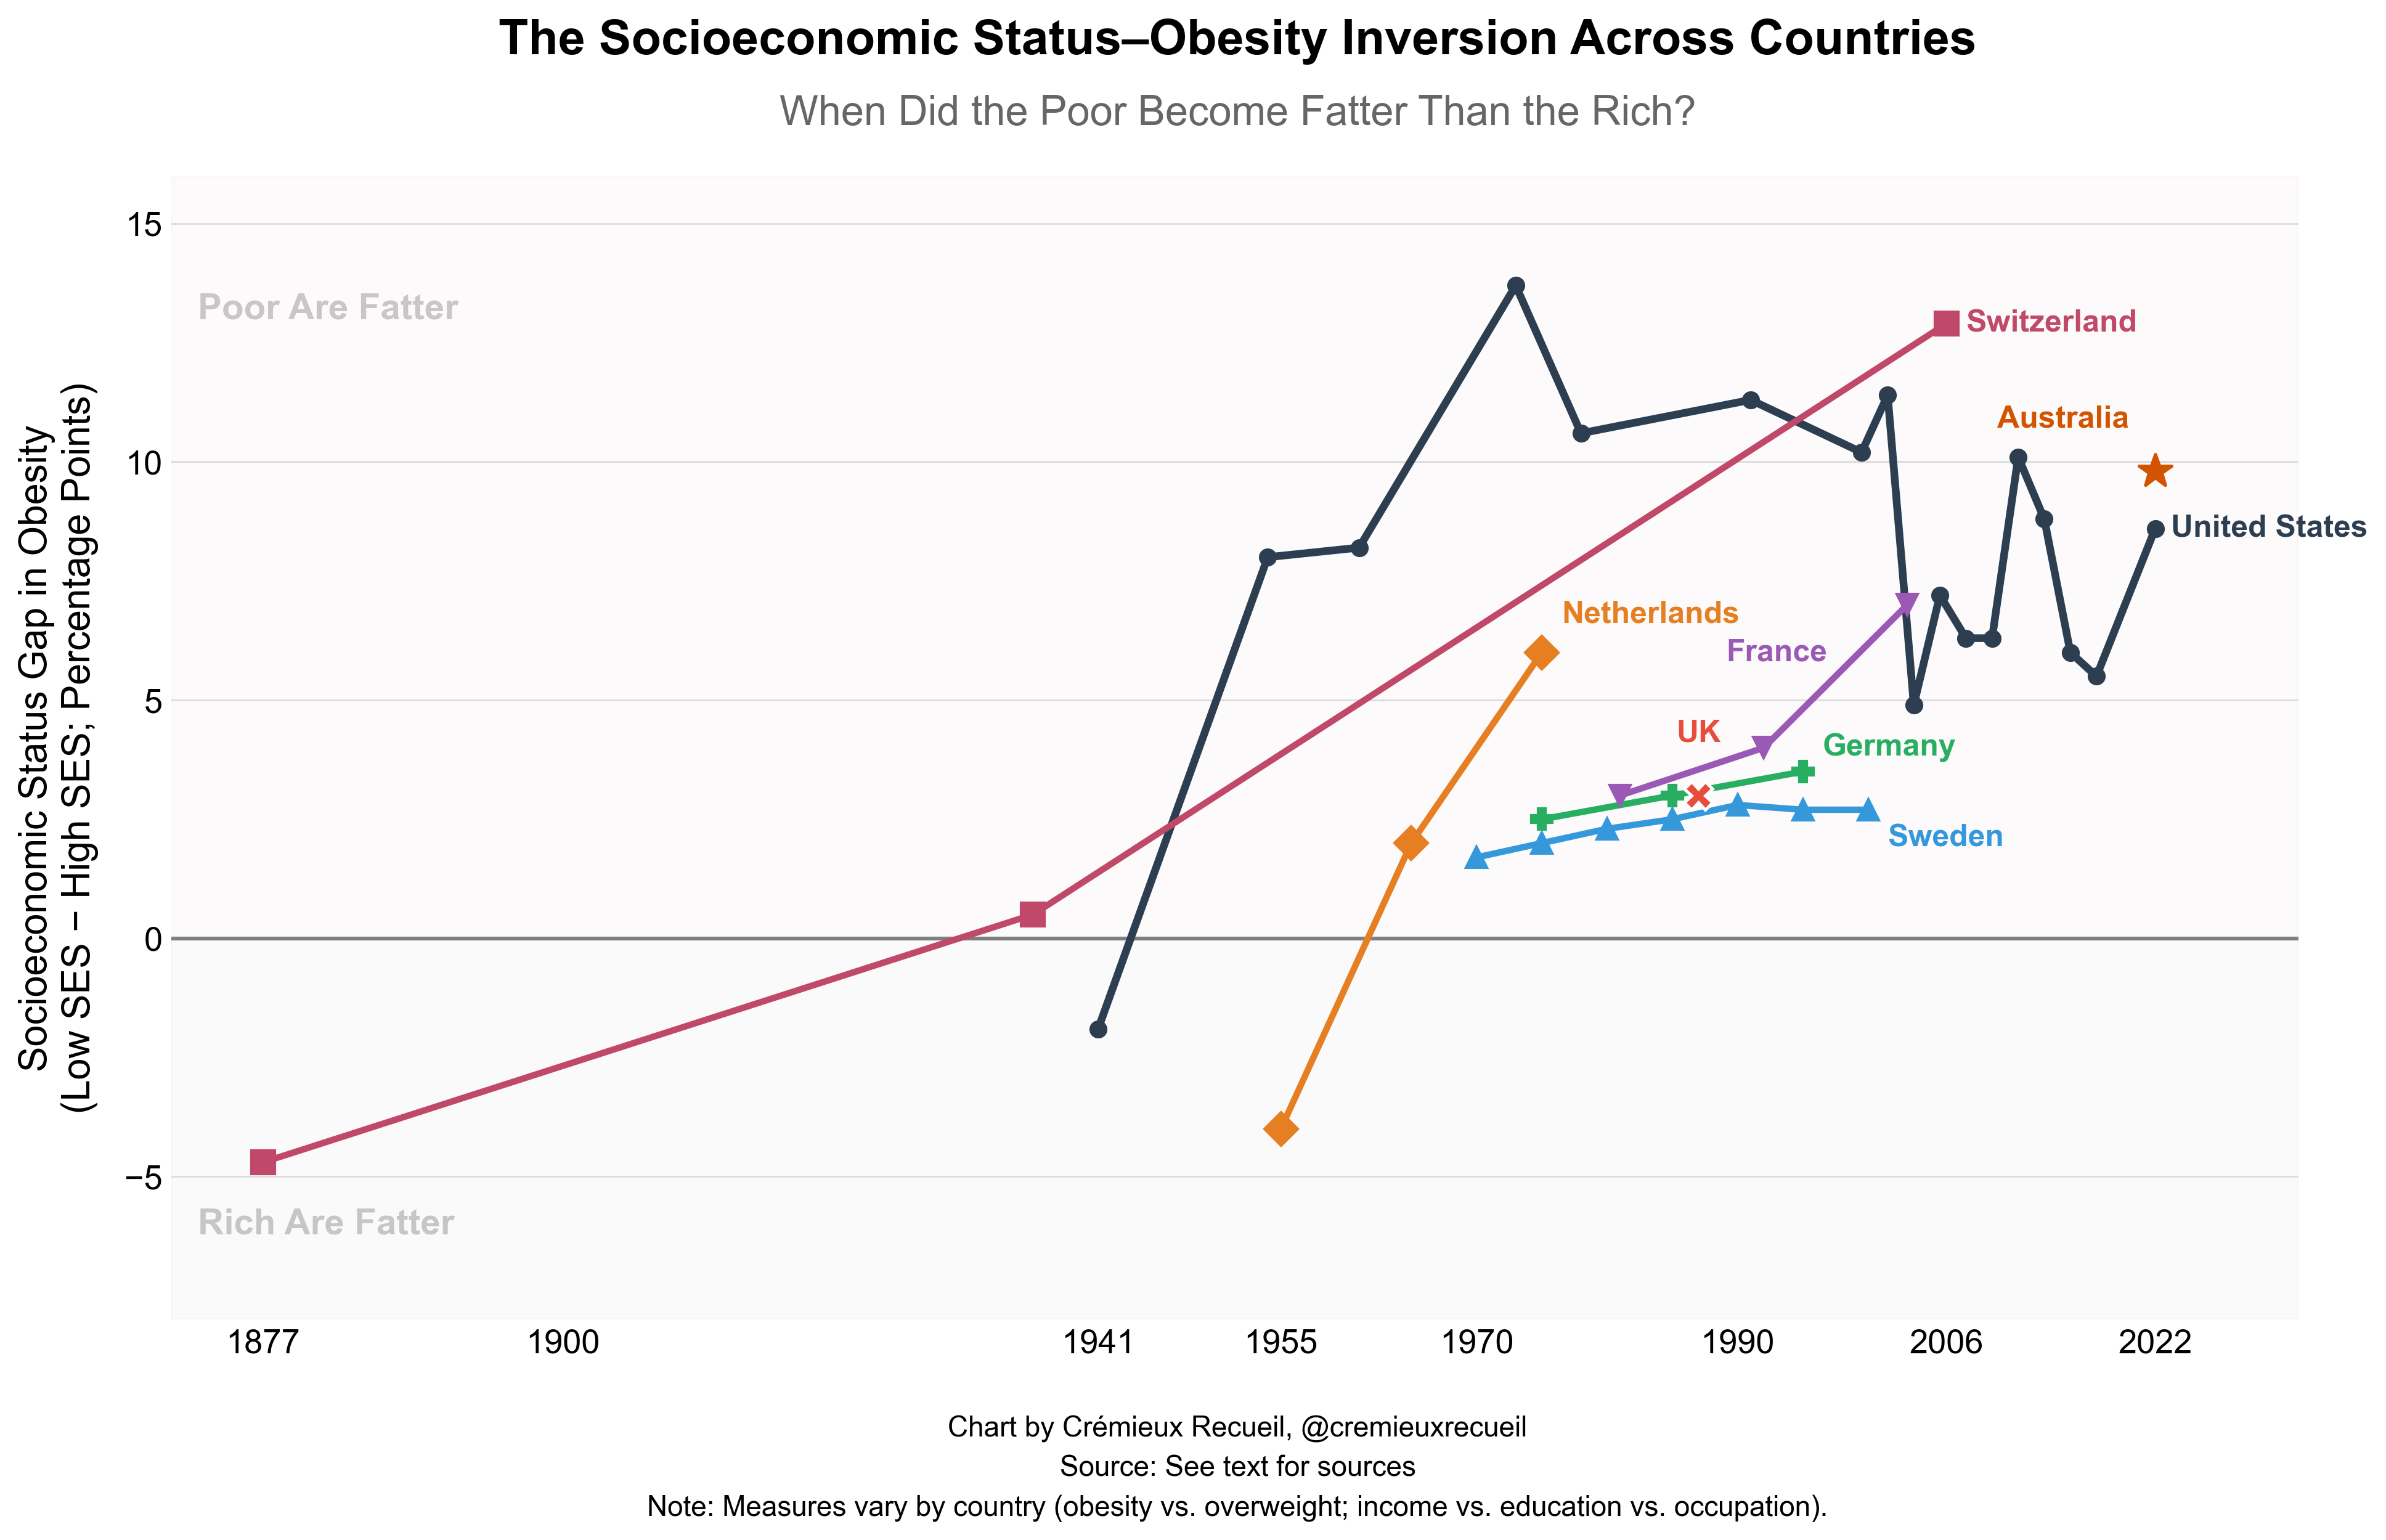
Third, in the United States, we have excellent data on this based on nationally-representative cohorts from 1961 onwards. In that time period, the low-income versus high-income obesity delta has been fairly constant, contrary to the prediction one might make if continuous exposure to welfare states drove poor people to become fat.2
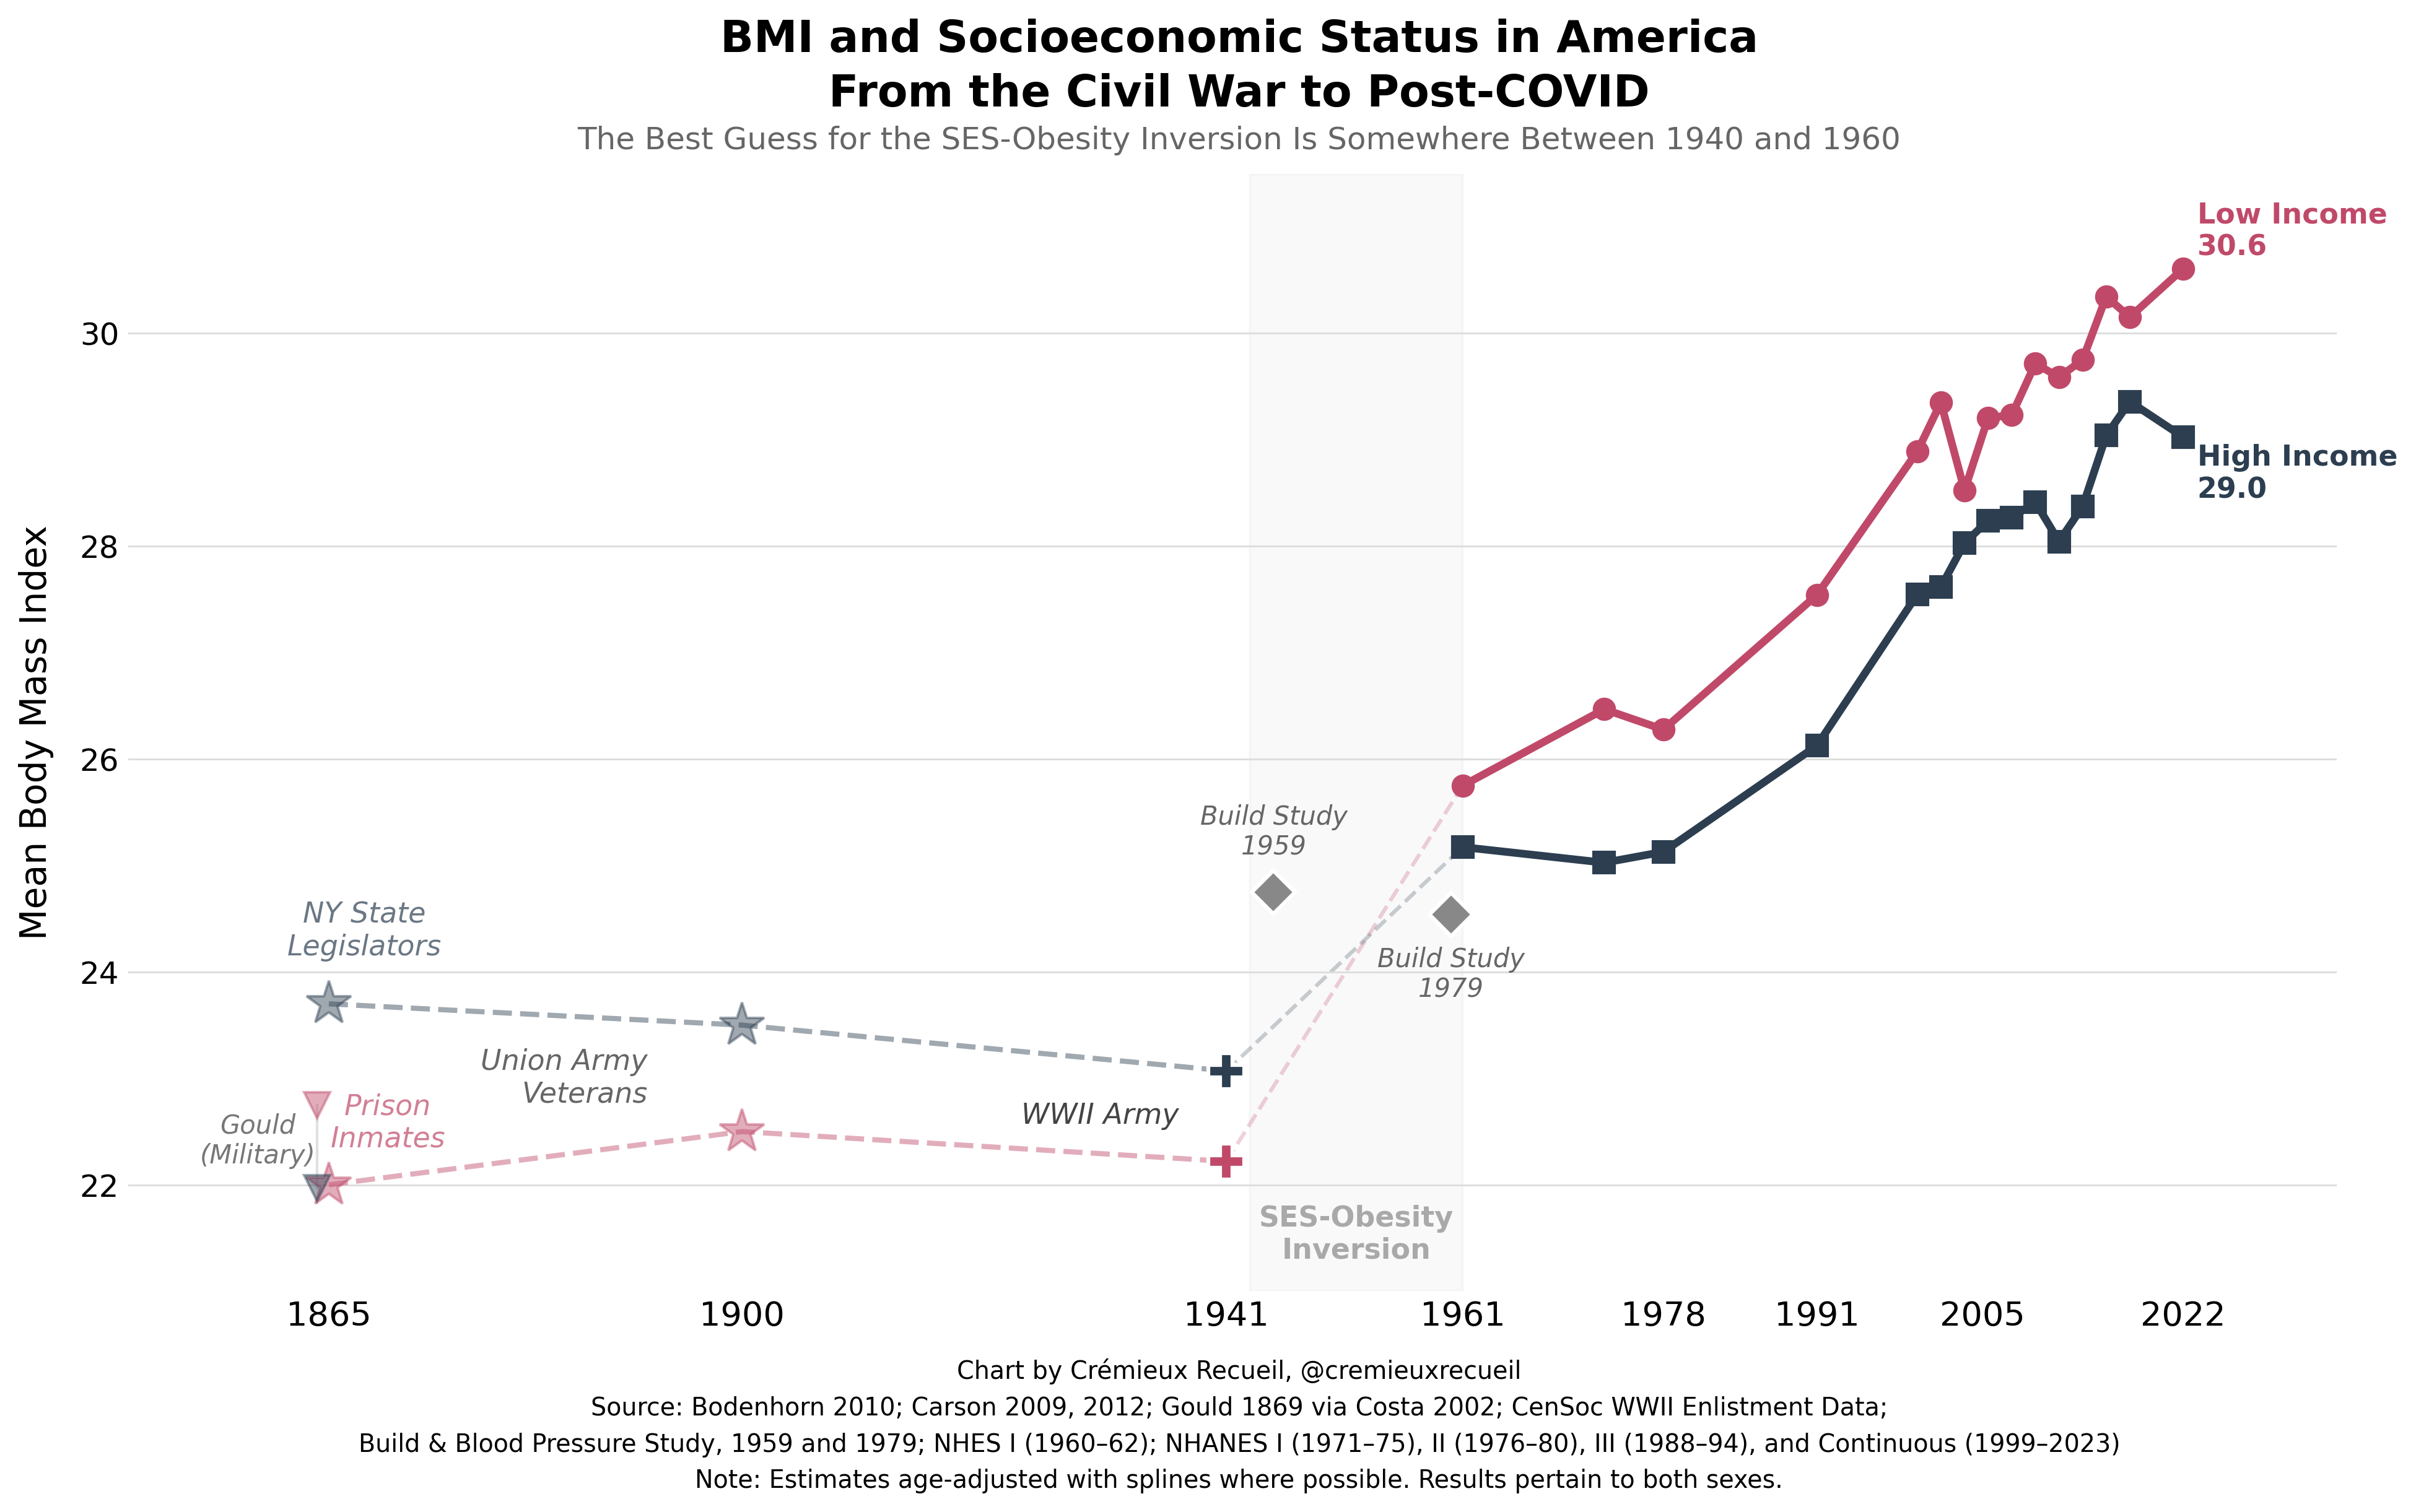
Before the era of representative cohort studies, there are various data points like estimates at the time of the draft for WWII, or estimates from Union Army veterans decades after the Civil War, and if we want to go even less population-representative, we can look at a comparison of legislators from New York and prisoners, and in that whole period, we see that the high-income are fatter than the low-income.3
In modern America, what does this relationship even look like? It’s actually not quite ‘poor people are fat.’ In fact, this shows up overall and it has since the Midtown Manhattan study in 1954, but it only does so consistently in women. It did in men for a few decades, but nowadays, poor and rich men have similar obesity rates!
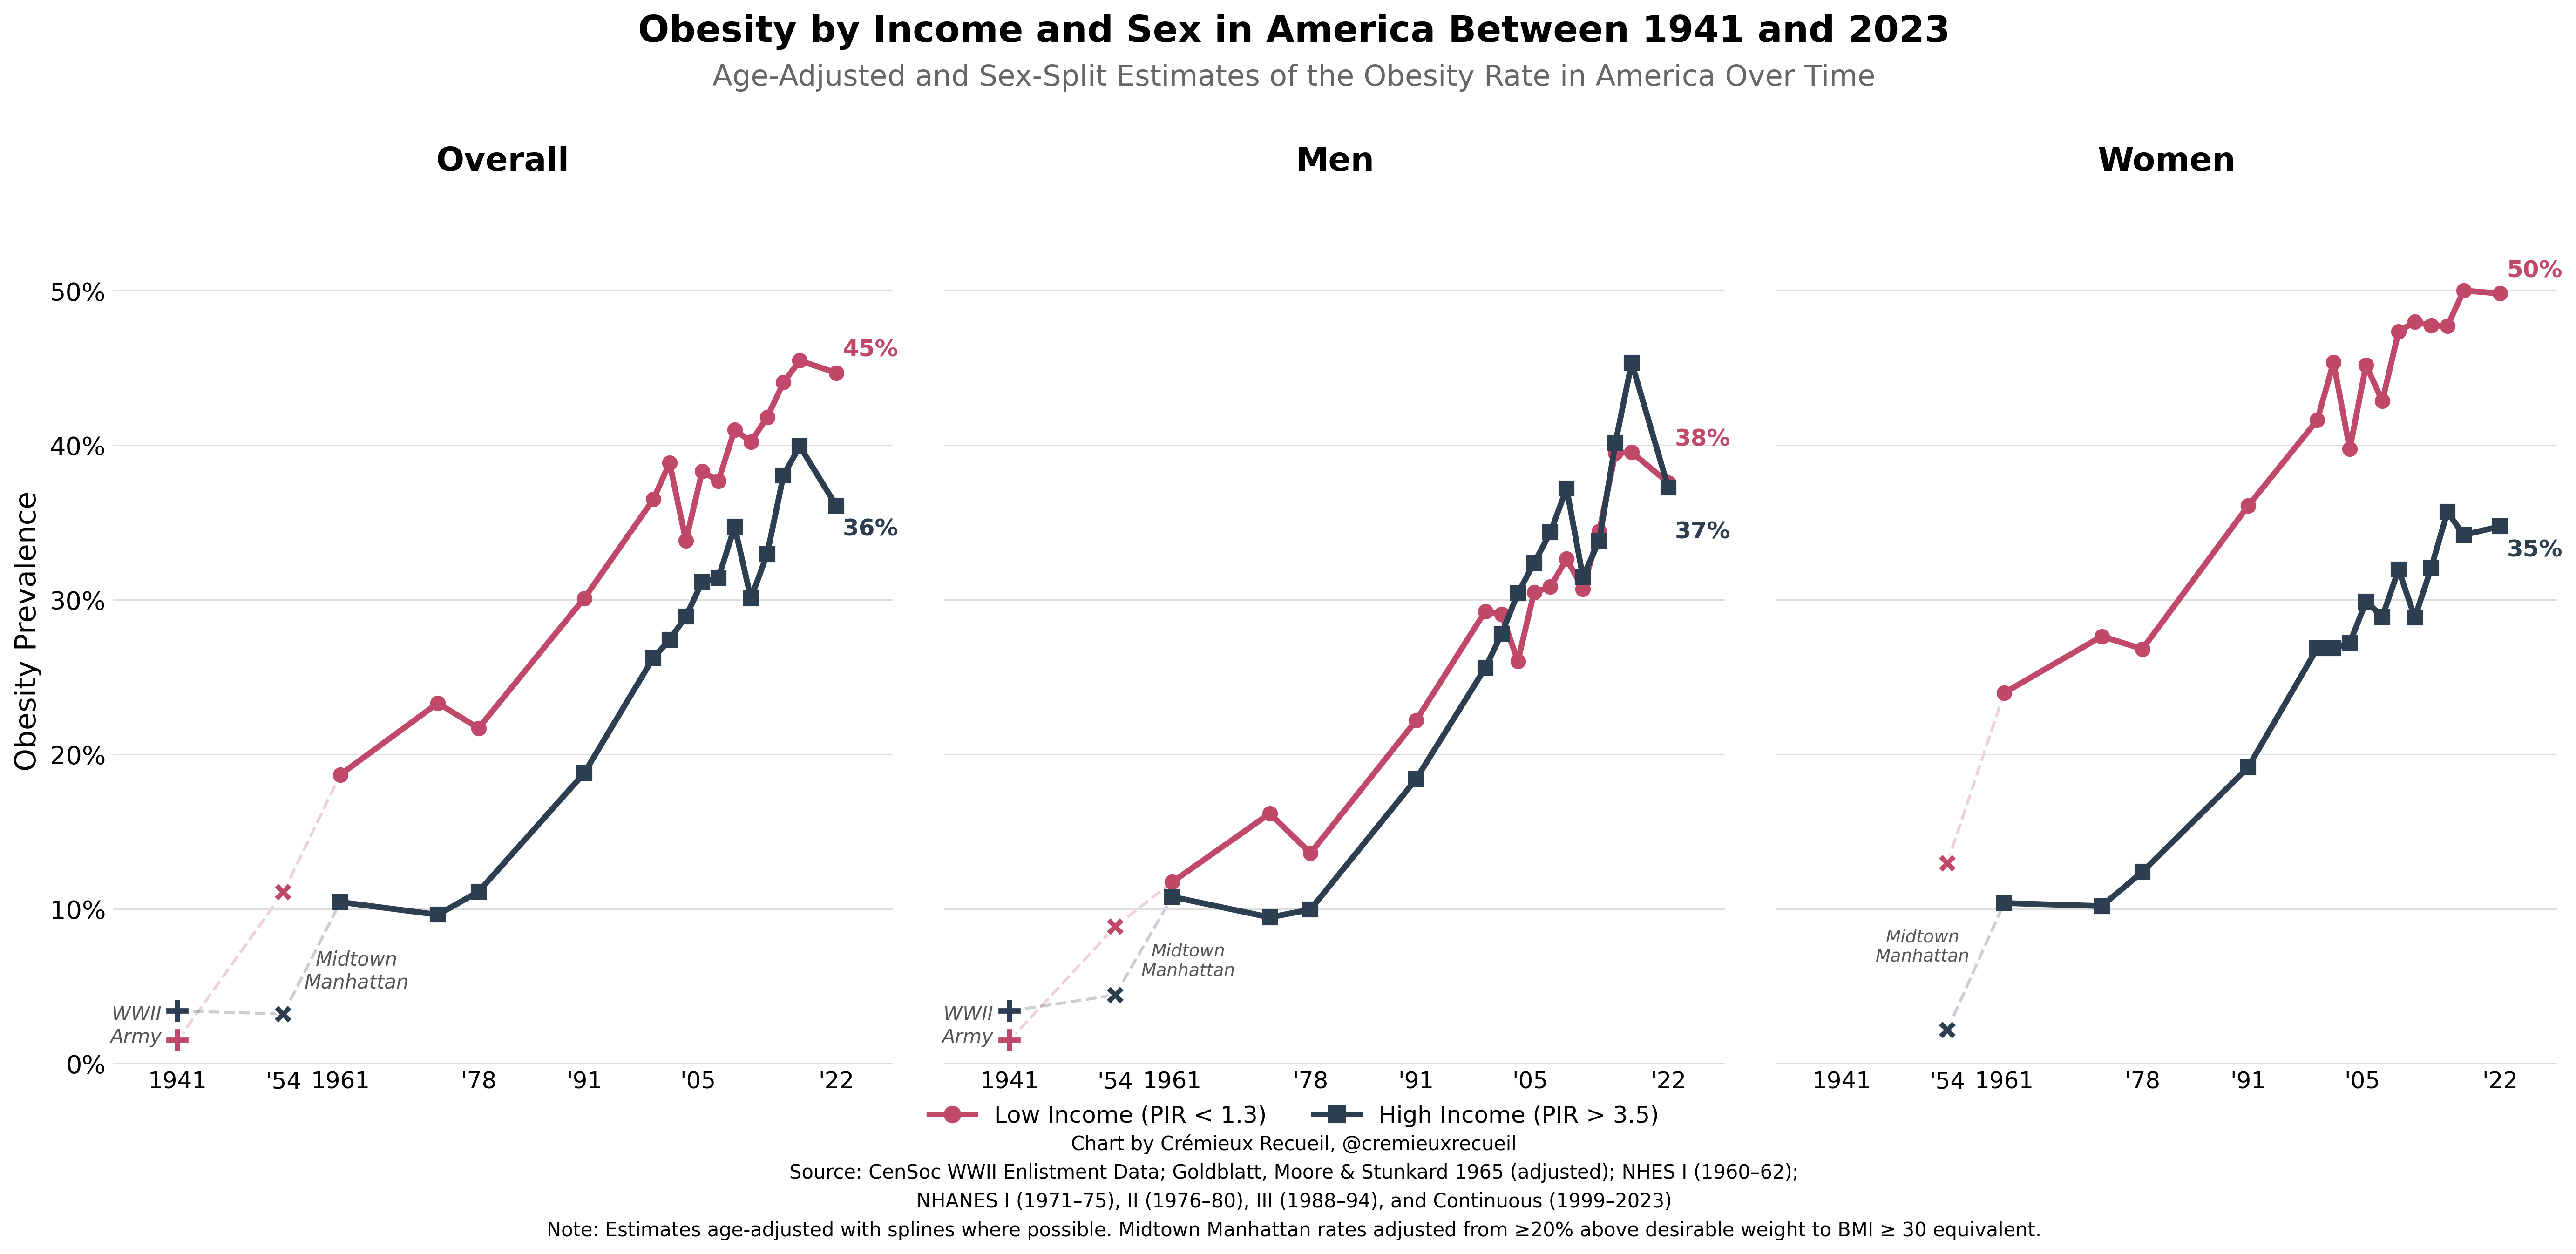
One question is whether this is just due to a race confound, where Blacks and Hispanics tend towards both higher obesity rates and lower being poorer. If you read the above chart carefully, you’ll realize this can’t be the case in general, and could only be the case within a given sex, and it is! Take a look:
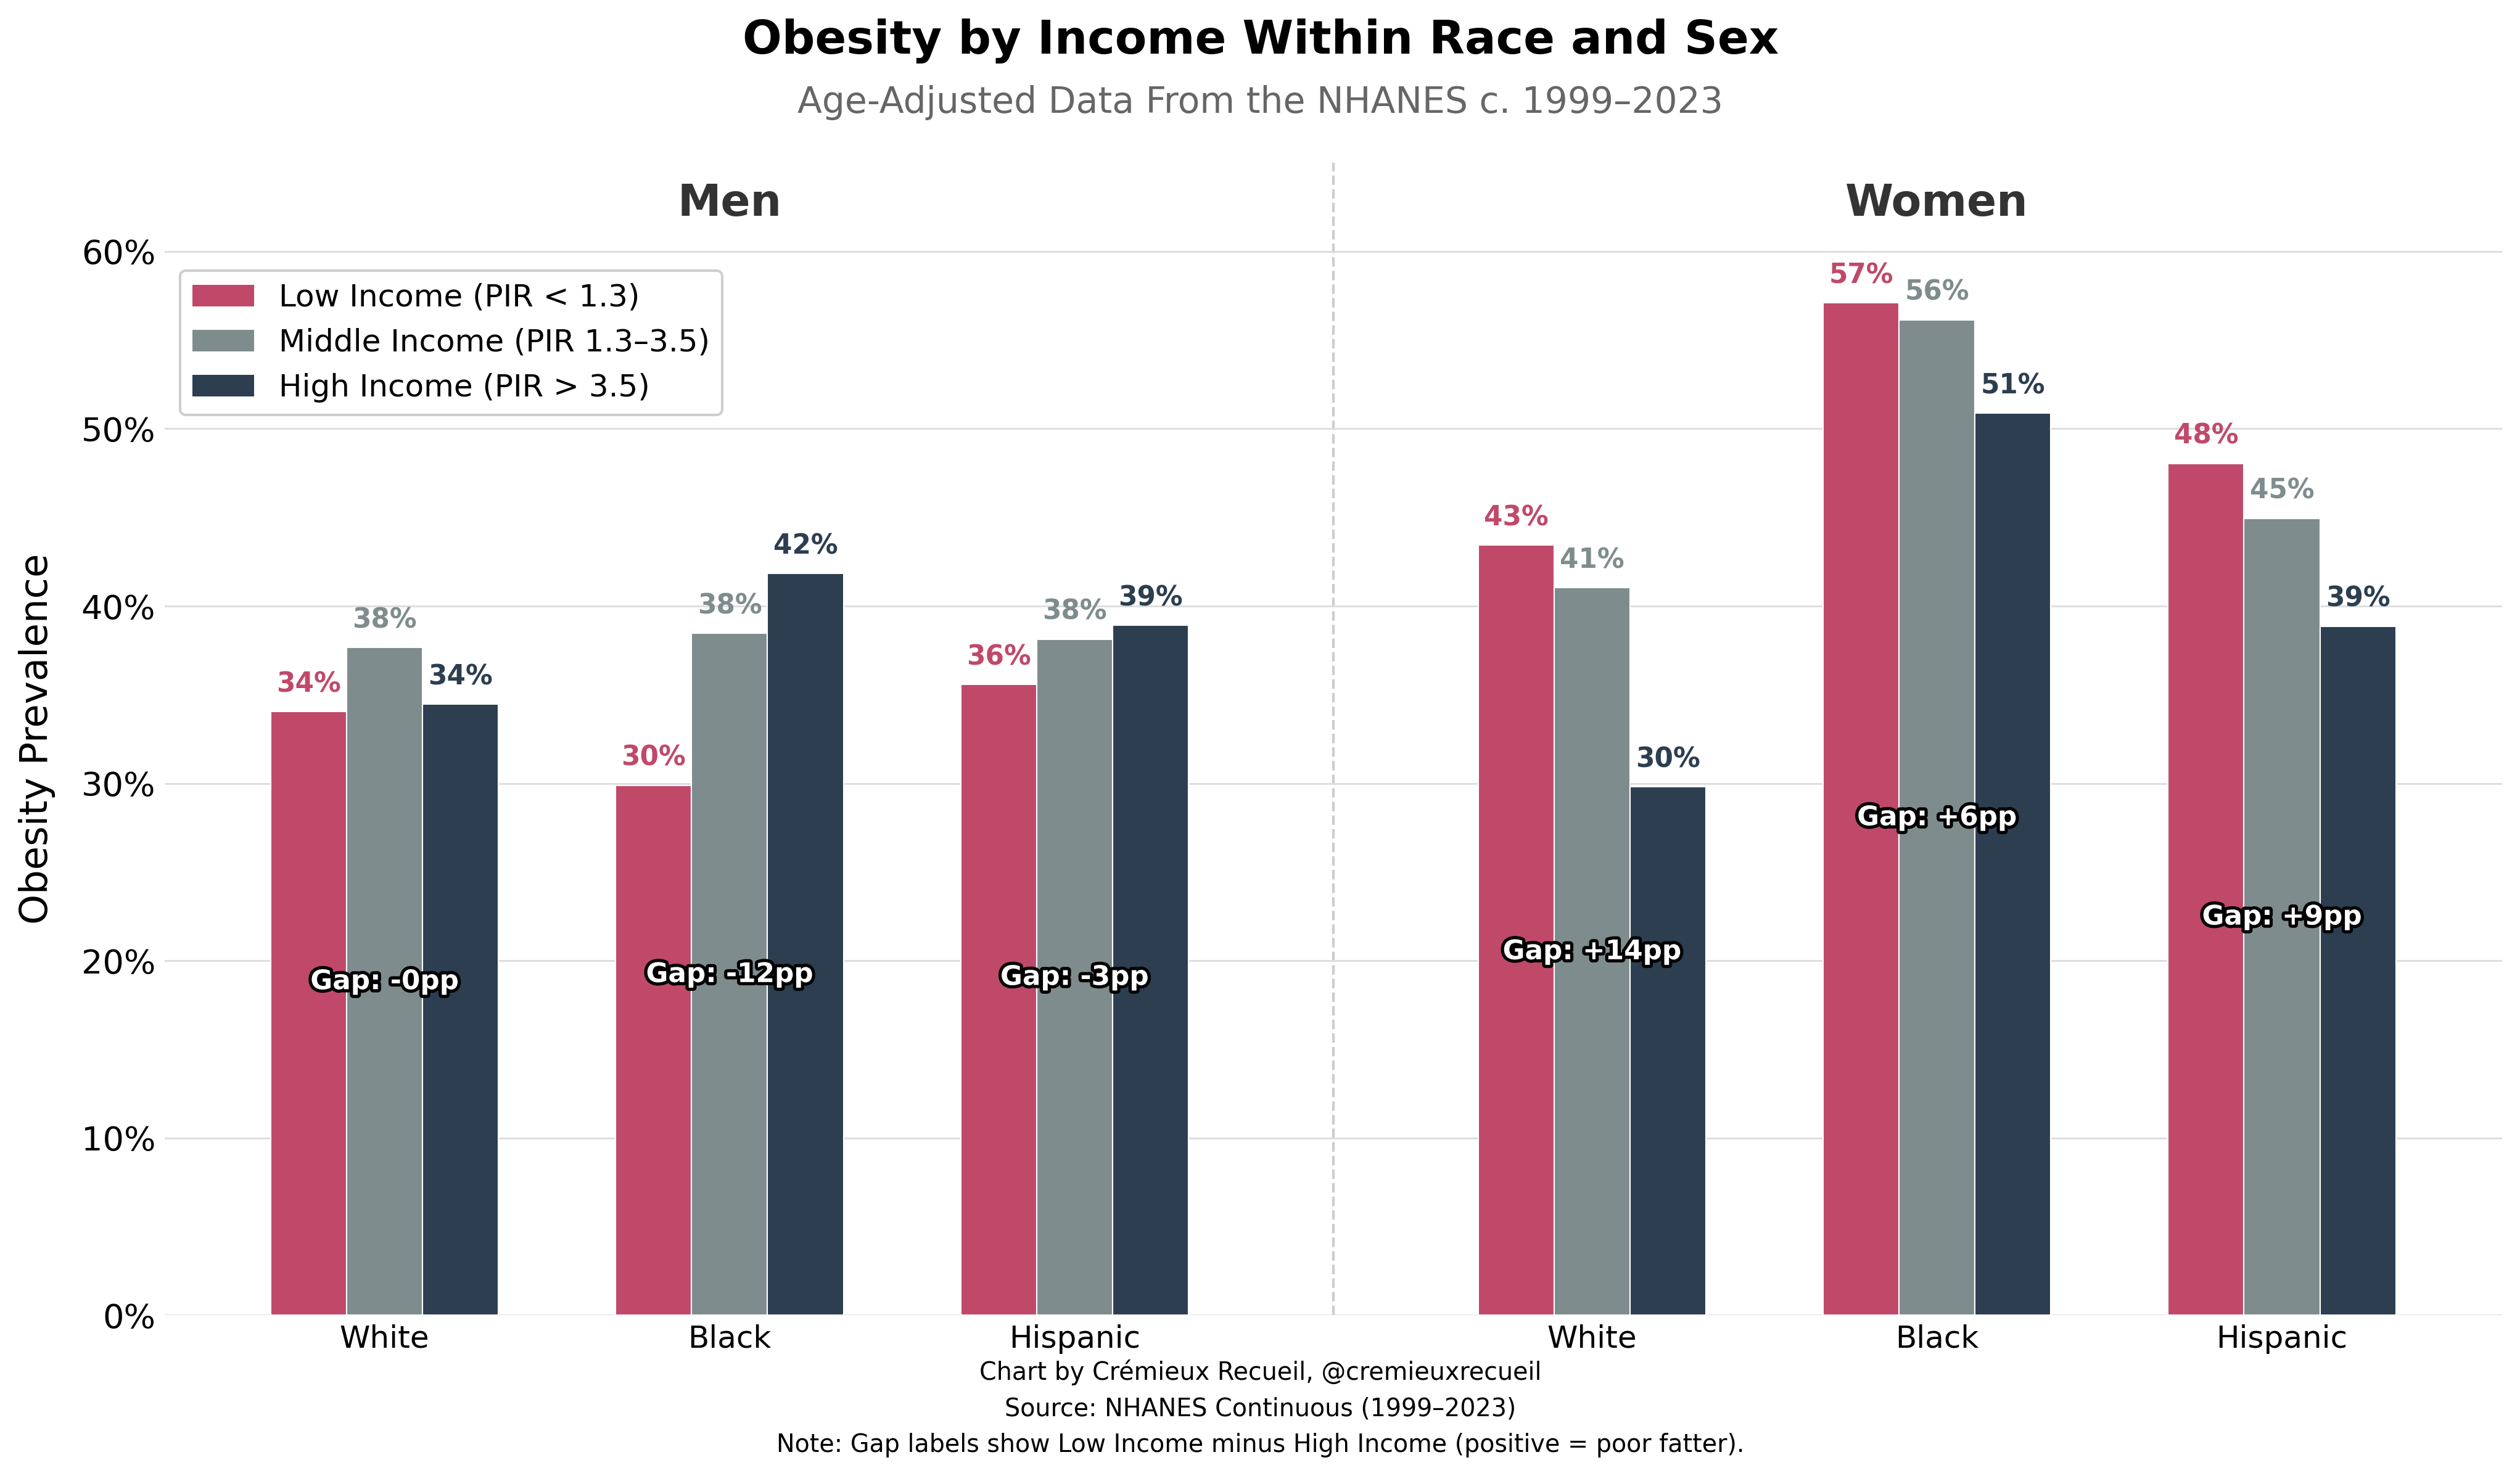
Among men, middle-class Whites are fattest, and both poor and rich are similarly fat. Among Blacks, the gradient is strongly reversed from expectations, and among Hispanics, it’s more moderately reversed. Among women, however, being skinny is status-associated, and this relationship is strong within each racial group, so the overall result where poor people seem to be fat is basically just driven by women.
I’ve gotten this question a lot: How can this be? How can countries get fatter with growing national wealth, when wealthier people tend to be skinnier?
There’s a simple answer: Individual and ecological correlations have different causes!
At the level of countries, national wealth enables more people to get fat if they want to. Your wealth is more determined by national wealth than by anything you can do on your own. At the individual level, people who have good personal habits tend to go further and earn more in life, and overlapping habits help people to avoid undesirable obesity, which is also something that makes it harder to get rich in its own right.4
The studies I referenced or consulted were Bodenhorn (2010), Carson (2009) and (2013), Costa (1998)5, Linares and Su (2005), Moore, Stunkard and Srole (1962), Goldblatt, Moore and Stunkard (1965), the NHES I (1960-62), the NHANES I (1971-75), II (1976-80), III (1988-94), and Continuous (1999-2023), CenSoc WWII Army Enlistment v1.1, Society of Actuaries (1959) and (1980) for the Build and Blood Pressure Study (1959) and Build Study (1979), Actuarial Society of America Medico-Actuarial Mortality Investigation (1912), Staub et al. (2010), Schoch, Staub and Pfister (2012), Staub et al. (2016), Quanjer and Thompson (2021), Kark and Rasmussen (2005), Lissner et al. (2019), Marmot et al. (1991), Sobal and Stunkard (1989), McLaren (2007), Jaacks et al. (2019), Singh et al. (2011), Lehmann et al. (2016), de Saint Pol (2009), Sánchez-García et al. (2021), Bann et al. (2018), Perkins et al. (2018), Templin et al. (2019), Kuehl and Vuegelers (2008), Staub et al. (2011), Komlos and Brabec (2010), and ICPSR 2877.
While you’re here, go check out my article on whether GLP-1s can end the obesity epidemic!

Relative to European countries and the United States, the slope of this relationship tends to be a little shallower for Asian countries and a little steeper for Hispanic and African countries. You can sort-of see that here:
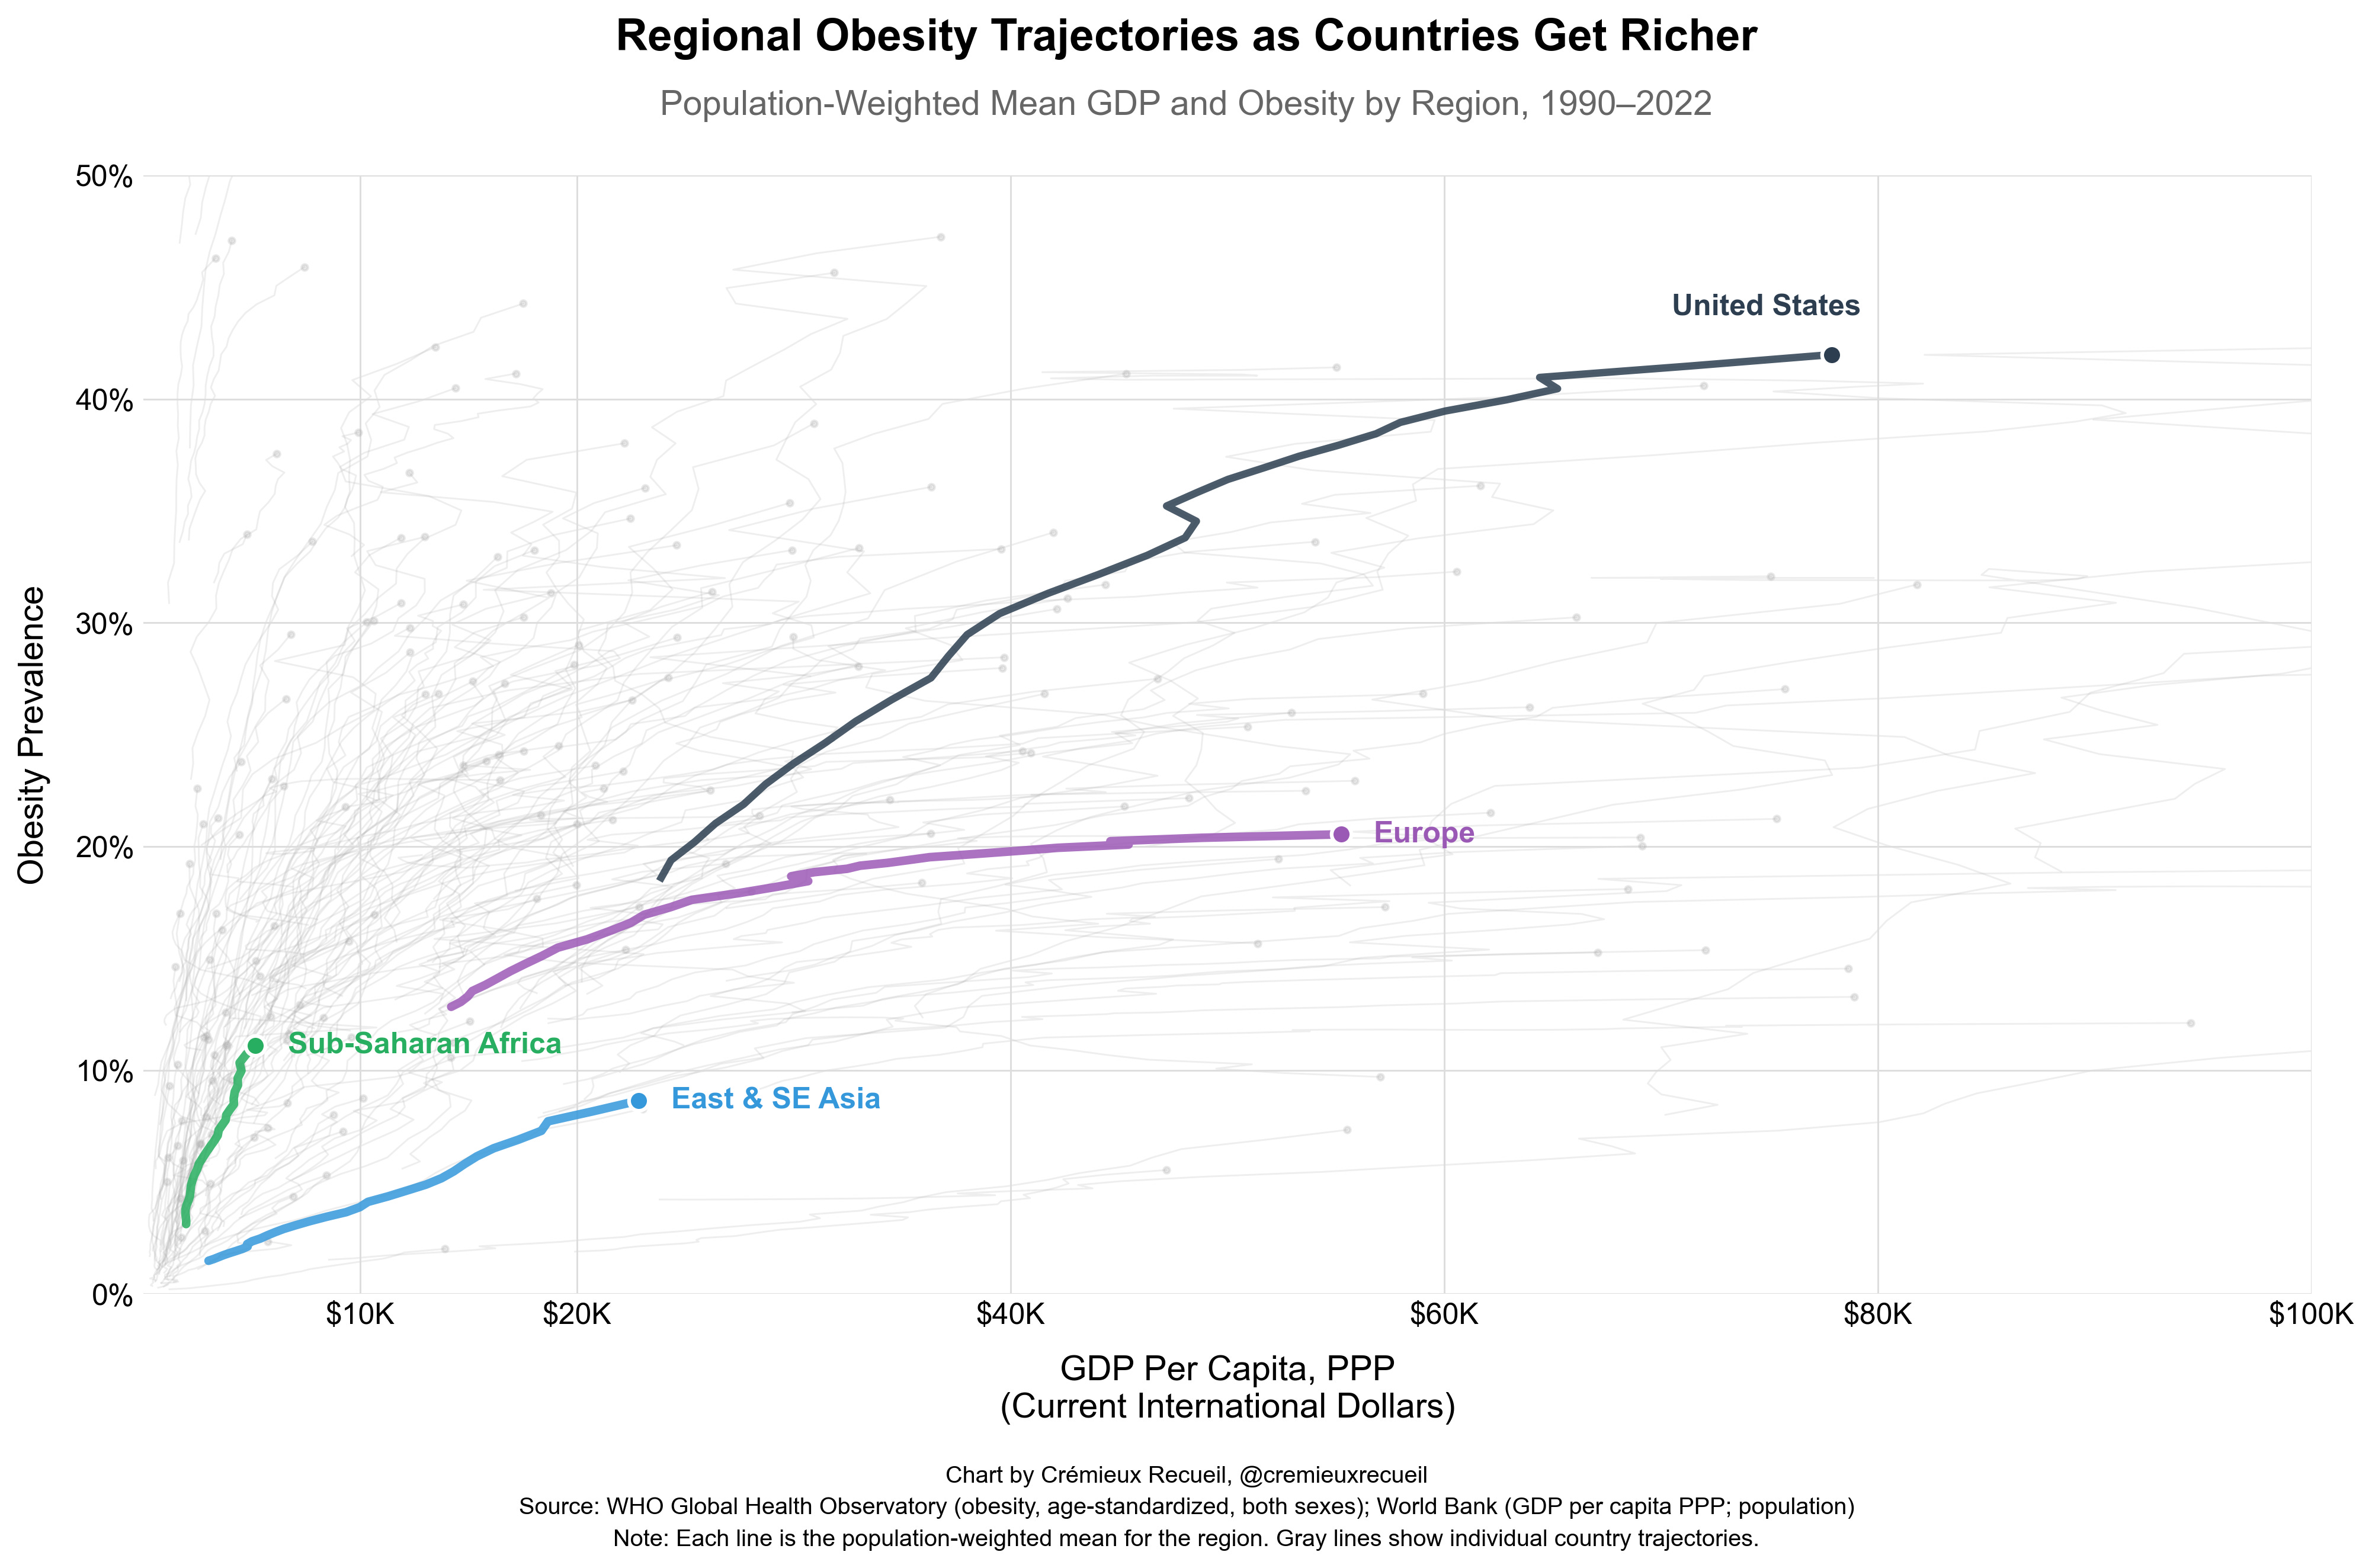
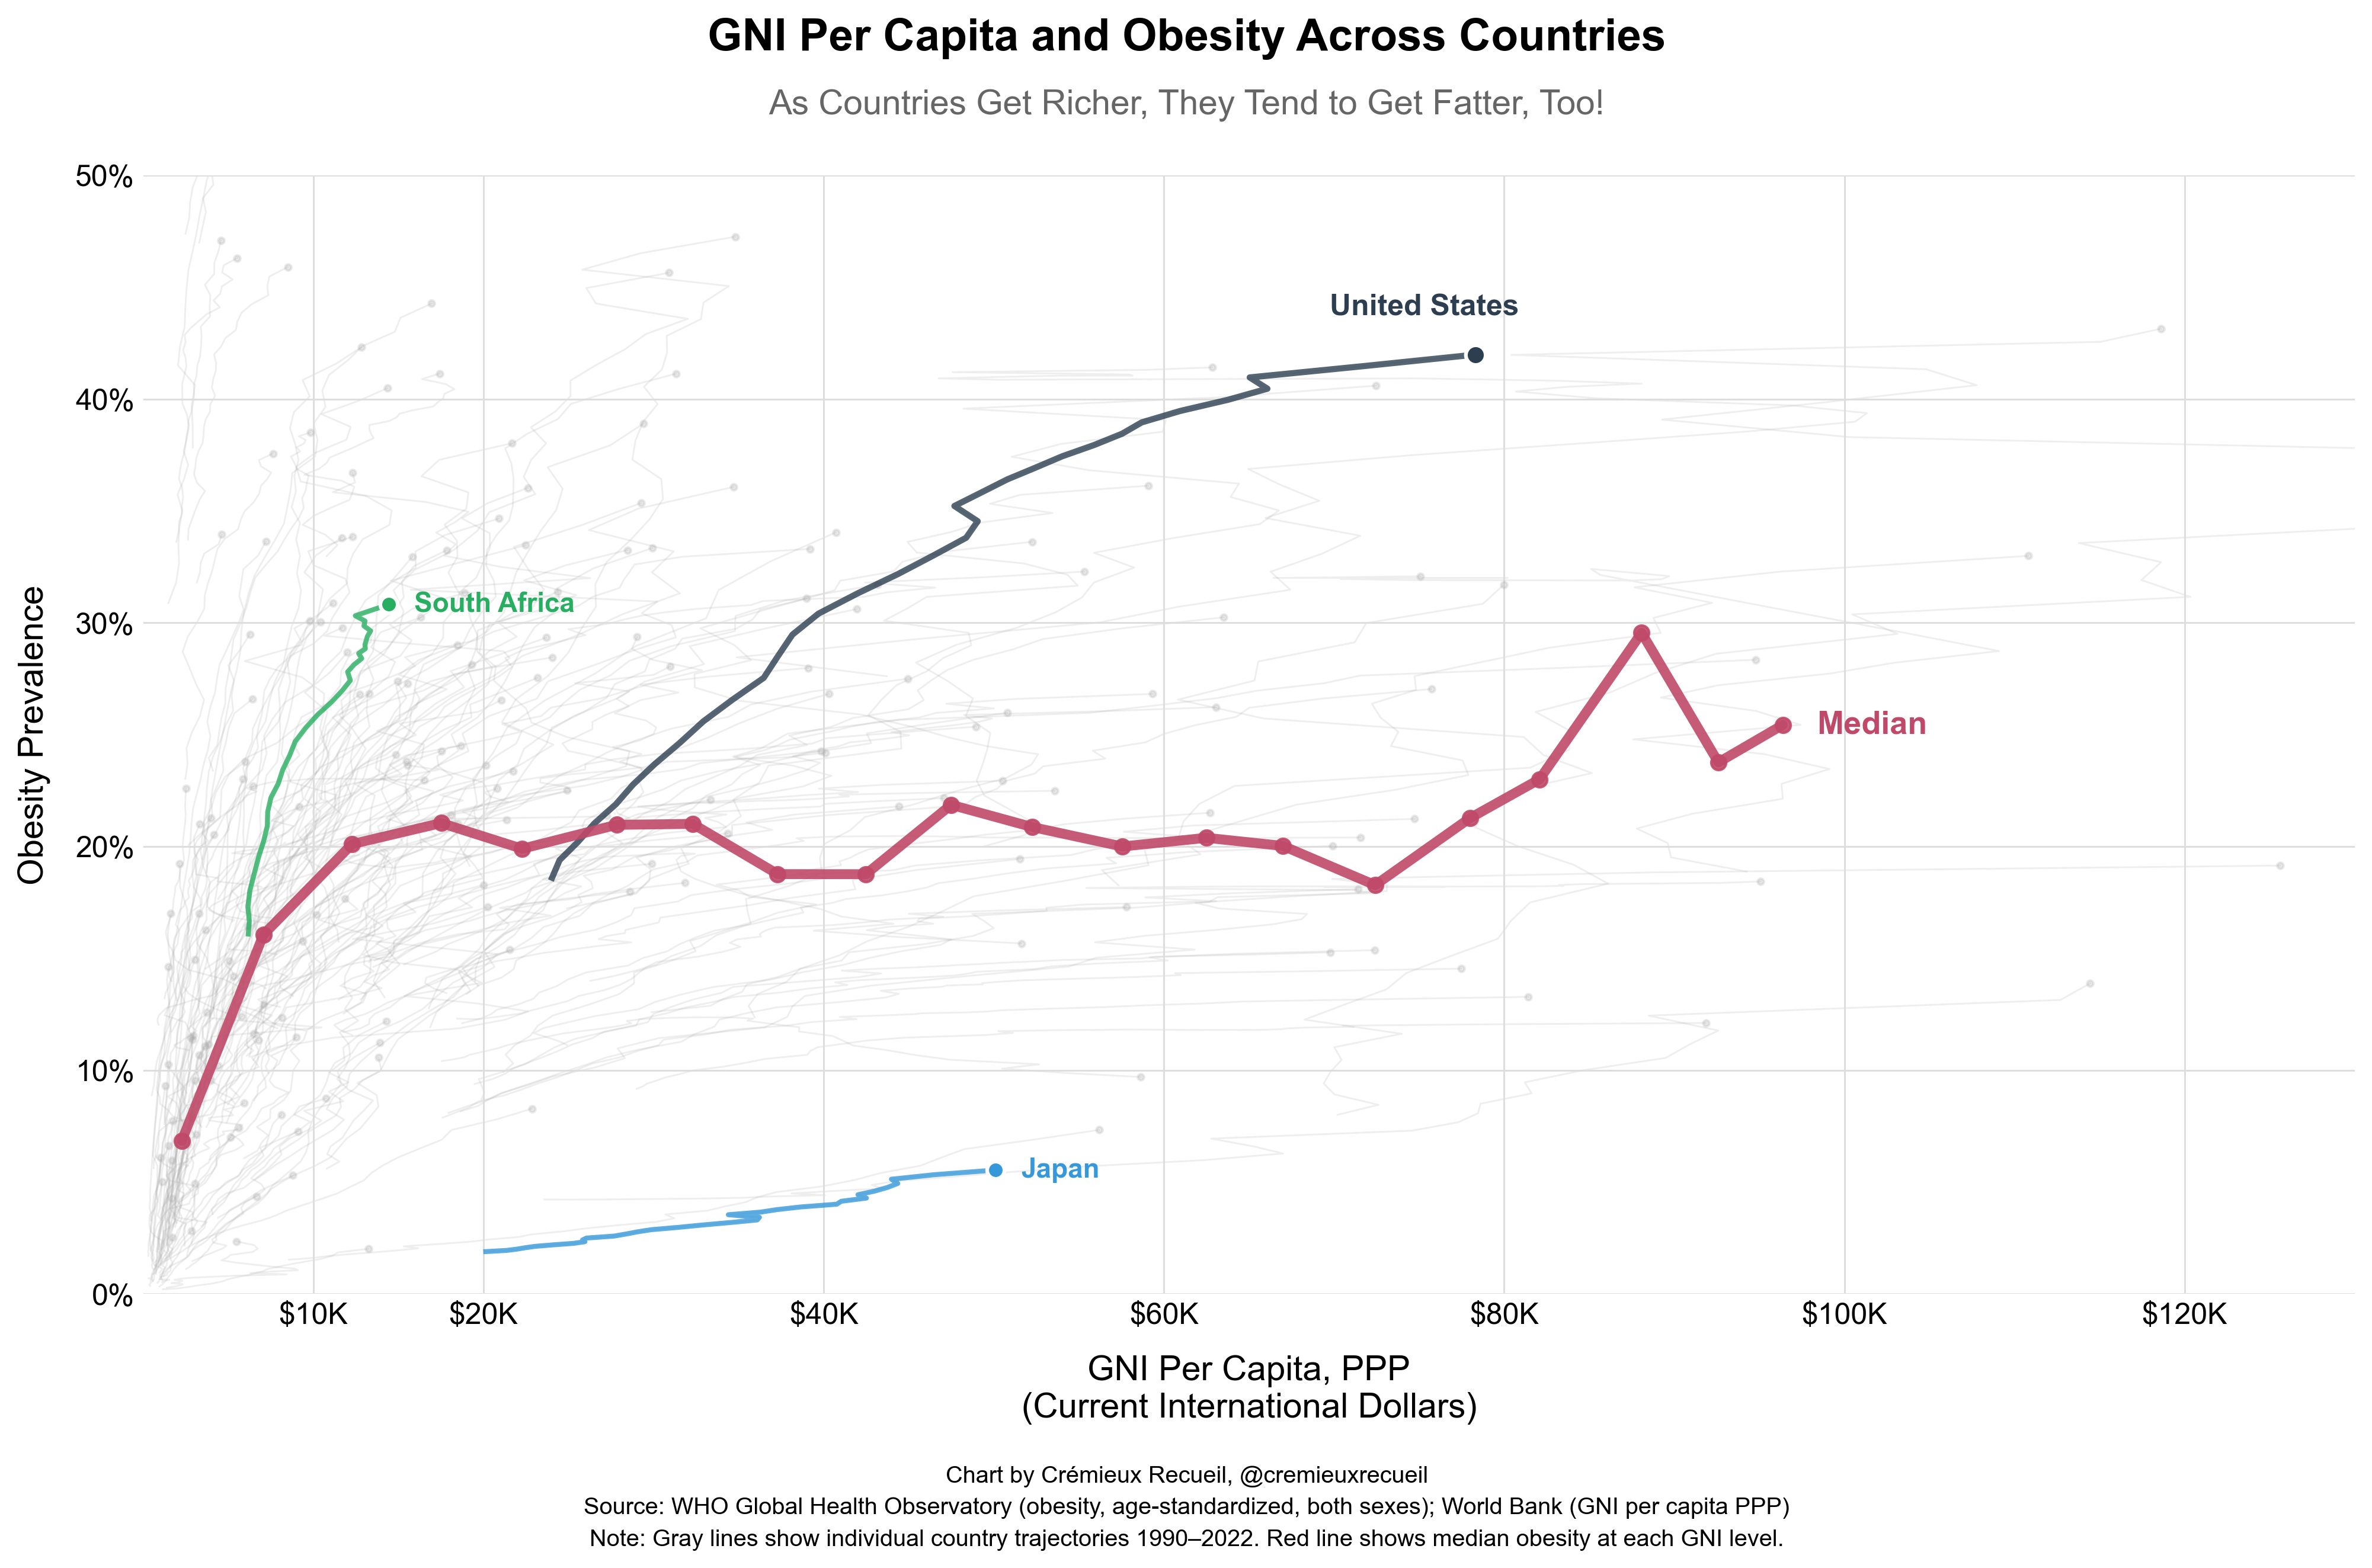
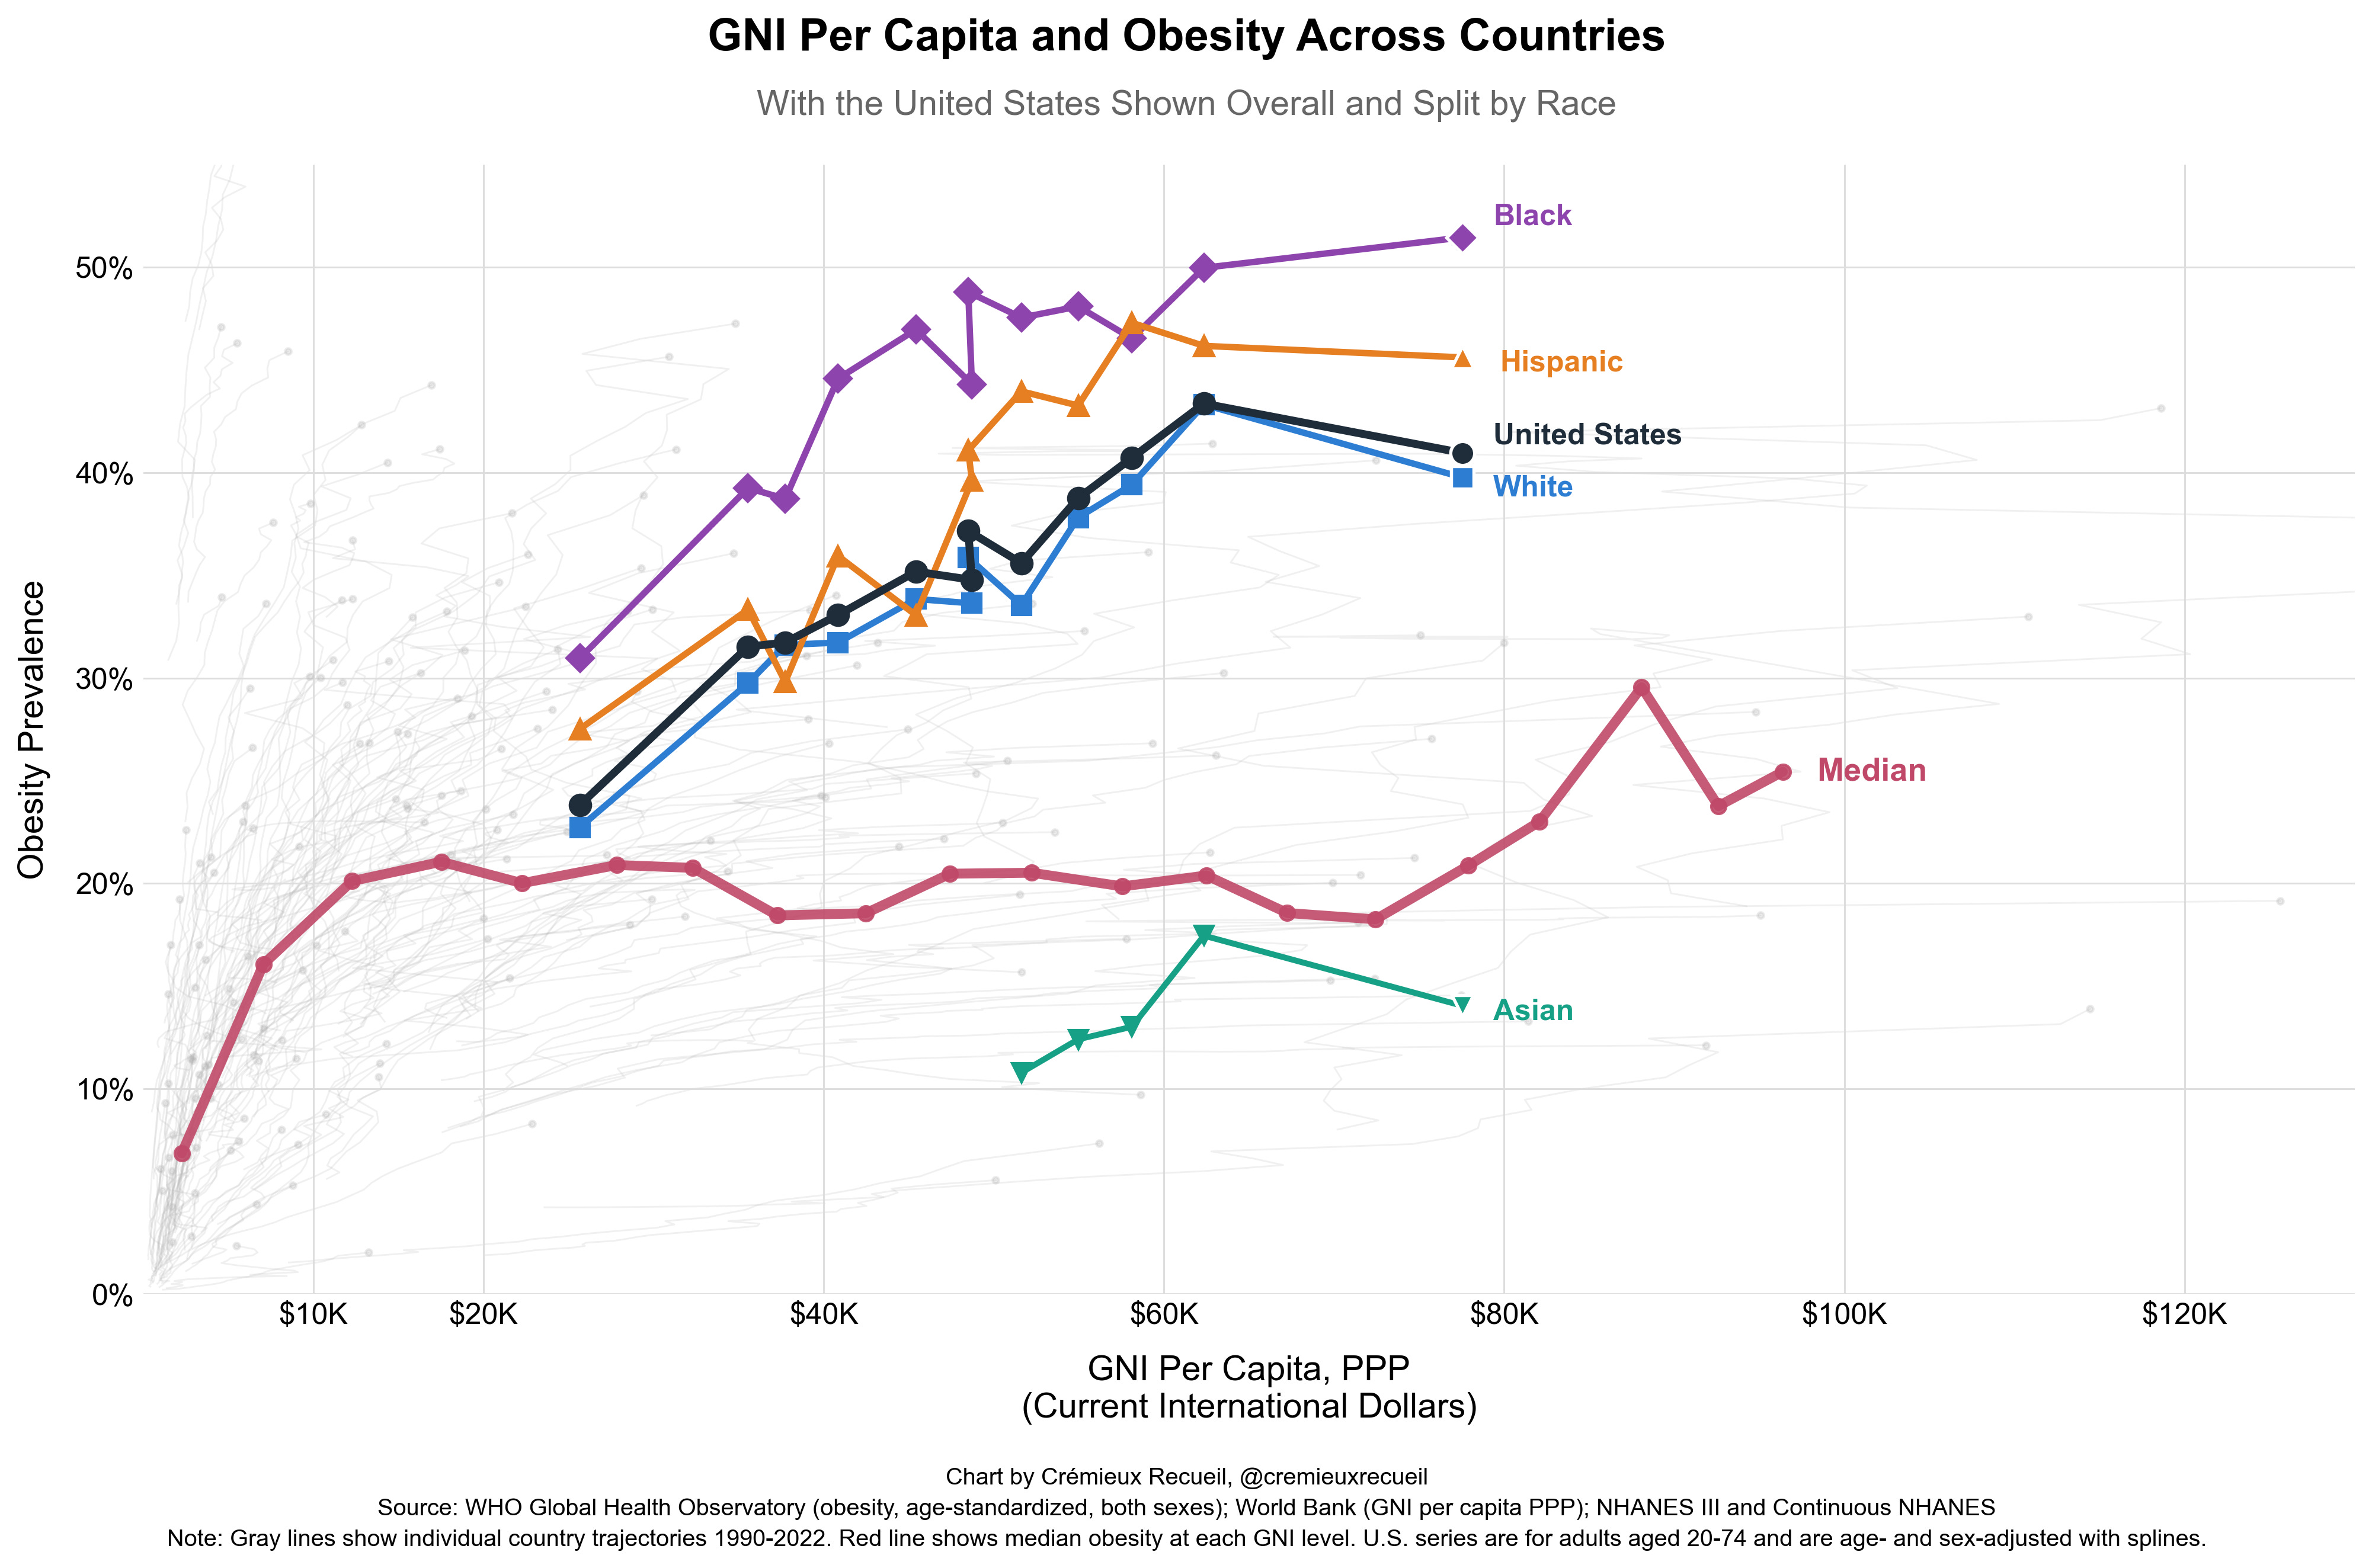
These charts used GDP, which overstates the development of tax havens. It would be preferable to use Actual Individual Consumption (AIC) to get around this issue, but we don’t have good continuous measurements of AIC, so we’ll have to settle for the Gross National Income (GNI). Using GNI, we get this replication of the first chart:
And the GNI version of the second chart looks like this:
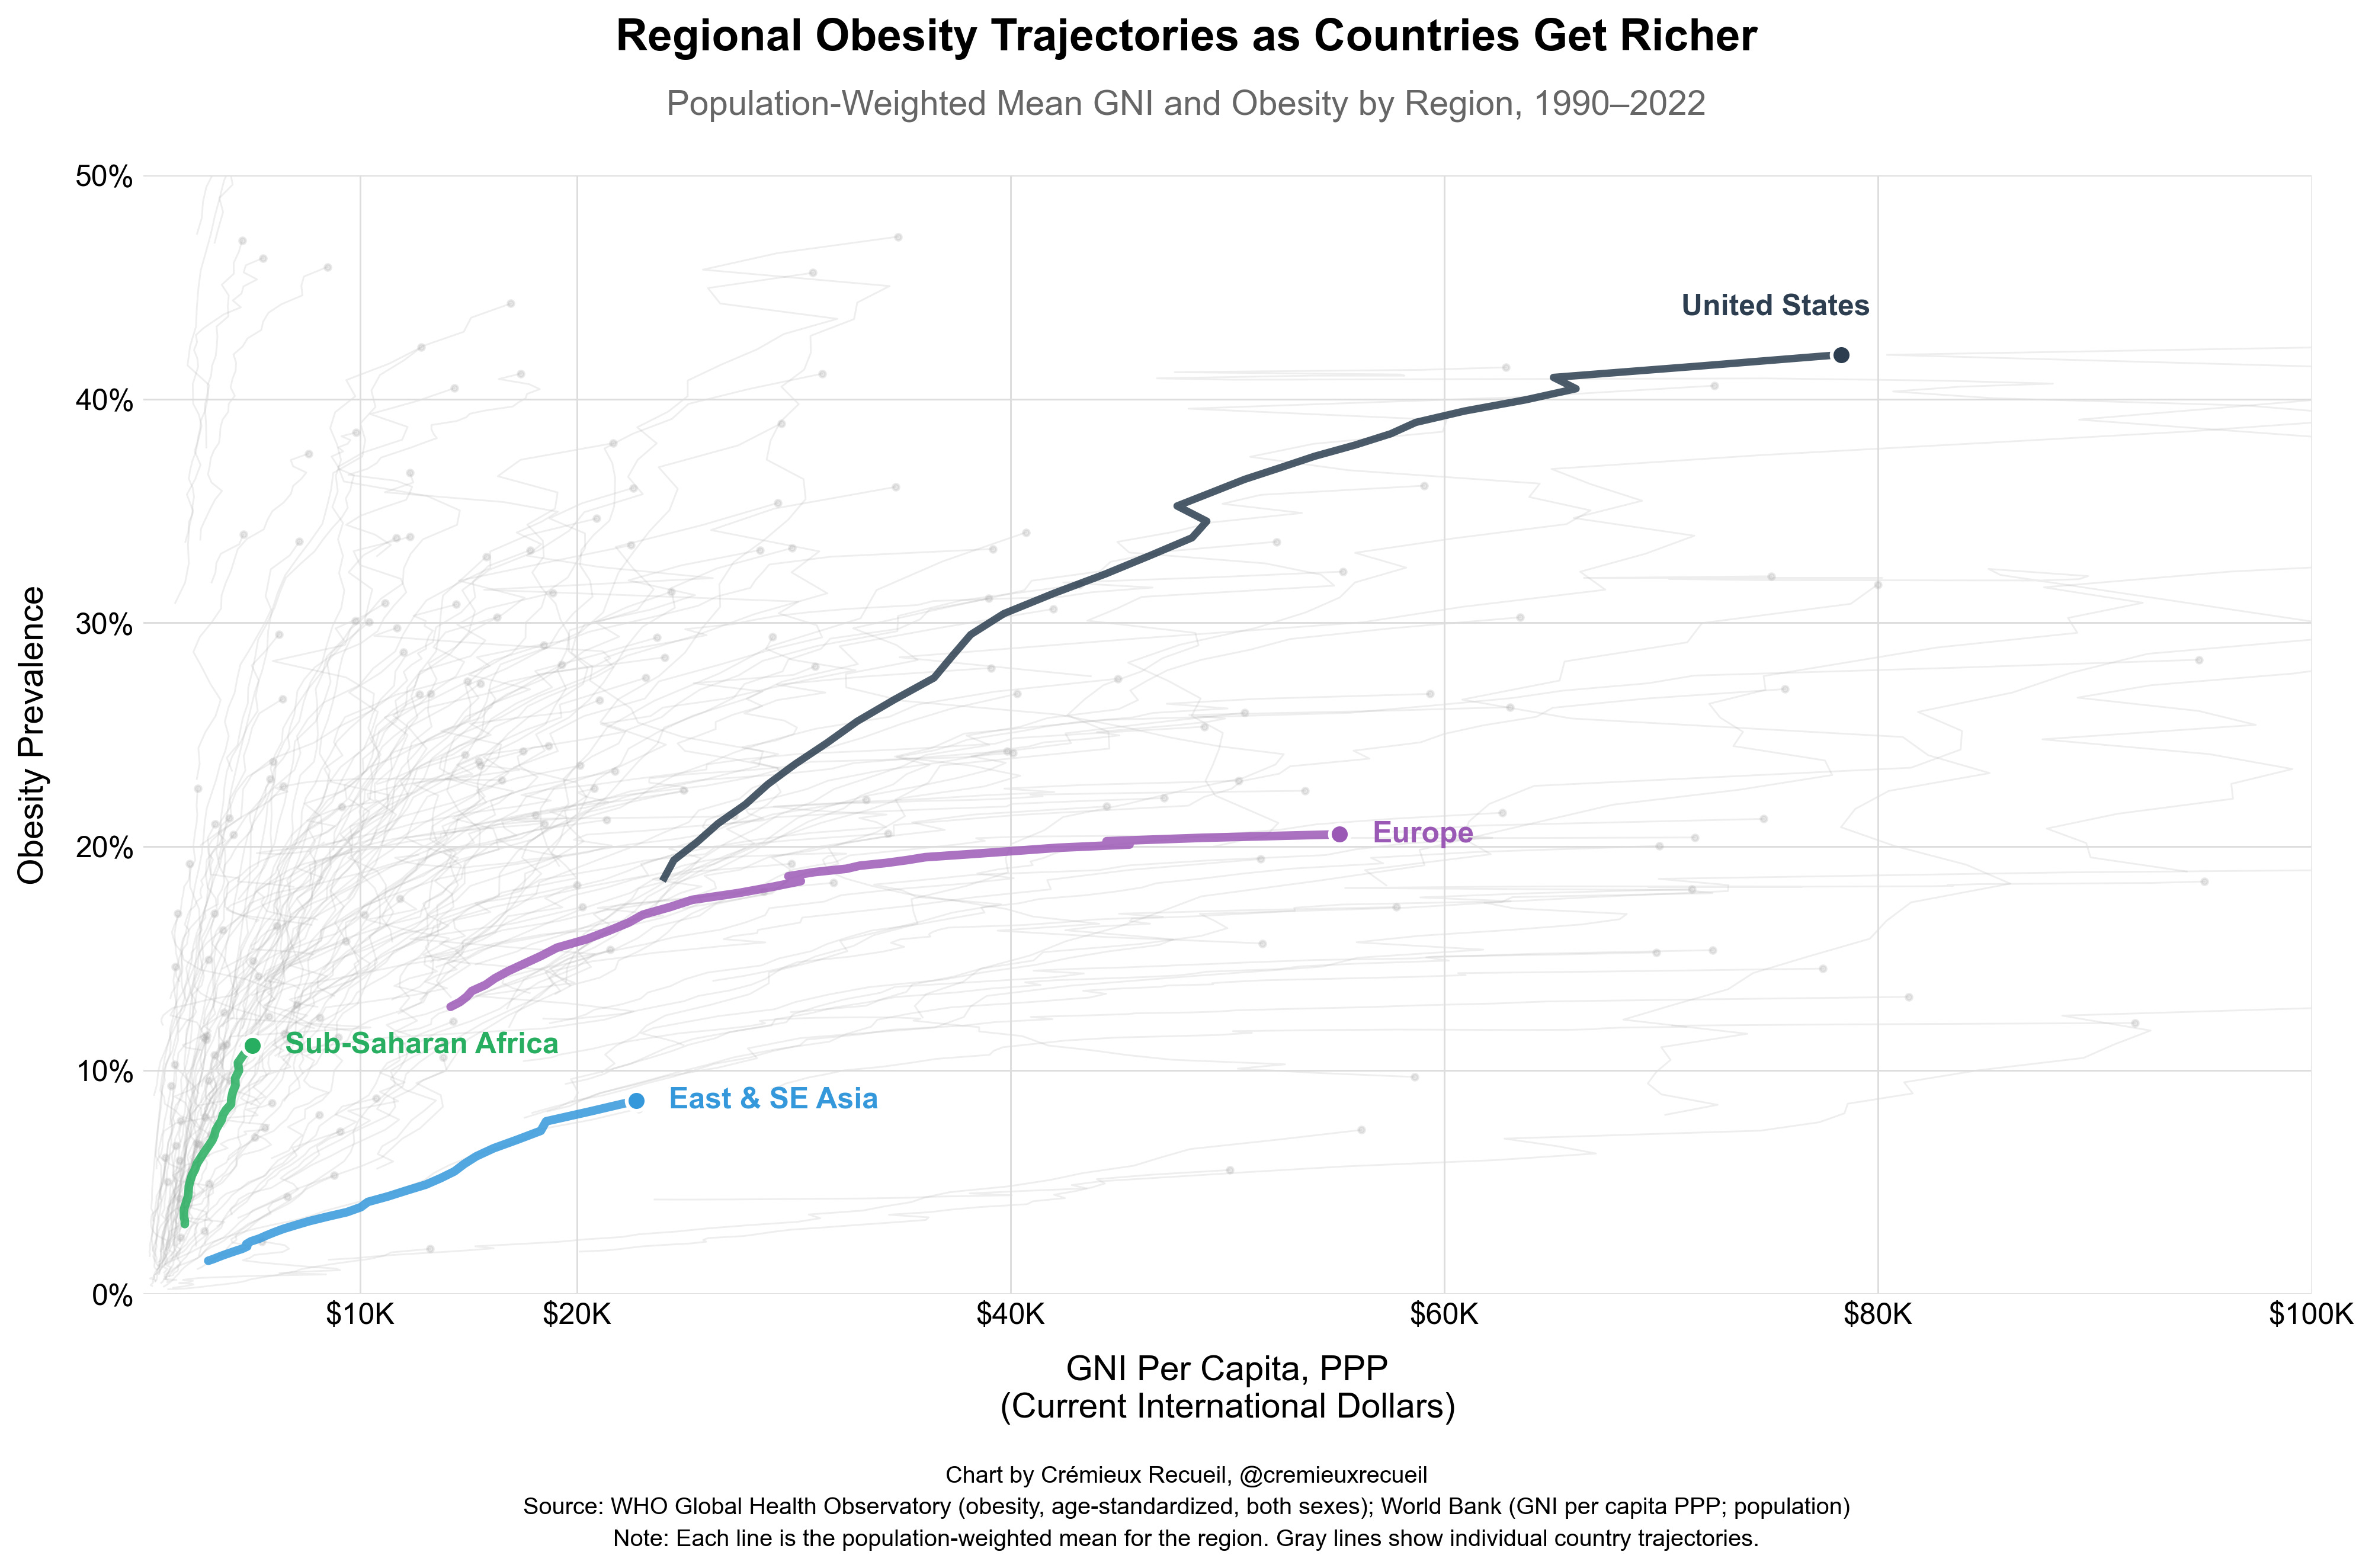
As a final note, the median figure in the first plot is not an accurate depiction of international tendencies because it’s differentially reweighted along the GDP continuum. A similar issue applies to the regional aggregates in the second chart, but it’s less of an issue there because those countries tend to be more similar substantively and in terms of their ranges on both variables.
April 4, 2026 Update: Several people have asked me if this relationship holds within the United States between different racial groups. It likely does. With GNI, the plot looks like this:
With GDP, the shape for the U.S. data points is basically unchanged, except the graph is more compressed due to high GDP/lower GNI outliers, and the shape of the Median line differs, as above. So, for visibility, just take the GNI plot. Now, if you look at that plot, you’ll notice that the slopes do not appear to differ, but the intercepts do. This is even clearer if we go back as far as nationally-representative sampling allows, with the NHES I dataset:
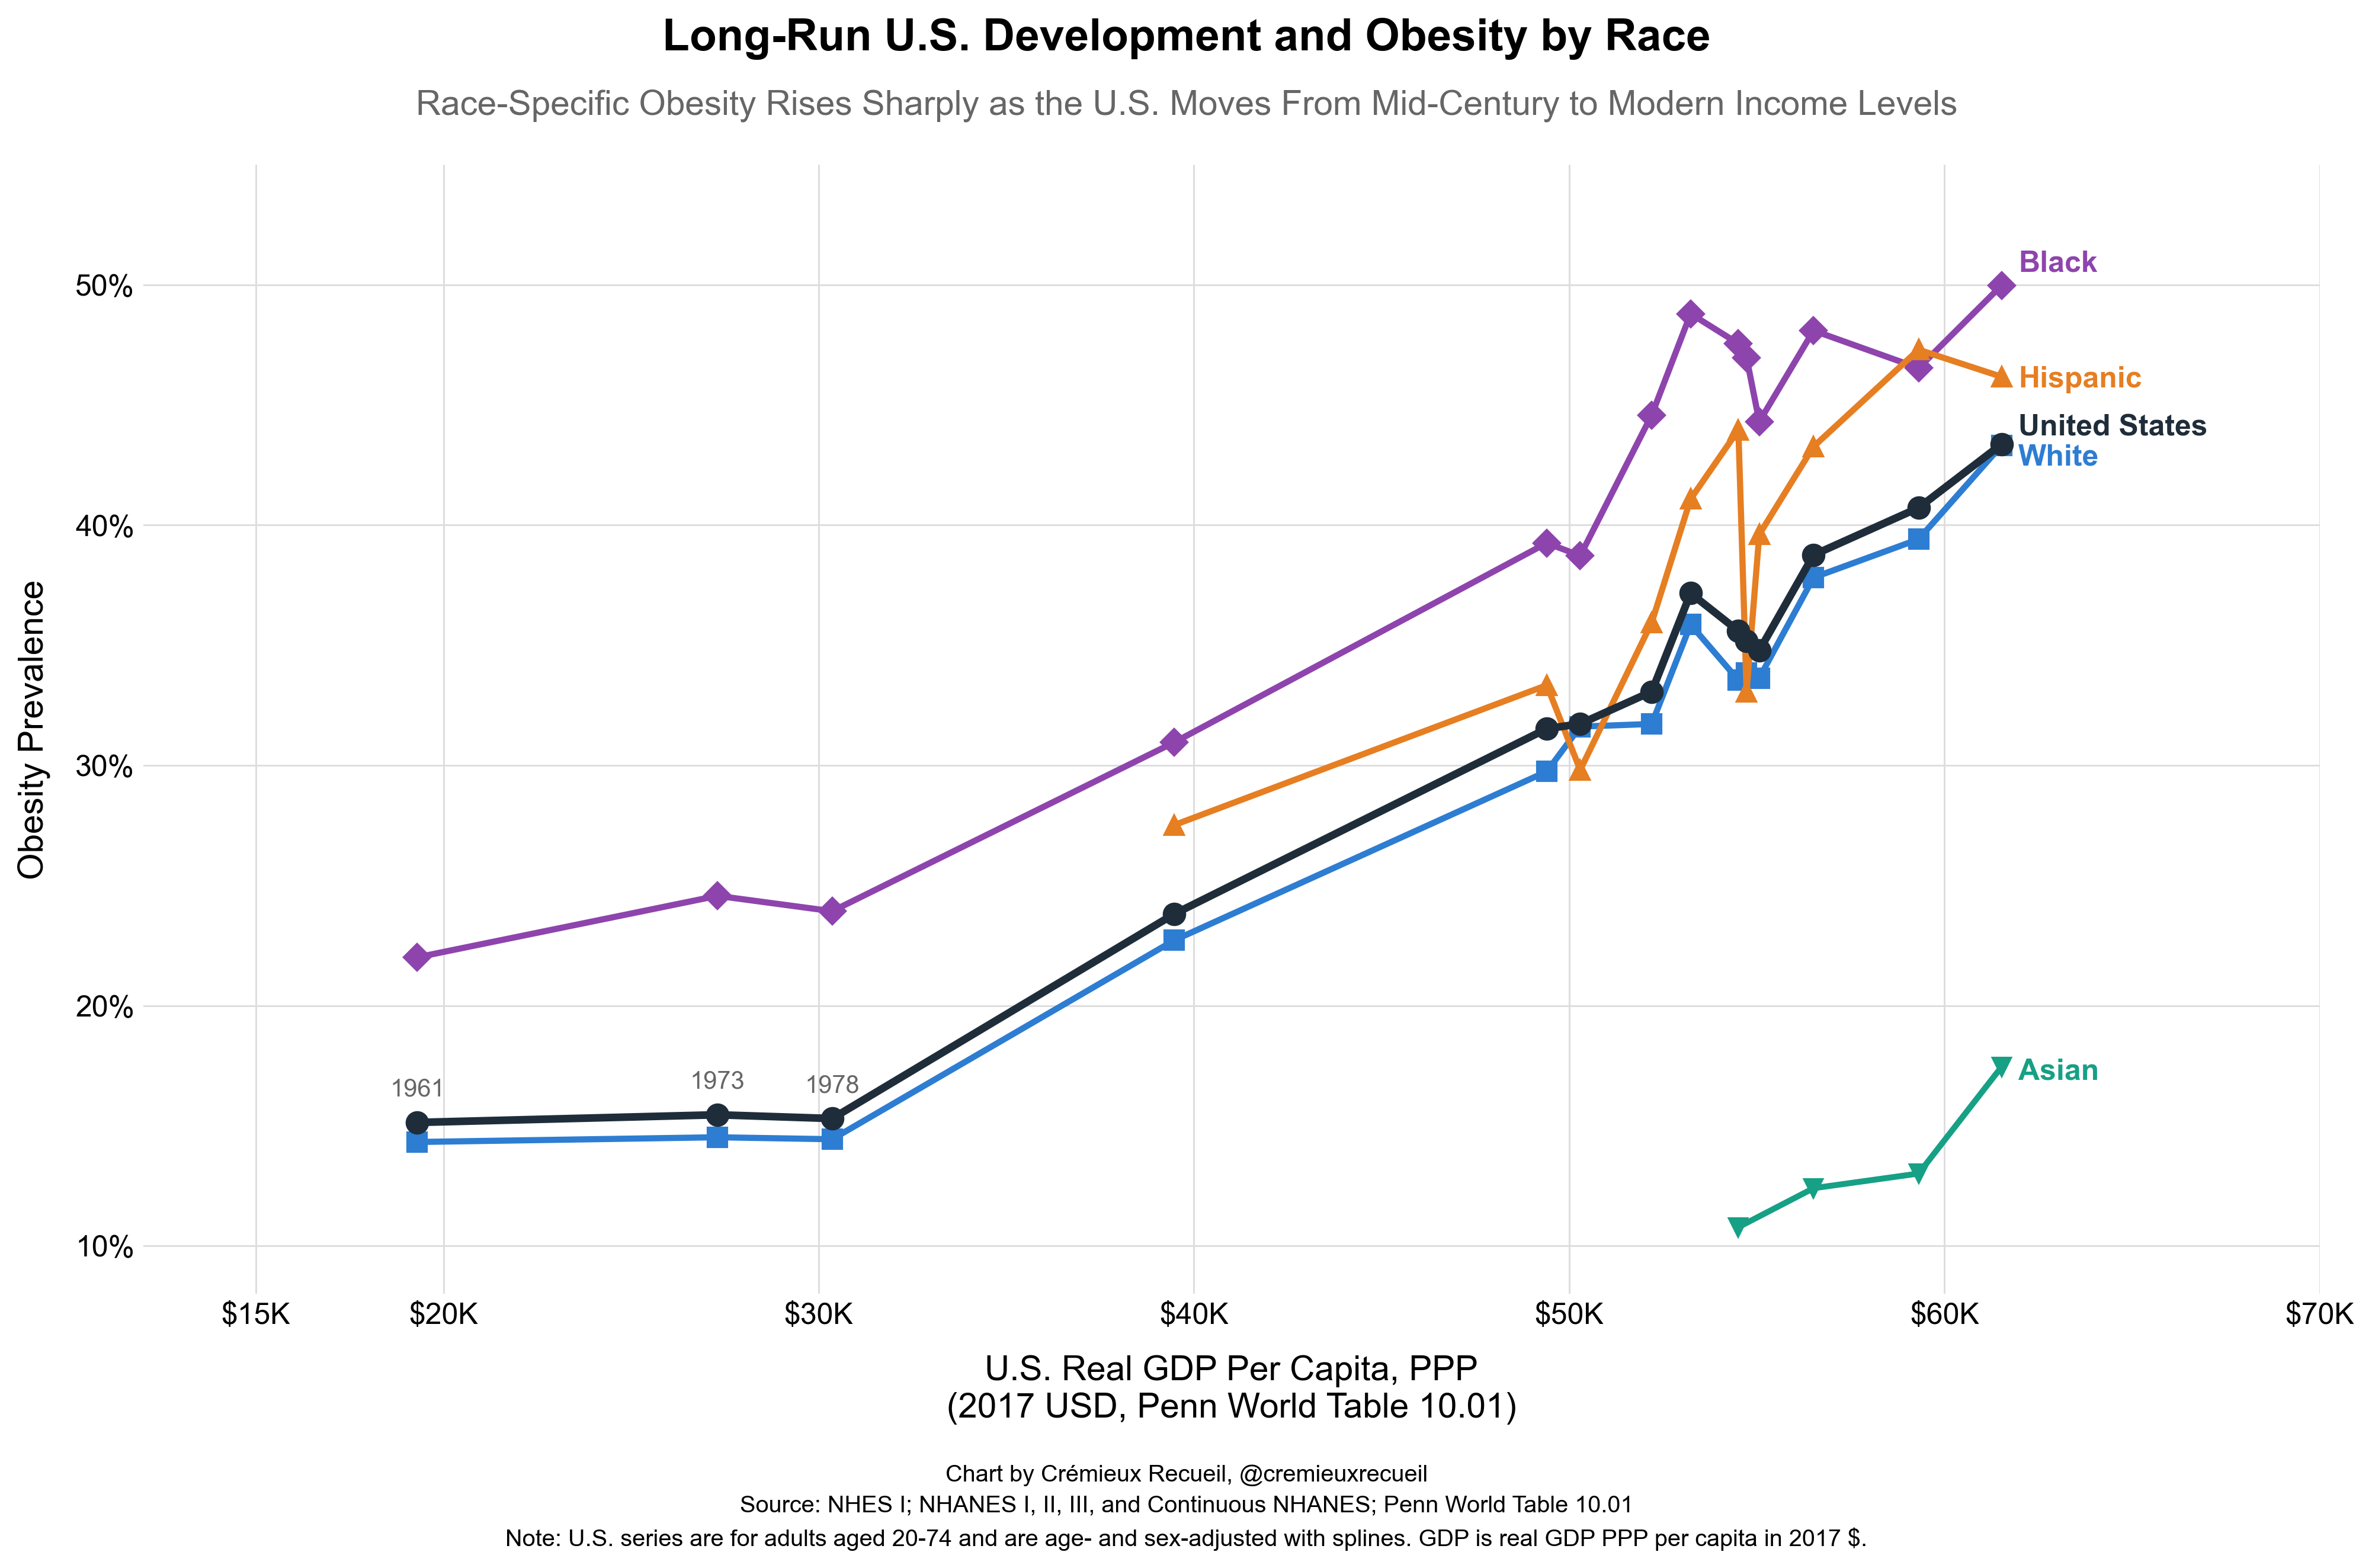
Unfortunately, the large-scale, nationally-representative datasets started in 1961, meaning that they happened after substantial development. As I recorded on Twitter/X, the slope is sharpest in early development and it appears to considerably flatten out at higher levels.


The data from 1961 is largely after the expected point where the slopes should differ the most. And think about this: in the distant past, when resources were much more limited, the world was much poorer, life was more physically arduous, etc., and it was difficult for most people to be fat, different races’ BMIs should have been more similar—and indeed, the obesity epidemic has involved increasing variance.
To get at whether the slopes really differ within the U.S., we need older data. We do have some in sources like this, where the Black-White BMI gap in the 19th century held stable for a long time and was very small, but that data mostly concerns males, and the modern Black-White BMI difference mostly concerns females. Luckily, we do have female data!
The problem with the female data from the 19th century is that it’s a bit selective: it concerns prisoners. With male data, we have soldiers, laborers, photographs, and prisoners, and the estimates all converge on the conclusion that there was little Black-White BMI gap in the past, and with female data, we have photographs, prisoners, and not much else, but, reassuringly, these too converge on the idea that BMIs were similar in the past. More importantly, in the modern day, female prisons tend to recapitulate the Black-White BMI gap seen in the general population. In Nowotny, Rogers and Boardman’s analysis of the 2004 Survey of Inmates in State and Federal Correctional Facilities compared to the NHANES data we’ve been using, they found the following Black and White female obesity rates:
Non-incarcerated: 26.5% for White, 45% for Black (+18.5pp; +69.8%)
Incarcerated: 22.9% for White, 40.9% for Black (+18pp; +78.6%)
Difference between contrasts: -0.5 (-6.6 to 5.6, p = 0.87; 0.97, 0.70 to 1.37 in relative terms)
So, with some assumptions about the relative constancy of representativeness in prisons, we can get to the conclusion that the slopes did vary predictable in the U.S., in a way that explains the vast majority of the modern intercept difference.
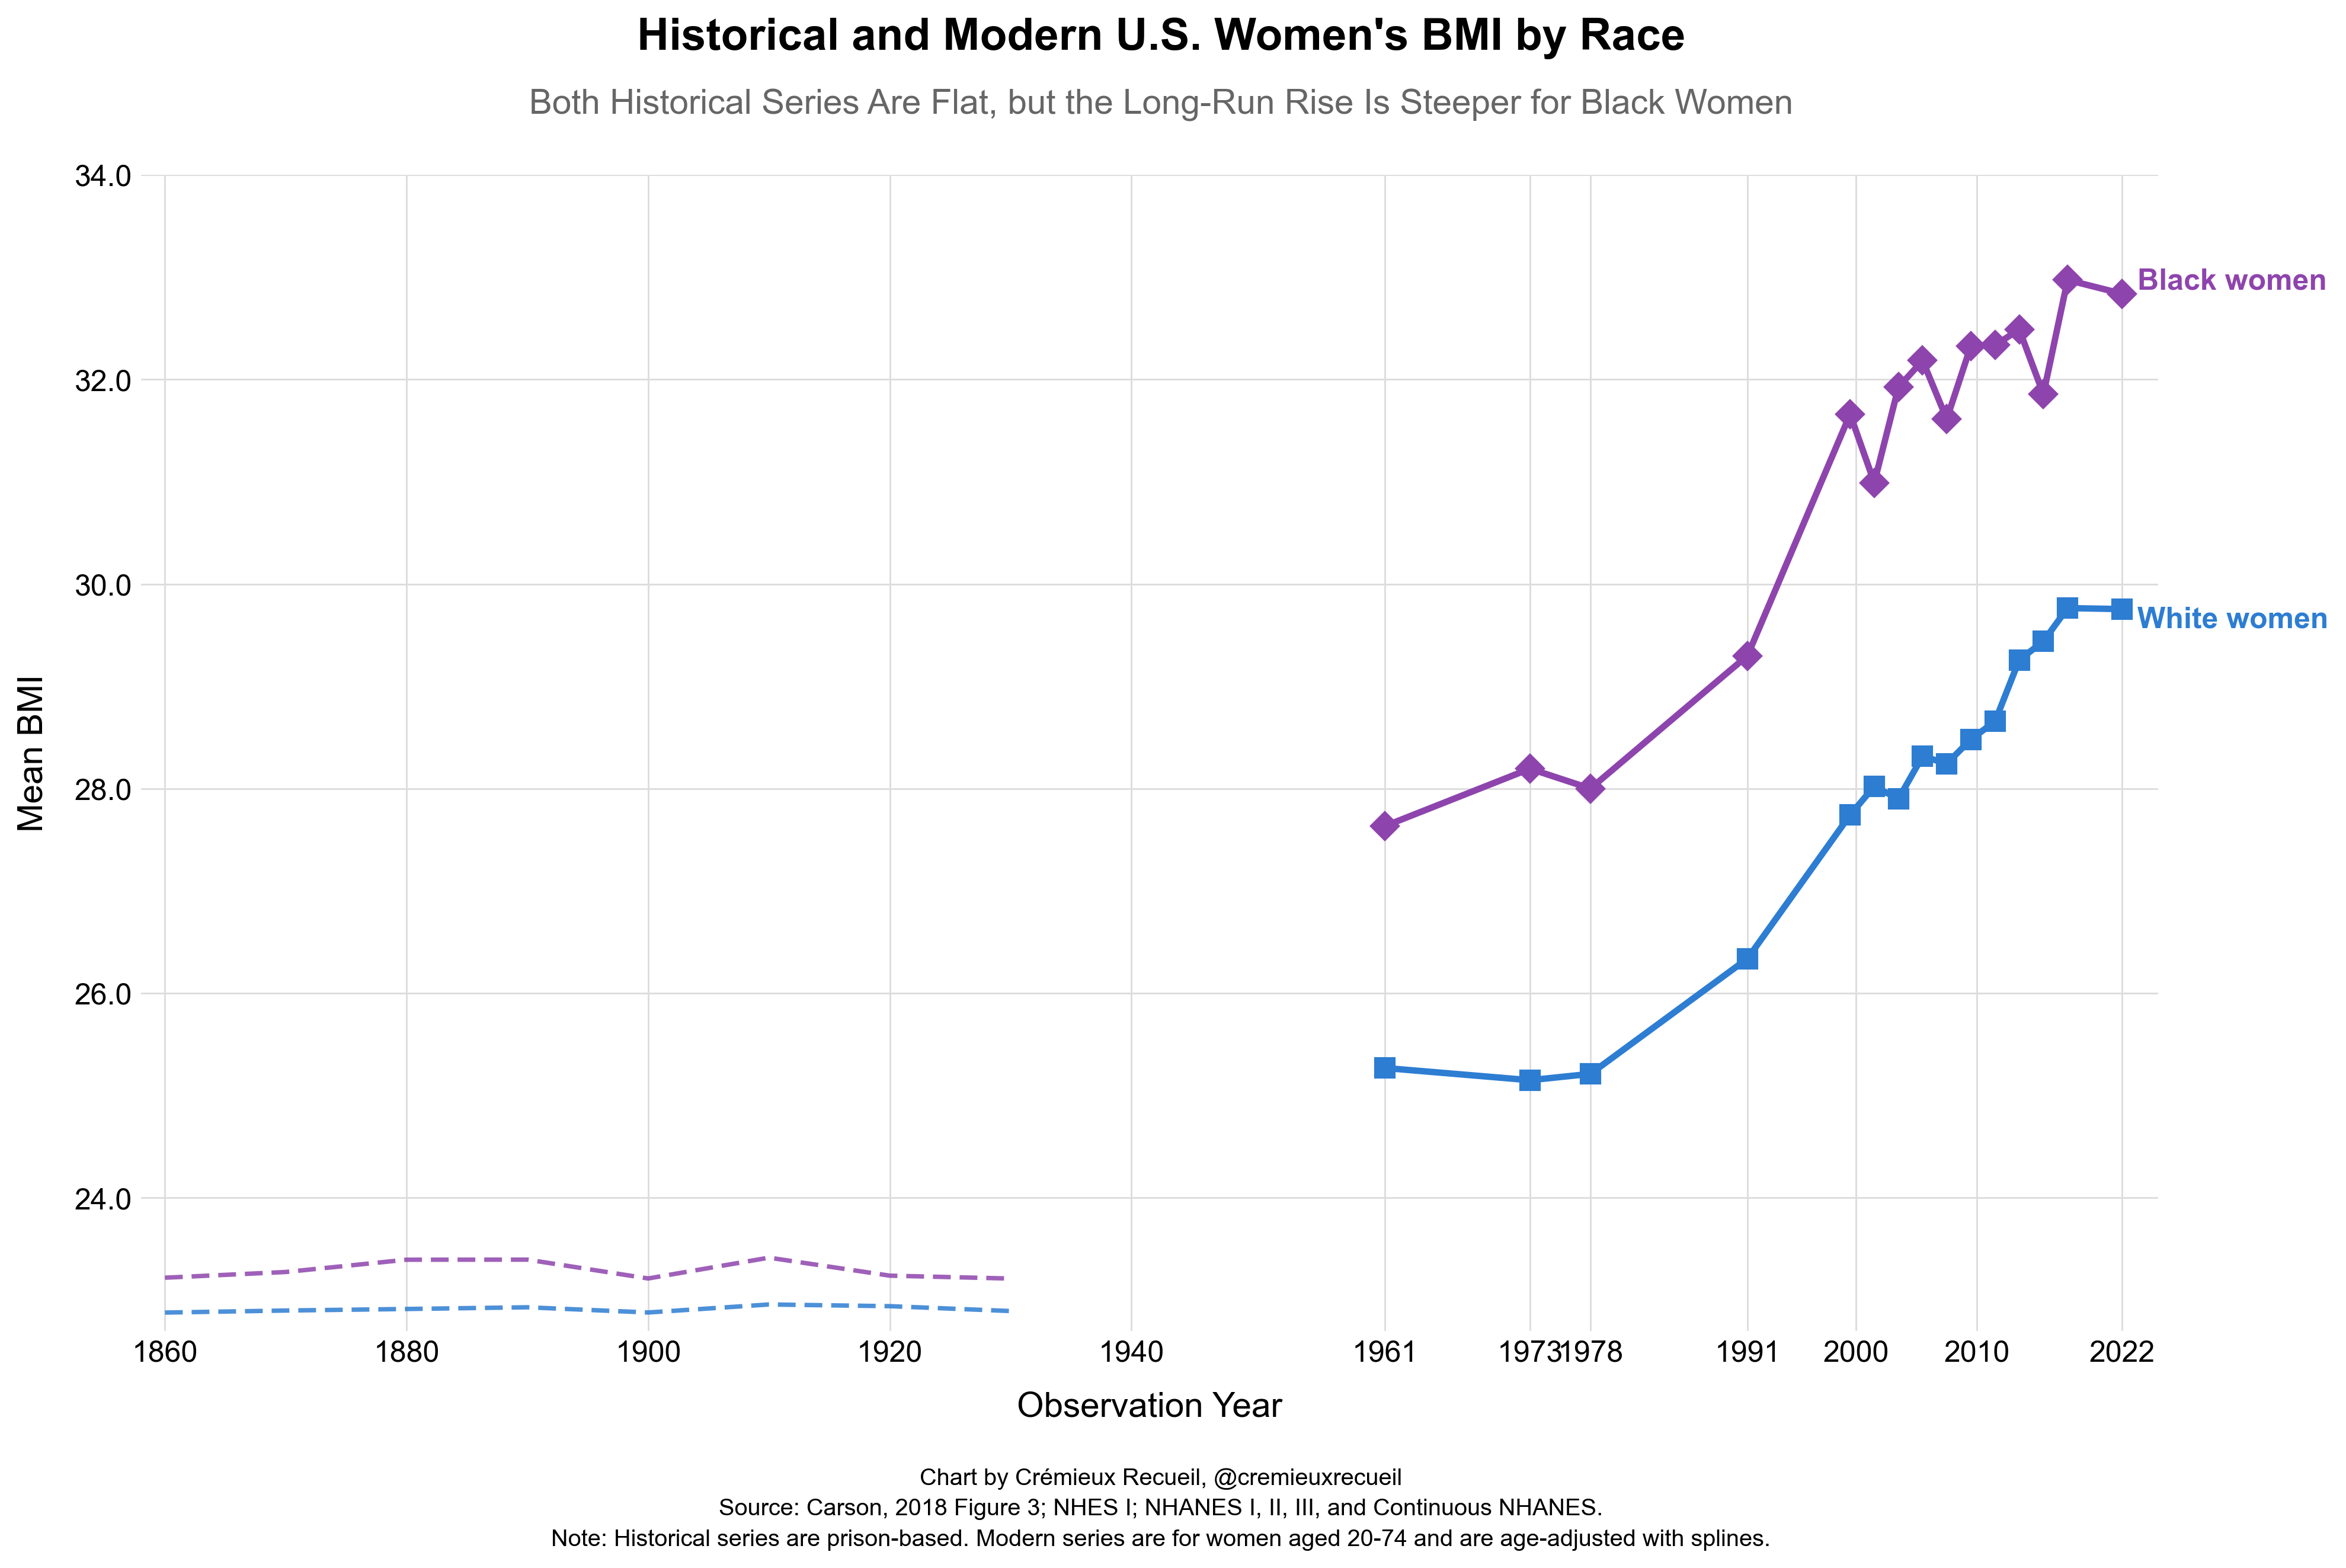
Unfortunately, we can’t repeat this with other groups because the data just doesn’t exist. But it remains a priori likely that there were major slopes differences within the U.S. for each group, which we can see in said groups having different intercepts today, and the past being a place where the range of BMIs was relatively constrained within and between races.
In some cases, they’ve just been fatter in the whole welfare state era and I’ve included their data so we can see cross-national differences, not to showcase a shift per se.
There’s one exception that bucks this era’s trend of greater obesity for wealthier persons, and it’s the Gould military sample, composed of a bit over 17,000 White soldiers. Among those from agricultural occupation backgrounds, the mean BMI was 22.61. For artisan backgrounds, it was 22.60; seamen, 22.77; laborers, 22.75; professionals and/or proprietors, 21.97.
My suspicion is that this relationship doesn’t reflect obesity so much as a rare failing of BMI, and the ‘fatter’ groups in this era are actually just more muscular. There’s a modicum of evidence for this in the form of agricultural workers being taller than people from professional backgrounds, but that breaks down for intermediate groups, where the expected socioeconomic status by height relationship seems to mostly hold, with artisans averaging 170.3cm, seamen 168.4cm, and laborers 169.3cm versus the 171.5cm for agriculture and 170.2cm for professionals.
Age adjustment is based on the same spline adjustment I used in my ice cream, seed oil, and ultraprocessed food papers.
Among other reasons:
Obese people tend to earn less respect from others and are harmed by discrimination as a result of being less attractive relative to their healthy-weight peers.
Obesity disposes people to being sick more often and makes it harder to move around and encourages being lazy.
Obesity leads to more medical expenses, and having to pay said expenses and face higher insurance premiums and whatnot can be costly.
Probably men care more about obesity in their mates than women do, high status men have more choice of mates, and a common way to gain status is by mating well (or, at the least, there is assortative mating for status), thus higher status women tend to be less obese, but not higher status men, ultimately because of the sexes' asymmetry in mate preferences.
Interesting that the decline in obesity rates for high income men is higher than that of high income women. Especially as GLP1 usage should be higher in the latter cohort. Is there data for 2024 and 2025 to see if this trend persists?