Brief Data Post
Part II
Socioeconomic Explanations for Criminal Offending Gaps
Steve Sailer has repurposed data from Raj Chetty’s 2019 Race and Economic Opportunity in the United States: An Intergenerational Perspective to produce this graph shooting a hole through socioeconomic explanations of the Black-White criminal offending gap. Emil Kirkegaard covered it here.
Some earlier publications have produced similar patterns of results and they seem to show that there’s often not much contrast between publications that use victimizations and those that use perpetrations. That makes sense given the strength of victim-perpetrator overlap.1
For example, here’s homicide rates by median family income within Blacks or Whites
and here are firearm assault victimization rates by median household income
And the Bureau of Justice Statistics (BJS) has provided twelve years of data (1996 - 2008; also discussed in the context of rape, here) on victimization by income and race. To get a good picture of the differences, it may be useful to use a broader category like completed violent crimes. The Black-White ratio with this measure is not quite as extreme as it is for incarceration, homicide, or firearm assault, moving from 1.02 at the lowest income level to 1.71 at the highest. The reasons for this are two-fold:
First, this data concerns all violent victimizations, rather than just the rates for the most deadly type of assault (firearm), their worst possible result (homicide), or the incarcerations that result from them, all of which are amplified in prevalence if the group is simply more violent at the mean. A more violent person should, ceteris paribus, commit a greater quantity of and a greater level of violence, and the justice system punishes more extreme violence more greatly.
Second, as this is data on victimizations, it fails to provide an accurate picture of the levels of violence for different groups to the extent victim-offender overlap is incorrect. Since the U.S.’ White population is simply larger and interracial/intraracial violent perpetration ratios differ by race, there will be noticeable discrepancies.
As Inquisitive Bird has shown, American Blacks victimize more Whites than they do Blacks, and American Whites victimize way fewer Blacks in total and relatively. This isn’t just driven by population proportions, as White offenders accounted for 8,180,250 violent incidents between 2018 and 2021 (52.31% of the total, or slight aggregate underrepresentation), with 85.53% of those incidents affecting other White people, 9.47% of those affecting Hispanics, 1.65% affecting Asians, and just 3.55% affecting Blacks.
For Blacks, who constituted a fifth of the White population, the total number of incidents they were responsible for was 4,064,4402 (25.99% of the total, i.e., overrepresentation by a factor of two), with 35.15% affecting other Blacks, 14.98% affecting Hispanics, 3.91% affecting Asians, and the residual 45.96% affecting Whites. Similarly, 48.44% of Hispanic violent crimes were against Whites, 52.07% of Asian violent crimes were against Whites, and 71.39% of violent crimes by "Other" group people were against Whites. The fact that Whites are each group's most common objects of victimization is important to remember when viewing this figure:
The 1.71 ratio here is more impressive than it sounds. If Blacks offend at twice the rate they’re victimized at — and per Inquisitive Bird, they offend at 2.022 times the rate they’re victimized at — and White people have an offending rate that’s roughly 80% of their victimization rate — the real number is 77.02% — then the Black-White offending ratio is roughly 2/0.8 = 2.5 times larger than the victimization ratio. Being precise by using the actual offending and victimization numbers, the offending ratio is 2.63 times larger than the victimization ratio. Or, in other words, if the victimization ratio is 1.71, the offending ratio is 1.71 * 2.63 = 4.50. Substantially, this implies Blacks are 4.5 times more likely to commit a completed violent crime.
But, since that ratio comes from the most extreme income level, it’s not correct. Instead, we can use the mean of 1.46, for an offending ratio of 3.84. But the mean ratio isn’t right either, since we know Blacks and Whites differ in their socioeconomic positions, so the proportions of either population in any given bracket are not the same. A different way to get at the offending ratios is to eschew using the victimization ratio, since we would need to gather data on the proportions of both races within each of those income brackets. To do this, we simply take the number of offenses in either population and divide them by their population numbers. So, if we use the numbers 231.9 million Whites and 41.6 million Blacks, we get (4064440/41.6)/(8180250/231.9) = 2.77.
But since the BJS provides the raw numbers without respect to socioeconomic status anyway, we can just throw everything together to get the victimization ratios we need. In the linked BJS data, this information is found in Table 5. From 1996 to 2008, the victimization ratio averages 1.70, or very close to the 1.71 at the most extreme income level across all the years of available data. So, 1.70 * 2.63 = 4.47, or basically the same conclusion as in the initial calculations.
The only problem remaining here is that Inquisitive Bird’s data and the BJS’ data come from different years, so the offending or victimization ratios may have changed in those times to make these numbers an exaggeration. But that seems unlikely. There wasn’t any systematic change across years in the BJS data, nor was there in Inquisitive Bird’s data. Any change of substance would have had to be in the years excluded from coverage, and thinking of those years as somehow special reads like an appeal to the god of the gaps.
Because the matched-group gap stuff got me interested, I also plotted the NAAL and NALS data from Cohen, White & Cohen (2012).
The dashed horizontal line is the performance level of Blacks with graduate educations in the subjects Prose Literacy, Document Literacy, and Quantitative Literacy. These are defined as “the knowledge and skills needed to understand and use information from tests”, “the knowledge and skills required to locate and use information contained in materials”, and “the knowledge and skills required to apply arithmetic operations”. The report containing these definitions also has a similar graph, with data from 1993.
Looking through the studies mentioned here (see Meng’s post, too), this pattern seems to substantially hold across a lot of methods of matching socioeconomic status. With educational matching, it looks like graduate-educated Blacks are about as smart as White high schoolers. A friend found a lot more examples of this and told me the matching effect over the past century is a roughly 25% reduction in the aggregate gap in cognitive performance using comprehensive measures and a 20% reduction for non-comprehensive measures. Hopefully I can post his numbers when he puts them up.
As Jensen explained back in the 1970s and repeatedly since, differences in means coupled with partial heritability suggest regression to the mean and, accordingly, patterns that look like steady states. Due to their mean status differences, when you compare low-end Whites with low-end Blacks, you compare a relatively lower percentile of White with a relatively higher percentile of Black, and due to regression to the mean, the highest percentile of Whites is that much further above the highest percentile of Blacks, potentially explaining why data like Sailer’s looks so extreme at the far right tail. If more data were modeled with that much differentiation, it would probably look similarly extreme, but data is usually binned pretty broadly.
Sleep Deprivation and Chicken Breeding
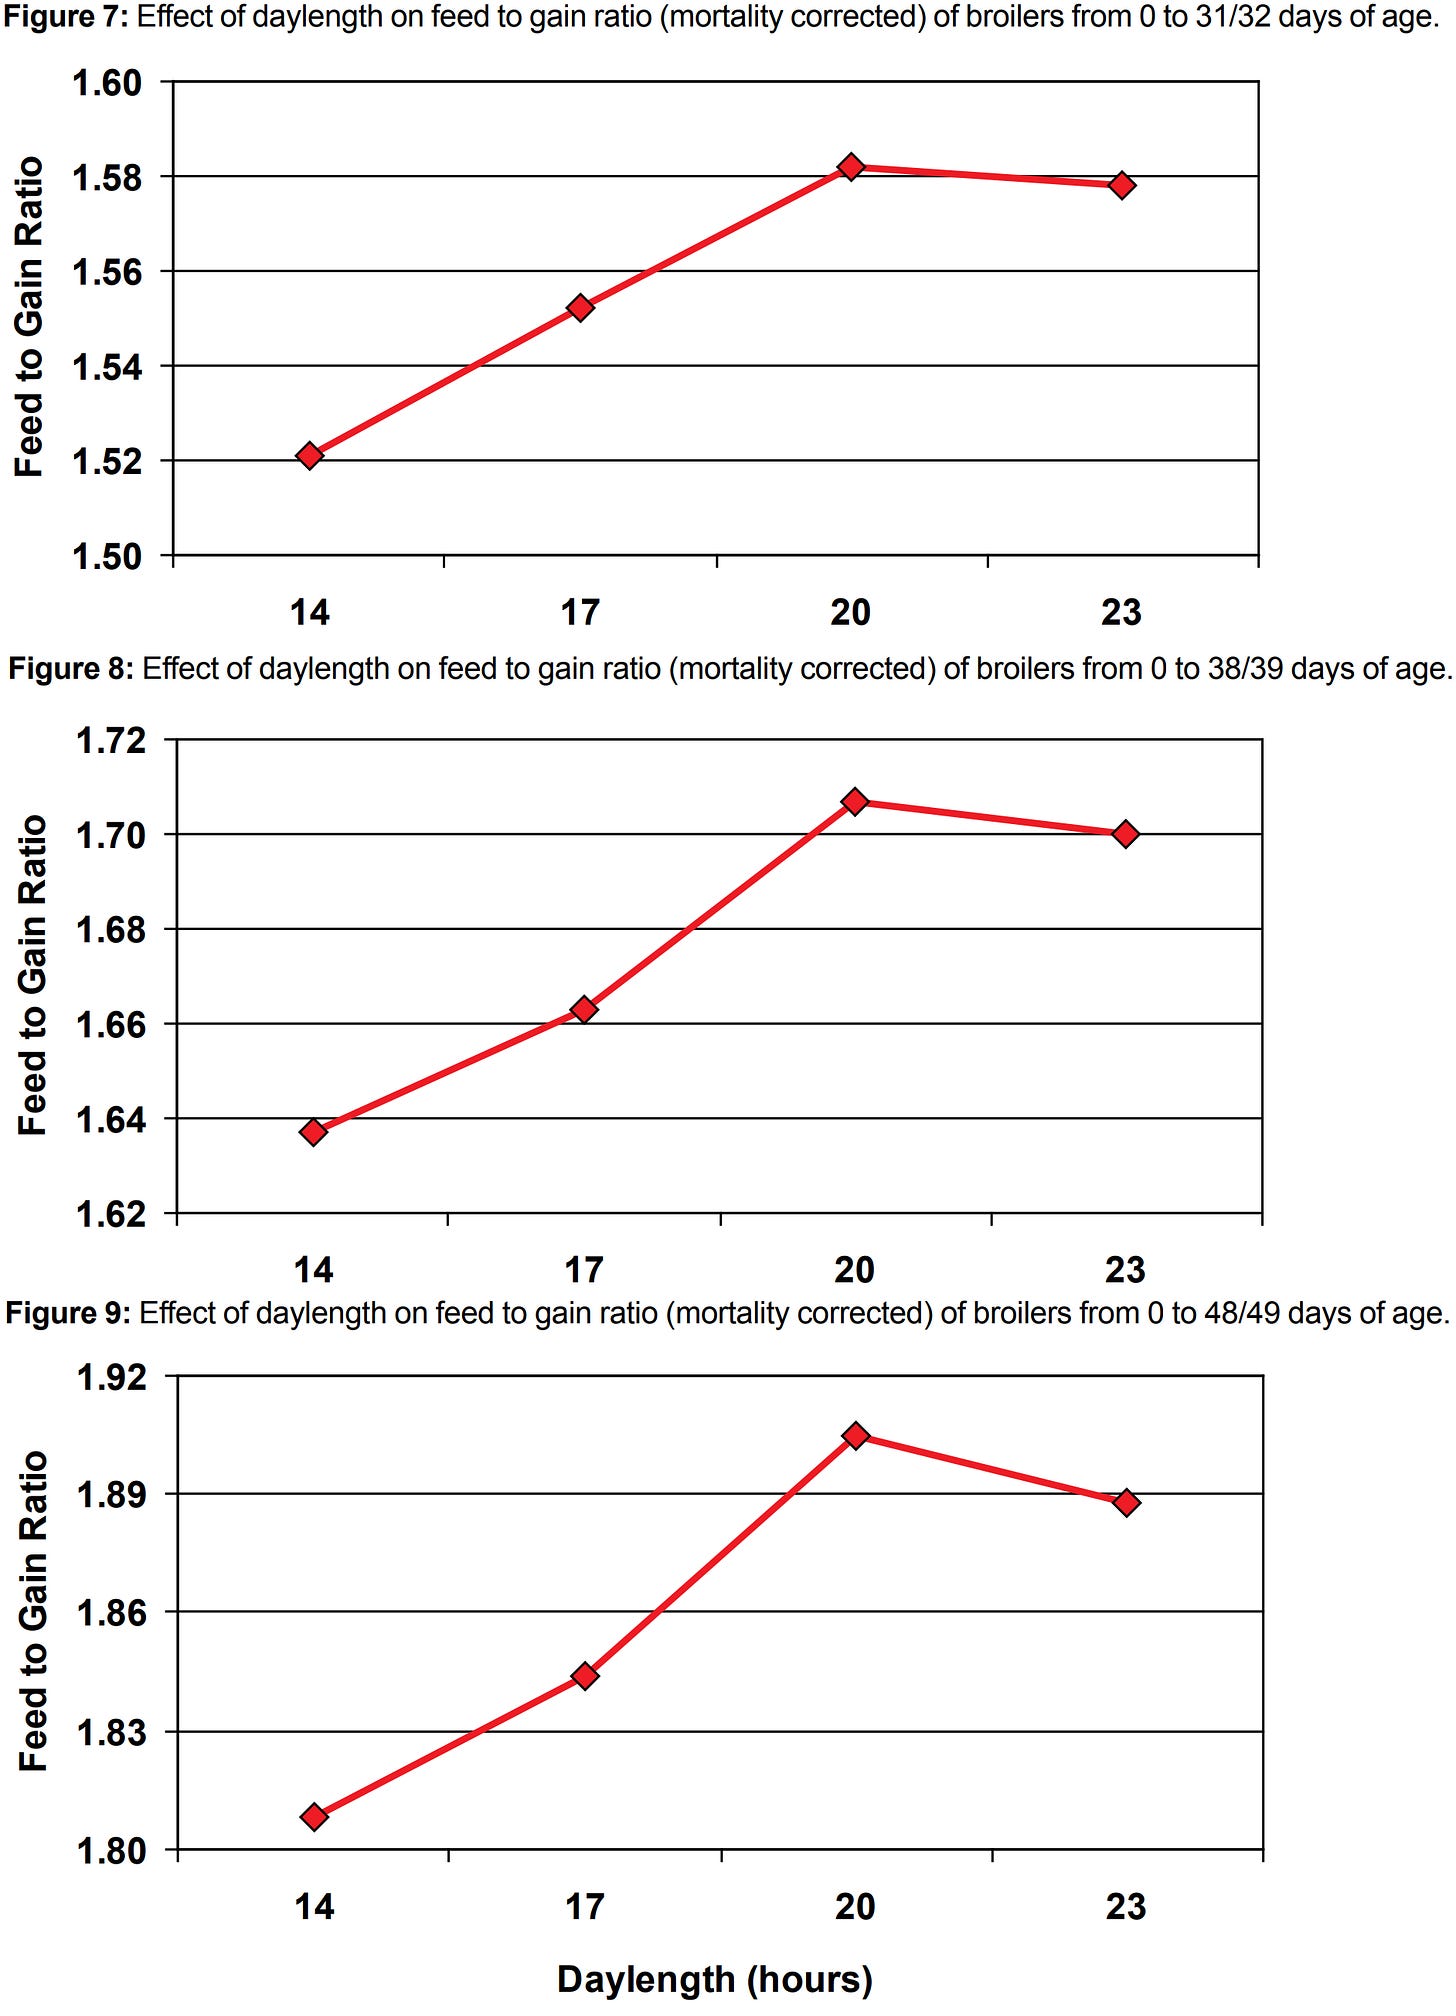
Aviagen’s report on lighting for broiler chickens is full of interesting facts. Their testing of the effect of different lighting regimes on quantities like feed efficiency, carcass weight, and animal welfare led them to argue that the industry standard practice of providing broiler chickens with 23 hours of light each day was harmful, and they instead recommend between 17 and 20 hours. The reasons they gave included improved broiler welfare and feed efficiency, greater growth rates, and reduced mortality. The graphs really are fascinating.
With the move from 23 hours to 20, body weight improves.
As does feed efficiency.
And mortality, though there are some nonlinearities with age
And yields improve
But notice the difference with left drum meat yield. It looks like with more sleep, the body preferentially grows the legs rather than the body, resulting in much reduced mortality due to leg weakness.
And the linear improvement in left drum meat yield doesn’t seem to be wholly attributable to activity differences
The proportions of time spent feeding, dustbathing, preening, stretching, and foraging also varied nonlinearly with daylength. But perhaps the coolest finding was that chickens with greater daylengths had larger eyes, but only going from 20 to 23 hours of light.
Overall, this is a very interesting report that justifies making broiler chicken lives a bit better by giving them a few more hours of night time every day.
The Independent Development of Personality and Politics
A common theory goes “Political views are heritable because personality influences politics, and personality is heritable for more genetically proximal reasons.” Jonathan Haidt promoted this view in his book The Righteous Mind. Fortunately, we don’t have to take this idea for granted because the implied vertical pleiotropy explanation for political views’ heritability has been tested using longitudinal data. The explanation has been found wanting, and it is actually unlikely that personality explains politics.
First, it is known that political views are heritable (here, here, here), and parental transmission via non-genetic paths is often tenuous and age-related, with mediation by intelligence and given that views become polarized after becoming well-known, popularity also probably plays a major role. Second, personality, intelligence, etc. are also heritable, and with better measurement, often substantially so. Developmental changes in the variance components of each of these things are striking and they all seem to show increased genetic variance when people leave the home.
That sort of evidence alongside twin modeling more generally is key to understanding the developmental interplay of personality and politics. Three papers follow:
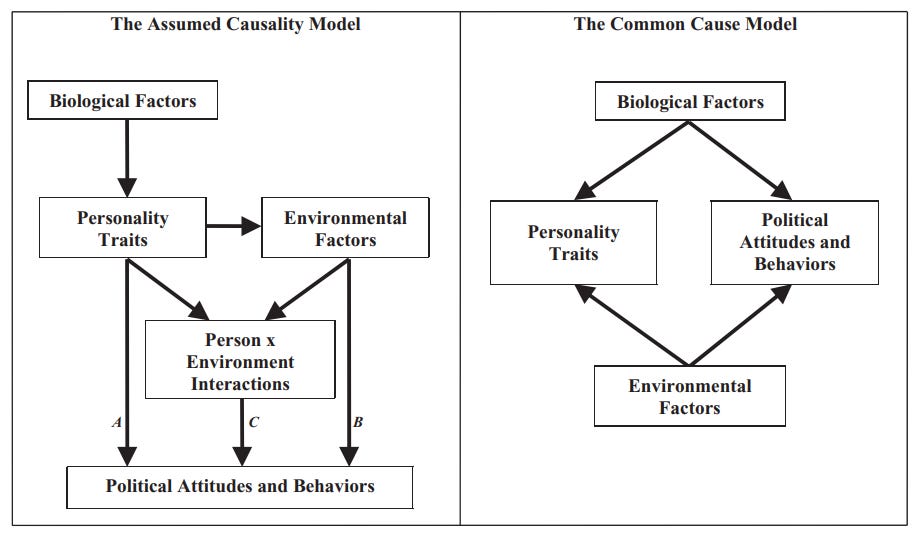
First, Verhulst, Eaves & Hatemi (2011). Using a direction-of-causation twin model (a well-criticized model, to be sure), these models were contrasted:
And the final models were all over the place.
In one model, ideology affected personality. In another, genetic and environmental effects on personality also affected ideology but personality did not directly affect ideology. In yet another, there was reciprocal causation with opposite signs. In the final model, ideology again affected personality. The models that fit best were
Attitudes cause personality
Cholesky (common causes)
Reciprocal causation
Attitudes cause personality
At no point was the model “personality causes attitudes” affirmed, nor was it even close, as that model always had the worst fit.
Second, Hatemi & Verhulst (2015). In longitudinal, genetically-informative path models, the considerable cross-sectional relationships between personality and politics melt away.
We find change in personality over a ten-year period does not predict change in political attitudes, which does not support a causal relationship between personality traits and political attitudes as is frequently assumed. Rather, political attitudes are often more stable than the key personality traits assumed to be predicting them. Finally, the results from our genetic models find that no additional variance is accounted for by the causal pathway from personality traits to political attitudes.
Finally, Bakker, Lelkes & Malka (2021). Three cross-lagged panel models indicated some modest support for political preferences affecting personality. This makes little sense in a world where we assume personality is primal and politics come from it, but it is what it is. Next, by experimentally assigning participants to receive political versus nonpolitical primes, it was observed that the salience of politics led participants to report personalities that were more politically consistent. Moreover, the strength of individual politics was related to the effect of this manipulation.
Overall, the link between personality and politics seems to be mostly noncausal.3
China Really was Pursuing Zero-COVID
The New York Times used the obituaries of Chinese academics to show that China’s zero-COVID policy really was preventing deaths. After the policy was lifted, there was an immediate and severe increase in the number of academics who passed away. The graphs are particularly revealing because many thought China’s lockdowns were ineffective and they were just lying, as they are wont to do. There’s still some chance China told institutions to delay releasing obituaries, but I seriously doubt it. Regardless, even knowing the policy worked, I’m still not sure it was worthwhile.
Blind Hiring and Bias
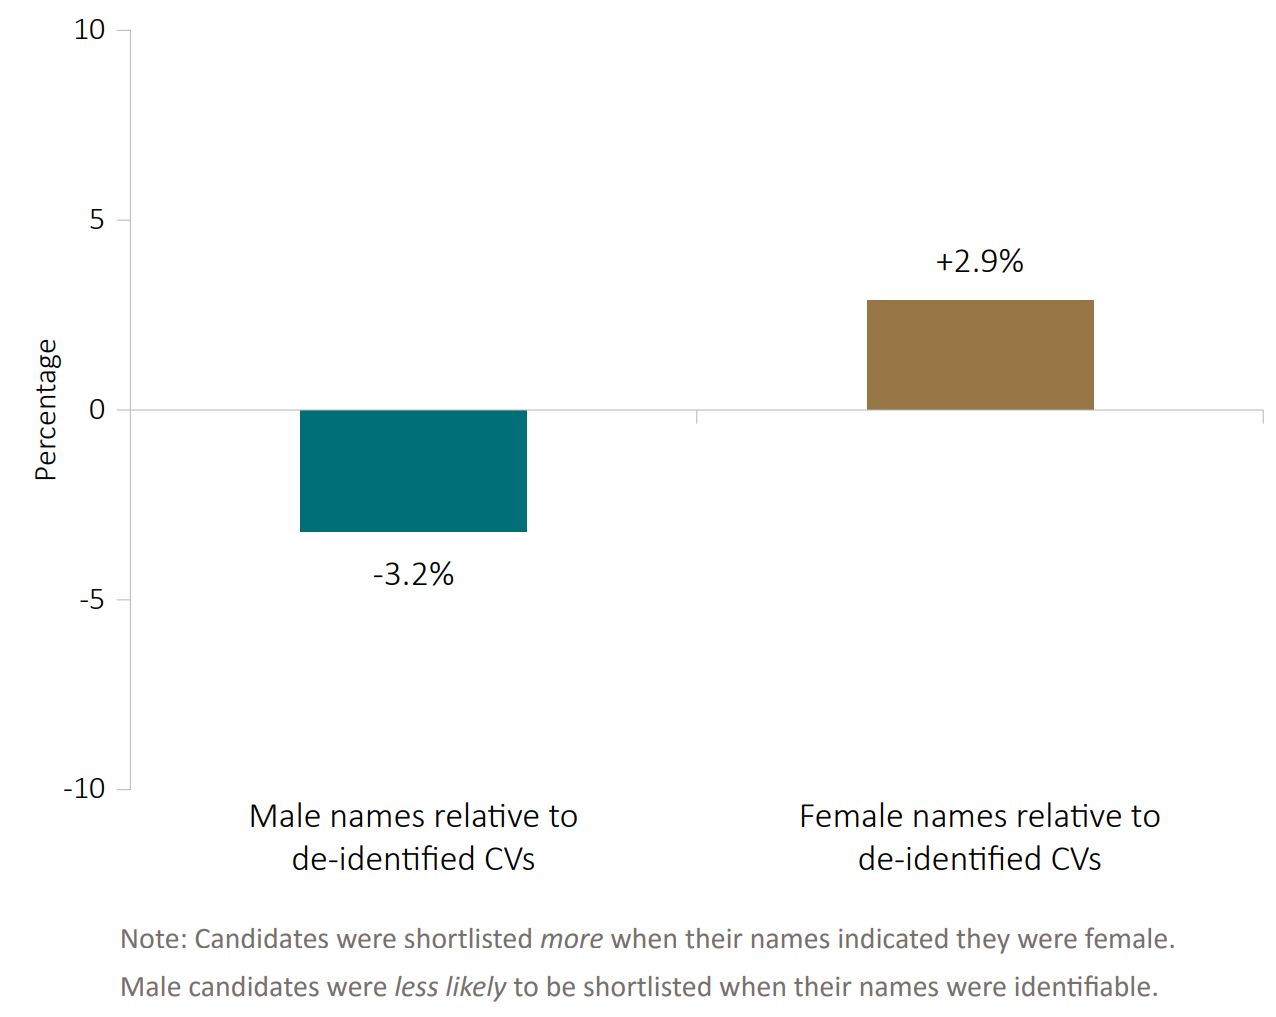
At this point, it should be well-known that there’s a wealth of favoritism in hiring and admissions for non-male, non-White/Asians in the US, the UK, and perhaps all of the Anglosphere at the very least. In 2017, the Australian government ran a blind hiring audit study with the goal being to identify the extent of bias in the public service’s hiring process. The result?
Blind hiring favored men - women were discriminated for.
Blind hiring favored non-Anglos - non-Whites were discriminated for.
And some more tidbits, with my highlights in bold:
Overall, male reviewers displayed markedly more discrimination in favour of minority candidates than female reviewers. Male reviewers were 11.6% more likely to shortlist minority men and 13.6% more likely to shortlist minority females, while female reviewers were only 1.84% more likely to shortlist minority men and 5.5% more likely to short list minority females, compared to the de-identified condition.
APS staff aged 400+ displayed much stronger affirmative action in favour of female minorities than did staff under the age of 40. These reviewers were 10.0% more likely to shortlist minority females, while younger reviewers were only 5.8% more likely to shortlist female minorities, compared to the de-identified condition.
APS staff working in human resources roles apply strong affirmative action in favour of both females and minorities: they were 9.0% more likely to shortlist females and 41.4% more likely to shortlist female minorities, compared to the de-identified condition.
The results from this trial demonstrate that, on the whole, public servants engaged in positive discrimination towards female and minority candidates. De-identification of CVs in such a context has the effect of decreasing the number of female and minority candidates shortlisted for executive level APS positions.
The idea of combatting what people on the left consider to be “racial bias” - that is, unfavorable racial differences in outcomes - has been dead for some time. Really eliminating racial bias in the modern day now has the opposite effect because it removes the prejudice in favor of underperforming groups.
Here’s something related from a recent post by Noah Carl:
Why does the [discrimination] theory predict that minority groups should be underrepresented in [high]-IQ professions? Cognitive ability is negatively correlated with racial prejudice, so high-IQ professions should be dominated by the people least likely to discriminate against them.
Two Mechanisms for Holistic Admissions
The decision for the Harvard Asians case is probably coming out around May - big cases tend to come near the end of the term. Most people think Harvard will lose and universities will condemn merit in favor of “holistic admissions” — code for scouring applicants’ admission materials to figure out their race and then discriminate accordingly. So, how will they do it? Presumably by using letters of recommendation and essays, both of which are highly unreliable and biased by class.
Per Kuncel, Kochevar & Ones (2014), you would need approximately eight letters of recommendations to get a reliability (i.e., interrater agreement) of 0.75. The typical number of letters requested is two to three. For comparison, the SAT has a reliability in excess of 0.90 and the effect of test preparation activities on it is small (and its use today seems to reduce racial differences, if anything), and the effect of retesting asymptotes with testing instances or is less concerning with alternate forms.
The nonlinear relationship between the known-unbiased SAT and essays — which are themselves nonlinearly related to class — implies that there is bias with respect to class for essays. This bias systematically favors higher-class students.
Unlike standardized tests, which have considerable validity that is independent of class, letters of recommendation and essays are poor predictors that are unreliable and biased by race and class. Just think about the effort required for a poor student to obtain multiple prestigious letters of recommendation, let alone to participate on campus and in research positions and the like in the ways they would need to in order to obtain said letters in the first place.
I’ll stick to high validity:
And such a staggering lack of race, sex, and class bias that they beat both teachers and parents:
Germans Love Batteries
Note: Germans, but perhaps not the German government per se.4 Data from Aachen University shows German homes have installed a lot of batteries, presumably to offset the high system costs of solar energy. The extent is pretty incredible, with almost 90% of German home battery storage units and just over 90% of home storage capacity installed after August, 2018. Li-ion units dominate, and home storage dominates large-scale and industrial storage.
Social Media and Teen Mental Health
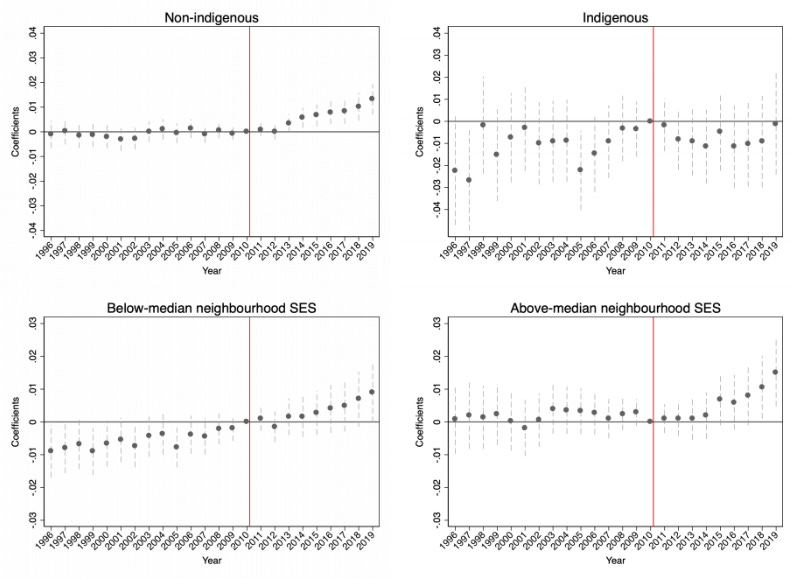
Guo (2022) exploited the timing of broadband coverage expansions in British Columbia to assess the effects of access to social media on teen mental health. The effects were clear. Firstly, broadband expansions led to more social media use:
And secondly, teen girls (and only teen girls) started reporting severe mental health special needs
And these special needs were relegated to only mental health, not intellectual, physical, or learning disabilities, nor chronic conditions.
And the effect seemed to appear regardless of income
but it only affected White girls.
Jonathan Haidt looked at a few more studies on this matter, with two more event study replications. One of these exploited the introduction of Facebook across American college campuses and the other used the spread of fiber optic cabling across Spanish provinces. In the American study, the interaction with femaleness of universities was not significant but range was restricted. In the Spanish study, the effect was again driven by girls.
The Spanish study was particularly revealing, because they showed that fiber penetration led to girls but not boys appearing addicted to the internet, girls but not boys crowding out sleep with internet use, girls but not boys crowding out homework with internet use, girls but not boys crowding out real-life socializing with internet use, and girls but not boys using the internet as a coping mechanism. There were no effects on anxiety, drug abuse, of self-harm and suicide attempts for boys, but there were effects on all of the above for girls, but though significance differed, the differences in the coefficients didn’t differ for boys and girls in most cases.
Overall, it seems there’s good reason to think that teen girls report more mental health issues due to social media. Whether these reports mean there’s really an uptick in mental illness due to social media use is a separate issue though. It may be that girls are more susceptible to trends and this is trendy. Work showing upticks in suicidality and antisocial behavior besides isolation is weaker.
As a final note, here are the demographically broken up results from the latest Youth Risk Behavior Survey wave (2021):
The Broken Link between Conservativism and Age
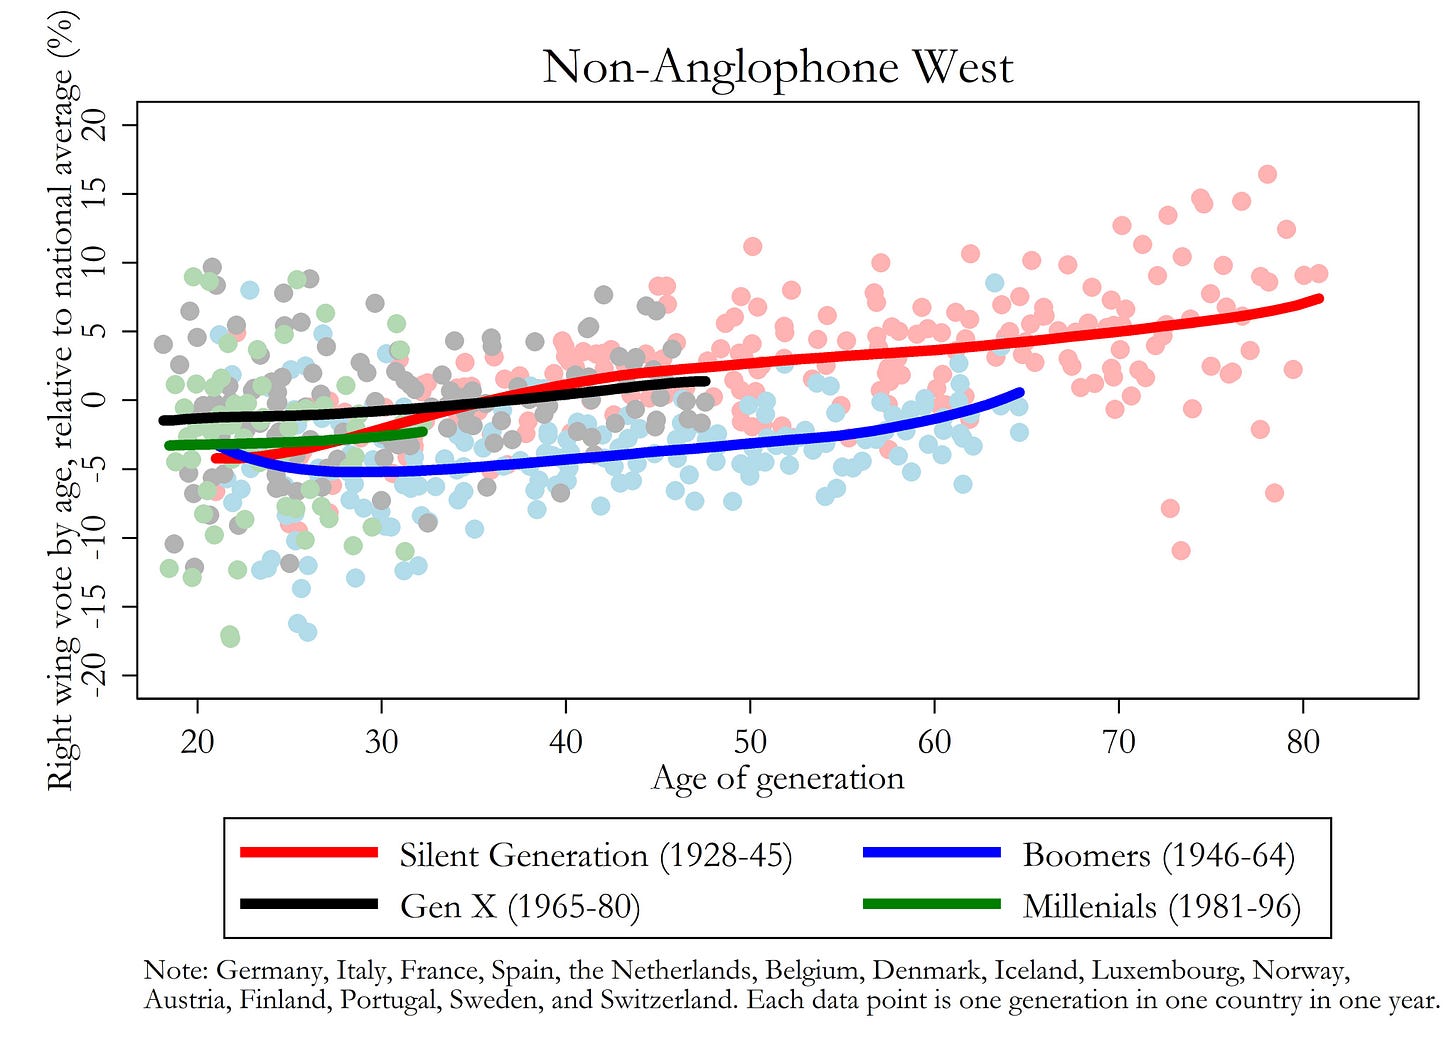
People become more conservative as they age. As the adage goes “If you’re not a socialist in your youth, you have no heart; if you’re still a socialist in adulthood, you have no head.” The Millennial generation is bucking the trend, sticking to voting left and failing to become more conservative with age.
But, this is a phenomenon that’s entirely relegated to the Anglosphere.
No one really seems to have a good explanation yet. Could it be “Wokeness” - the dominance of social views the rest of the world doesn’t (yet) share? Could it be the importance of social views coupled with more strongly multiparty systems to serve them? No one knows, but I can’t wait to hear explanations.
What does the Fed actually say about inequality?
The Fed provides data on the distribution of wealth by percentile since Q3 1989. It’s quite interesting. At the beginning of the series, the top 0.1% held $1.75 trillion in wealth with the next 1% holding $2.89 trillion, followed by $7.62 trillion for the next 10%, $7.39 trillion for the following 40%, and $0.77 trillion for the remaining 50%. As of Q3 2022, those numbers are $16.93 trillion, $24.45 trillion, $50.65 trillion, $38.78 trillion, and finally, $4.52 trillion.
The country has gotten fabulously wealthier over the past 30 years. The USA had 246.8 million people in 1989 and 331.9 million in 2021, so in that time, national wealth increased from $20.42 trillion to $142.16 trillion versus an increase of 85.1 million in population, or a 34.48% increase in population and a 696.18% increase in wealth. But many are quick to notice this and dismiss it with reference to inequality. We have data on that, too:
At the beginning of the series, the top 0.1% held 8.6% of the wealth, with the next 1% holding 14.1%, followed by 37.3% for the next 10%, 36.2% for the next 40%, and 3.8% for the bottom 50%. In Q3 2022, these numbers were 12.5%, 18.1%, 37.4%, 28.7%, and 3.3%. Inequality has gotten a tad worse, but not so much worse that it’s erased the immense gains from growth.
As others have written, though, it’s inequality perceptions that seem to dominate and matter more than inequality realities. This seems true for civil wars, too, as it’s slow growth that seems to matter more for them than inequality-related grievances.
Minding the Productivity and Income Gaps
The Economy 2023 Inquiry decomposed Britain’s income lag with the French, the Germans, and the Americans. The graphs make for great stories. First, the French.
The British have 1% lower mean household incomes and 11% lower median household incomes, because the French are more productive but they work less:
French workers are about 17 per cent more productive than the UK’s, but this translates into a smaller gap in mean household incomes of 1 per cent. The reason for this is that there are about 15 per cent fewer workers per capita in France relative to the UK (due to a more generous retirement age and significantly lower employment levels among those aged under 24). In some senses this higher productivity is “spent” on working less, with more years able to be spent in retirement and education relative to the UK. This phenomenon explains the bulk of the difference in the gap between incomes and productivity between the UK and France.
What about Germany?
The British have 13% lower mean household incomes and 27% lower median household incomes because the Germans are more productive, with some offsetting factors that make the gap very much like the one for productivity. Germans are more productive per hour worked, but they work fewer hours, but more of them work, but their households are smaller, but they have a higher national income, but households take home less of it due to higher corporate shares and net taxes, but Germany also gains 9% due to things like being a major creditor. Overall, this is strangely balanced contrasts.
Finally, the Americans. No one is as rich as America, and it shows.
The gap here is staggering: the mean household income for Americans is 67% greater, and the median is 63% greater. That mean-median gap is representative of just how little differences in inequality between Britain and the U.S. matter. So why are Americans so much richer? The productivity gap is the same as it is with the French - Americans are 17% more productive. But Americans don’t trade off productivity for sleep. Americans have vastly better prices that explain a whole 12% of the gap, they work more per worker, they have larger households and a much larger share of income going to households rather than taxes and corporations, and then there’s a small residual. Britain’s marginally greater work participation hardly makes a dent.
Their failure to keep up with their peers may explain why they seem to be constantly embroiled in controversies over politicians’ petty cash. Or maybe it’s ignorance:
Though I don’t think the British are uniquely ignorant about where the government spends money, so I doubt this latter explanation. Maybe it’s a cultural thing. Regardless, there stands Britain - in poverty.
Rail Deregulation Worked
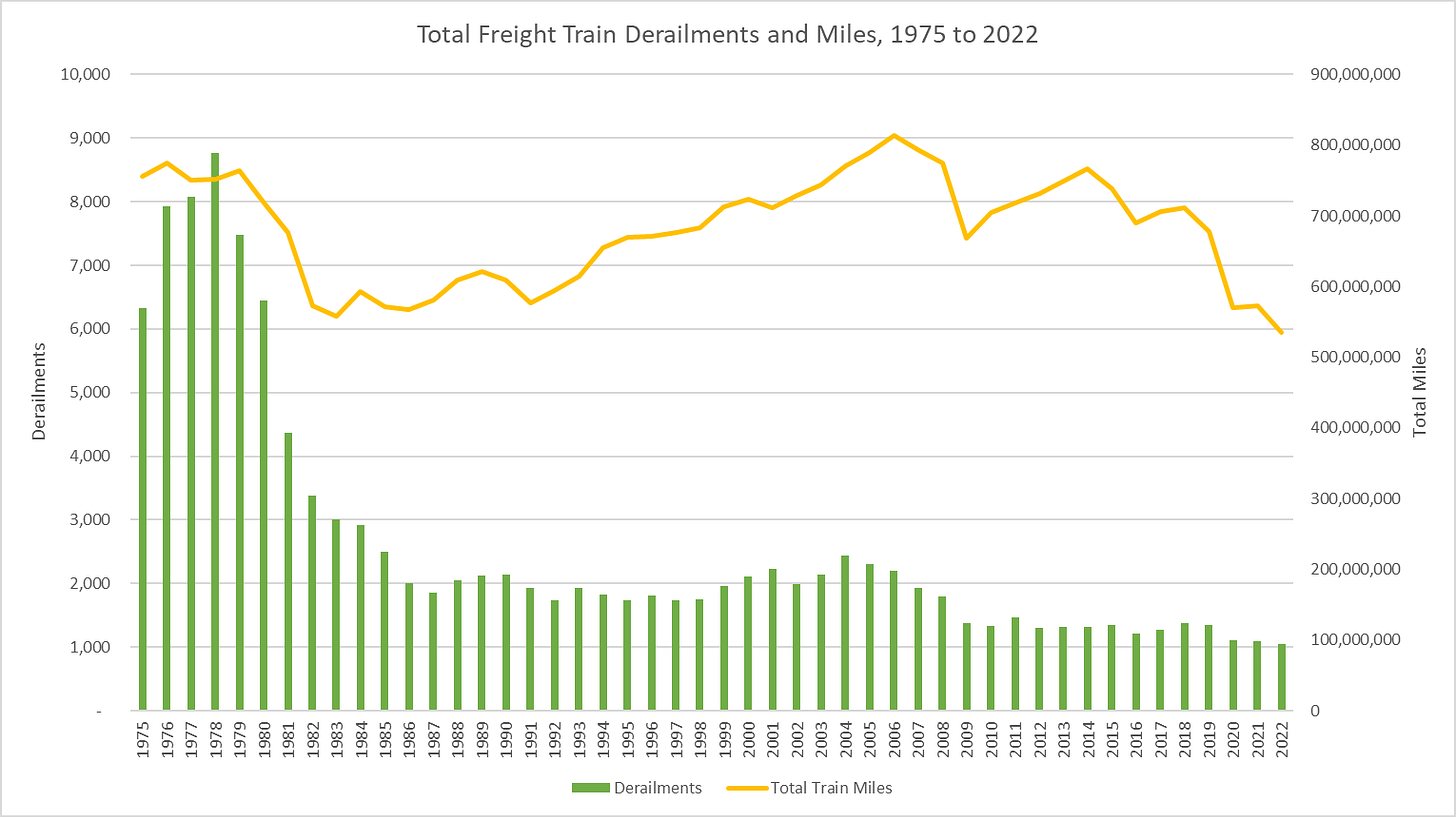
Jimmy Carter is in hospice as of this week. The American public largely considers him to have been a bad president in office, but a great person out of office. The blame he gets for the poor conditions of his presidency is tough to hear because he was responsible for so much of the good that happened under Reagan, from appointing the Fed chair who fixed stagflation, to deregulating the airlines, rails, and trucks, and even brokering the Iranian hostage situation.
Data from the Federal Railroad Administration Office of Safety Analysis indicates that deregulation also greatly reduced the number of train derailments.
Accidents including derailments and railway injuries have also fallen:
Chalk up another win for ole Jim.
Dating Liabilities and Where we Meet
This is a twofer. First, the American Perspectives Survey asked college-educated women and women who had only high school experience or less whether they would be likely to date people with a few different characteristics. The results all make sense, with college-educated women being generally more discriminating about things like cigarette smoking, employment, and religiosity. But, there’s a flip when it comes to the question of whether a potential partner being a feminist would reduce the odds of dating them. As it turns out, nearly half of non-college-educated women would be less likely to date a person who described themselves as a feminist.
In the same survey, women reported greater trouble finding someone who met their expectations in a partner, and this was worse for both sexes among the college-educated:
Women’s greater frustration matches up with a recent study that used Tinder to show that men don’t really have educational preferences for women, but women do have educational preferences for men. Men were also not intimidated by women’s education. Given that women are now more educated than men, it’s going to be hard to be satisfied if the expectation is equality or greater.
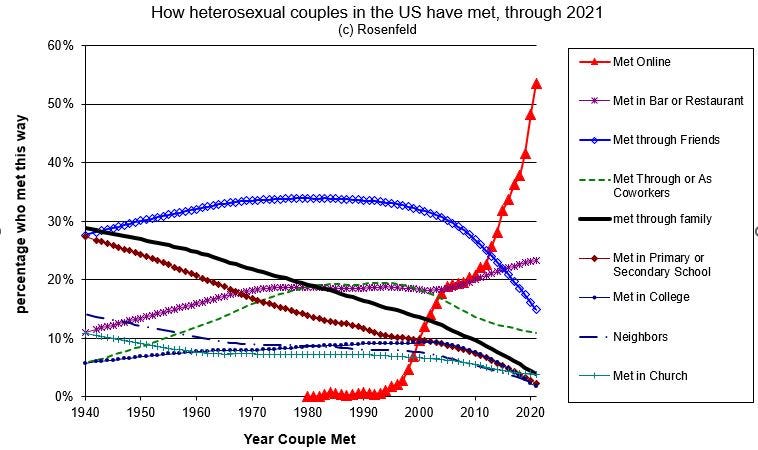
Here’s the second part: Rosenfeld’s now-famous graph of how couples meet has been updated through 2021.
Now even more couples - greater than 50% - met online. And the online number is probably even higher than pictured because, as was noted in the original paper on this, the category “Met in Bar or Restaurant” also includes people who met online and then decided to have their first in-person meeting at a bar or restaurant. One wonders if this rise will be maintained post-COVID.5
Rainfall is a Bad Instrument
Jon Mellon’s preprint on exclusion restriction violations with the rainfall instrument has expanded from 137 to 176 to 192 examples since he first posted about it in late-2020. The gist of the research is that the literature using rainfall as an instrument is so vast that it has tied together multiple papers in a way that violates the assumptions underlying the use of rainfall as an instrument. Accordingly, there are probably a lot of invalid rainfall-based papers out there.
Jon also recently posted DAGs for situations where “another study using the same instrument (W) as you doesn’t imply an exclusion restriction violation.”
While I’m plugging his work, I might as well plug another preprint he put out. This preprint used data from 104 interelection panel surveys across 18 different countries to provide evidence that electoral change is primarily driven not by population replacement (change in actual electorate composition demographically; at least between individual elections) or turnout switching (changing composition among who shows up to vote), but by party switching (people who supported the party in power changed who they support). The paper includes a bunch of pretty graphs and exercises summarized in this thread, but these graphs are the kickers:
The Global Plastics Chart
Wealth lets you have the liberty of protecting your environment and making further growth a bit harder, but at the same time, cleaner. Here’s something people probably already know: the biggest plastic polluters are poor countries.
De Tocqueville and the Police
Fewer people are shot and killed by the police today than in the 1970s. The degree of this is really staggering given how prominent police violence is in the news. It’s hard to imagine given the headlines, but the decline seems to be on the order of a 69% reduction over the last half-century.
Despite, or perhaps, because, of this, there has been a steady decrease in the public’s tolerance for police violence. Here’s one of the graphs:
This sounds like a classic Tocqueville effect. As a reminder, de Tocqueville’s eponymous effect was given its name due to these passages from his books Democracy in America and The Old Regime and the Revolution:
The hatred that men bear to privilege increases in proportion as privileges become fewer and less considerable, so that democratic passions would seem to burn most fiercely just when they have least fuel. I have already given the reason for this phenomenon. When all conditions are unequal, no inequality is so great as to offend the eye, whereas the slightest dissimilarity is odious in the midst of general uniformity; the more complete this uniformity is, the more insupportable the sight of such a difference becomes. Hence it is natural that the love of equality should constantly increase together with equality itself, and that it should grow by what it feeds on.
and
The regime that a revolution destroys is almost always better than the one that immediately preceded it, and experience teaches that the most dangerous time for a bad government is usually when it begins to reform.
But maybe this is compositional, like the de Tocqueville effect in individuals’ color perceptions.
Construction Takes Place where it’s Least Efficient
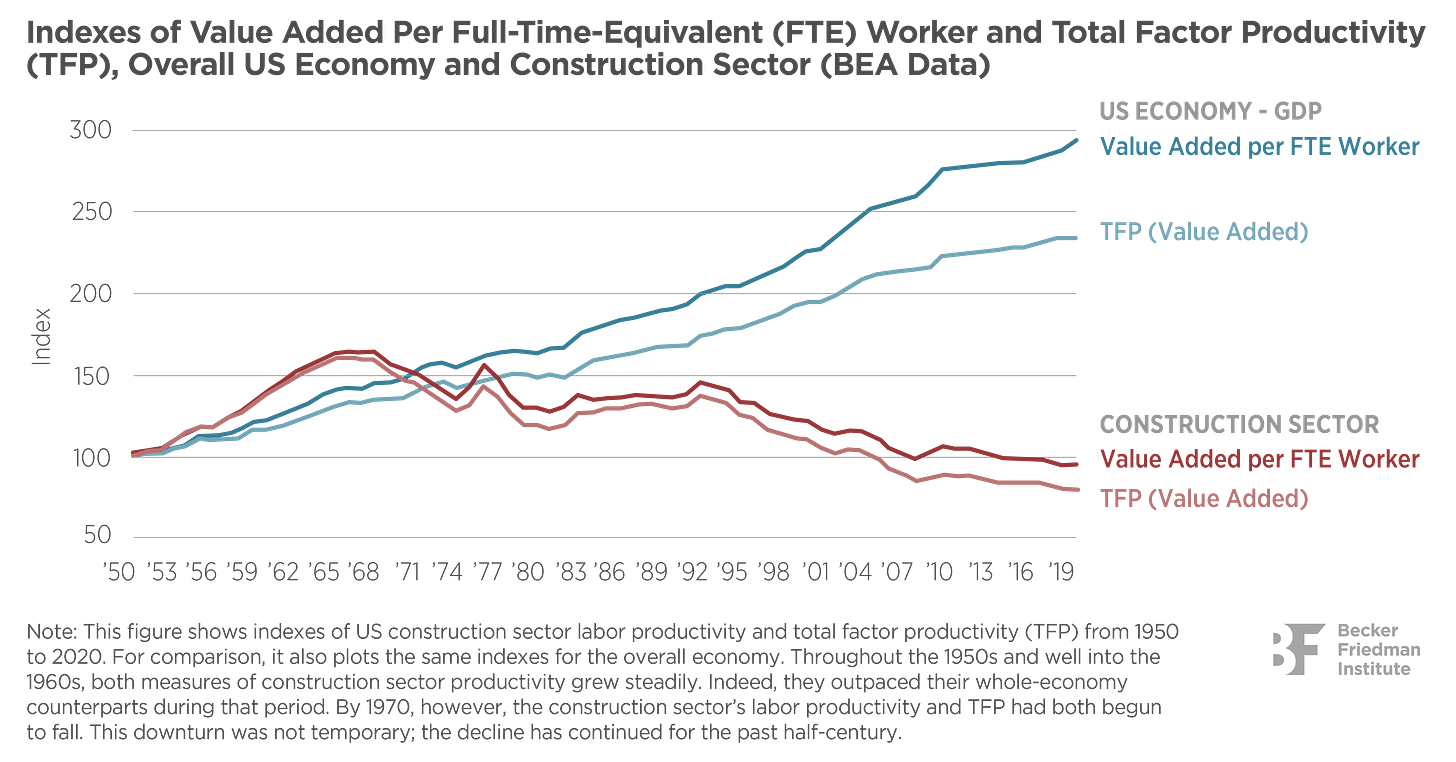
Construction productivity in the U.S. has decoupled from productivity growth more generally.
What’s more, this development sounds similar to what’s happened for megaprojects and nuclear, where it’s likely tied to regulation, and in this case, zoning regulations in particular. There’s something unique here though:
First, they find that the construction sector’s ability to transform intermediate goods into finished products has deteriorated. And second, the authors describe the curious fact that producers located in more-productive areas do not grow at expected rates. Indeed, rather than construction inputs flowing to areas where they are more productive, the activity share of these areas either stagnates or even falls. The authors suggest that this problem with allocative efficiency may accentuate the aggregate productivity problem for the industry.
This matters a lot. The gains available to us from potential construction are huge.
Higher Land Value Taxation, Lower Home Prices
In this now well-known paper on the Danish implementation of land value taxation (LVT), a particular chart is often lost in the hubbub about how the tax is fully capitalized into the land. A prediction LVT advocates know and have discussed in the past (like when discussing Philadelphia’s experience using two rates) is that a higher LVT implies less extreme prices for new housing because it hampers speculation in land. This graph supports it - houses cost less when you tax the land they’ll be built on more:
and here are the numbers:
In this case, the tax rate differences weren’t even very large, so the potential left on the table may be very large.
And that’s it for Brief Data Post II.
“One of the strongest empirical associations in the criminological literature is between offending and victimization.”
Notably, victim-offender overlap is also part of why the use of victim DNA from rape kits is so useful, and it probably contributes to the degree to which it keeps making the news (example).
And as noted, these incidents tended to be of a more serious nature.
The possibility that these results, or at the very least, the experimental ones, are explained by measurement invariance violations is on the table as well. Such biasing effects may obscure reality and could have fooled the field’s researchers into interesting but wrong conclusions. If this isn’t the case, then there’s stronger evidence for politics causing personality than the reverse.
Subsidies and build requirements may prove otherwise.


















>this is a phenomenon that’s entirely relegated to the Anglosphere.
You sure it's not just high IQ countries in general? There's evidence that parenthood almost entirely accounts for the relationship between age and conservatism; experimentally inducing a parental mindset also boosts conservative thinking:
https://royalsocietypublishing.org/doi/10.1098/rspb.2022.0978
I interpret this as more support for notions of conservatism as 'instinctual thinking' explaining things like political gaps in traits like racism and IQ.
Here's another study exploiting timing differences in the rollout of broadband, this time with the british housing panel study, and this time more of a focus on various 'social capital' measures:
http://repec.econ.muni.cz/mub/wpaper/working%20papers/WP201801MUNIeconPAPER.pdf
There's also some evidence of network effects, where banning individual teenagers from social media use doesn't produce expected positive effects since everyone else is still online:
https://twitter.com/Chris_Said/status/1498279379083870211
May soon also be possible to see if China's new policies have any success given that they're gonna be a nation-wide thing. Tho prob not worth limiting the productivity of the talented male minority.