

Today’s post is brought to you by my sponsor, Mechanize. They’re hiring junior software engineers at $300K/year base salary.
I recently attended a longevity conference in Kobe, Japan. One of the presenters gave a talk about my least-favorite topic in the field: longevity clocks.
Longevity clocks—also known as “aging clocks” or “biological clocks”—are algorithms to estimate a person’s biological age. The idea is that biological age is conceptually and—hopefully—empirically distinct from a person’s chronological age. You might’ve seen attempts at measuring this if you use wearables like the WHOOP bracelet, Oura ring, or Apple Watch. The biological aging measures provided by these devices are correlated with various health outcomes and the risk of dying, albeit to widely varying degrees.
What makes longevity clocks so pesky is that it’s unclear if what they’re picking up can even be called ‘biological age’. What biological age appears to be is more a risk score that’s correlated with chronological age by construction, and which appears to obtain most of its predictive power from that fact. Whether changes in biological age are themselves meaningful or whether they represent as broad a set of changes as change in chronological age does remains unclear.
But let’s digress. There are tons of aging clocks on the market, from immunome clocks like iAge and SImAge, to methylation-based clocks like GrimAge2, to inflammation-based clocks like GlycanAge, to epigenetic clocks intended to track skin aging like VisAgeX. Each of these produces high correlations with a person’s chronological age and purports to offer some ability to independent predict aging, with some even claiming that interventions aimed at aging will—if they succeed—affect the clocks. This really is their main purpose: to be intervention targets, in a field where we don’t have good ways of conceptualizing or measuring aging. It’s unclear how well they fill this role.
Conceptually, longevity clocks are in a confusing position; worse, many of them are poorly constructed—particular the ones based on electronic health record (EHR) data. EHR-based clocks are generally constructed from an ensemble of biomarkers, ranging from responses to questionnaires about depression to cholesterol levels. LinAge2 (HuggingFace) is one such example. It’s constructed from the NHANES dataset, seemingly beats GrimAge2 at risk prediction, and it’s set to be deployed in the hospital system in Singapore. But, it’s not up to the task for many of the reasons others EHR-based clocks aren’t. I’m going to use it as an example.
LinAge2: What the Paper Says
LinAge2 is a clinical aging clock that was revealed in the journal npj Aging in 2025. This clock succeeds the team’s earlier PCAge and LinAge clocks and purports to estimate biological age from routinely-collected health data as opposed to being based on DNA methylation data like most other commonly-used clocks. The underlying data they use consists of about 60 different inputs available in the NHANES dataset, including blood chemistry and count measures, blood pressure and body measurements, urine tests, a few questionnaire items and age.
The inputs to LinAge2 are z-scored and reduced with principal components and a lasso picks components which enter into sex-specific Cox models for 20-year mortality, with 17 components plus age, per sex. The risk score is then converted into years using age’s Cox coefficient. The authors trained this on the NHANES 1999-2000 wave and then tested it on the NHANES 2001-02 wave.
The developers of LinAge2 claim that it offers better prediction than other clinical measures and that it (AUC = 0.868) significantly outperforms other aging clocks like PhenoAge (0.848) and prediction from age itself (0.829). This is impressive because it can mean beating other epigenetic aging clocks on the cheap. The scores from LinAge2 also supposedly track function: lower scores imply faster walking, better cognitive function, and greater independence in daily functioning. Moreover, the scores are supposed to be interpretable and actionable, with components presented as readable health axes that point to specific, targetable risk factors.
LinAge2: The Reality
LinAge2 is just not a very good clock. The validation for LinAge2 is subpar compared to what could be done with other available NHANES data or with other datasets like the Health and Retirement Study (HRS). It was trained on the 1999-2000 NHANES wave and tested on 2001-02, but they could’ve used additional waves. When I looked at those waves (see below), I found that LinAge2 didn’t hold up very well. Moreover, from the training wave to test wave, men’s predicted ages drifted 1.6 years older and women 3.5 years younger, with this strange delta never going away, despite deaths not showing any such gap, implying LinAge2 is a biased ‘year’ measure by sex.
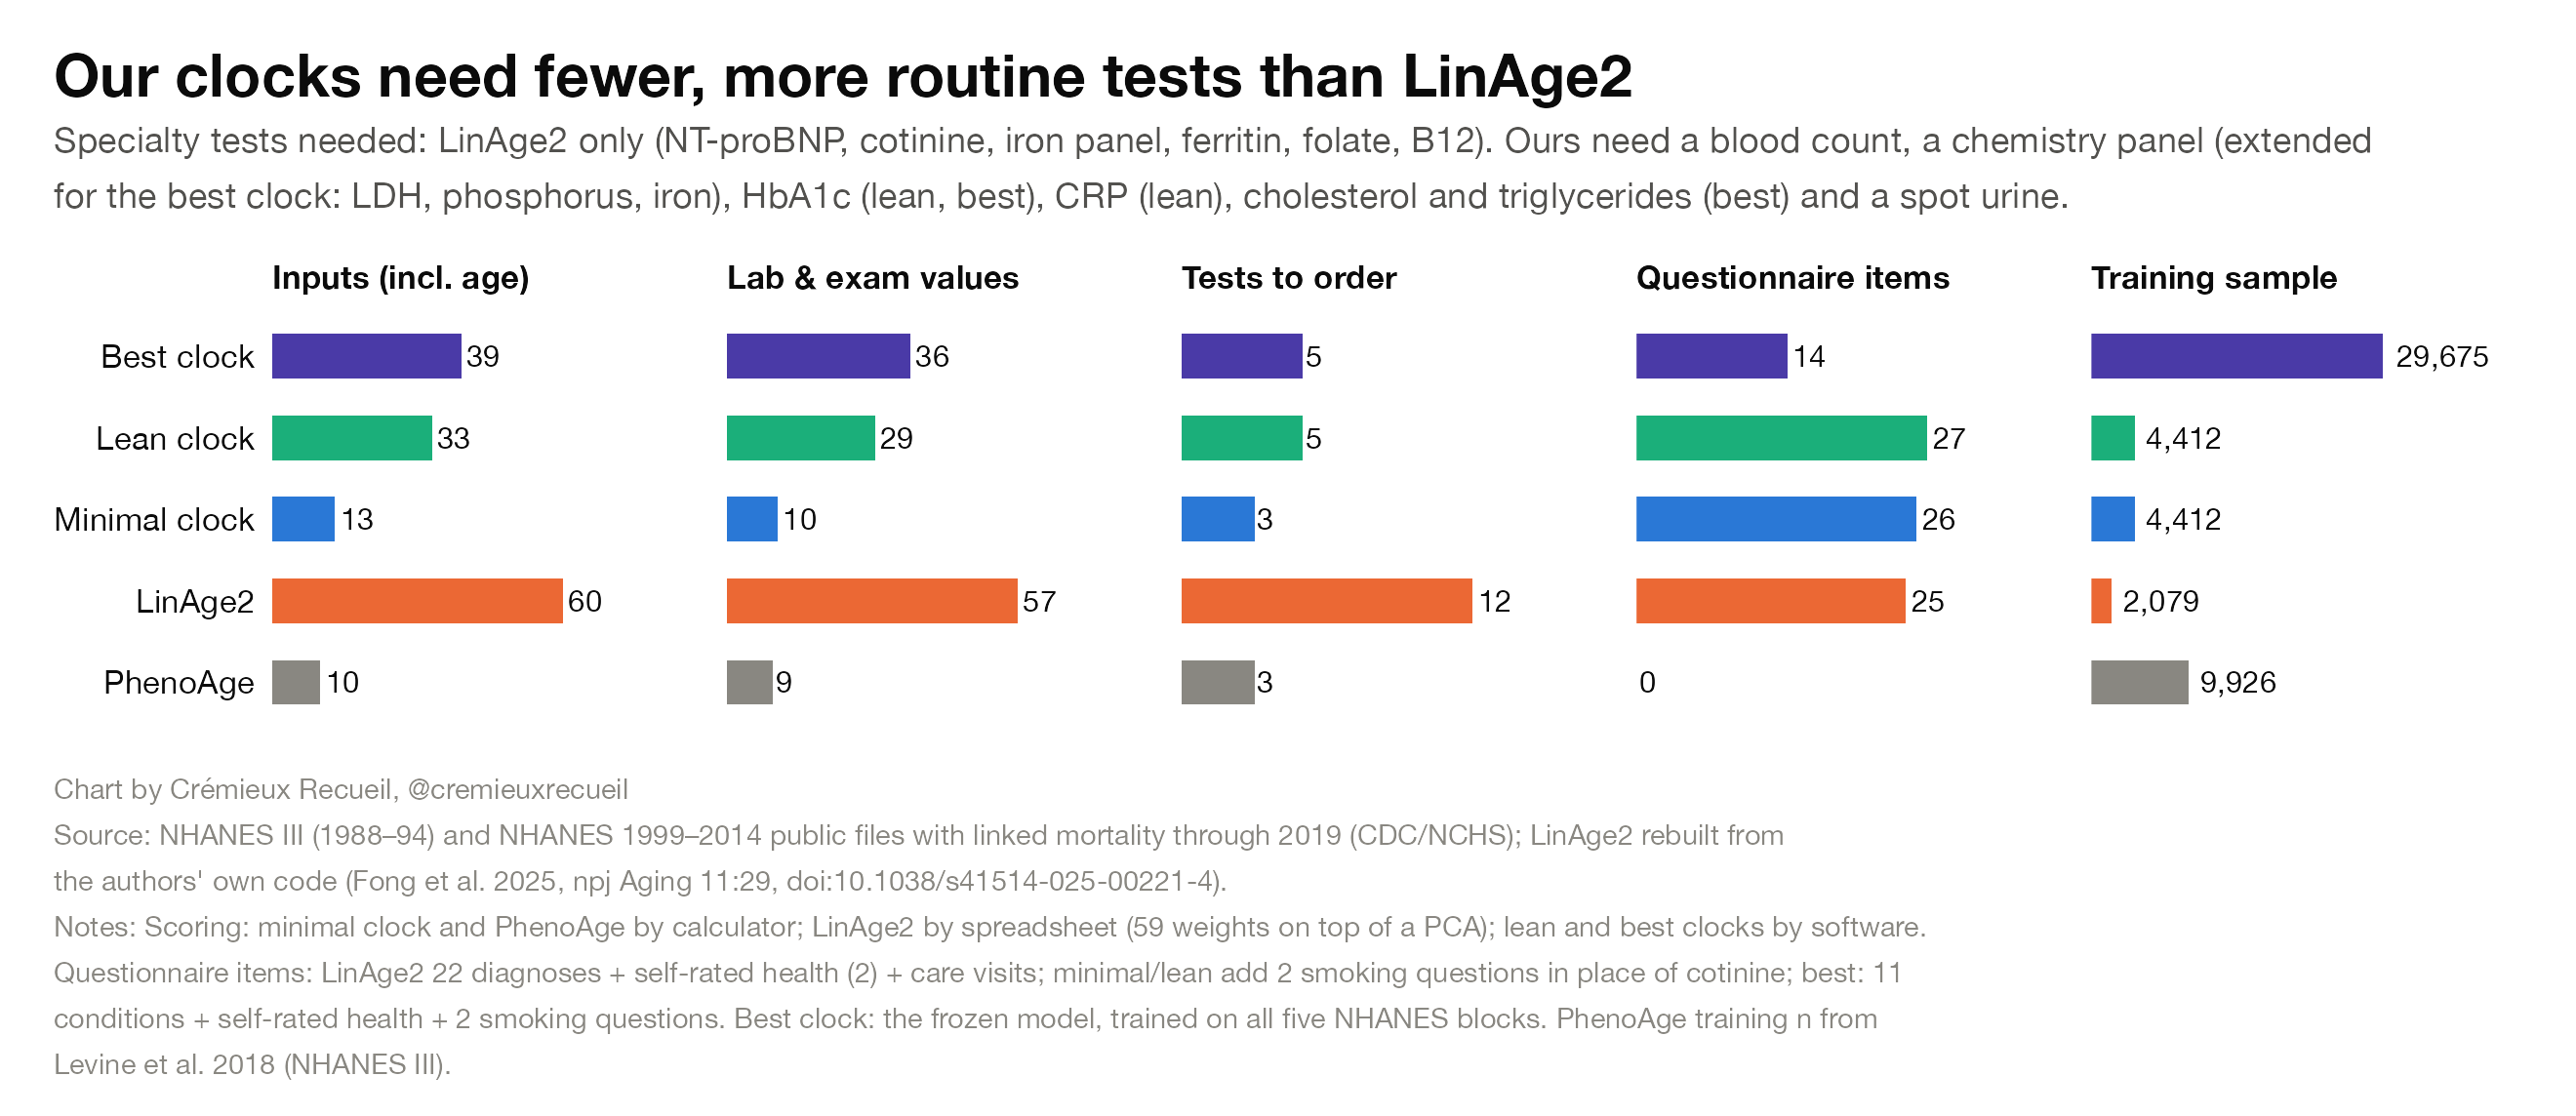
LinAge2 uses a large number of inputs, several of which are quite costly. For example, it calls for the use of specialty tests like NT-proBNP, cotinine, iron studies, ferritin, folate, and B12, wants doctors to gather 25 questionnaire items, and for some of the tests, questions would suffice as substitutes (e.g., cotinine can be replaced by a smoking question). Moreover, the test’s advantages over GrimAge2—which they hyped—were meager (2 AUC points), survive multiple testing correction only if we’re lenient towards LinAge2, and LinAge2 only beats GrimAge2 because of exam, urine, and questionnaire inputs that GrimAge2 could easily stack on top of their existing clock.
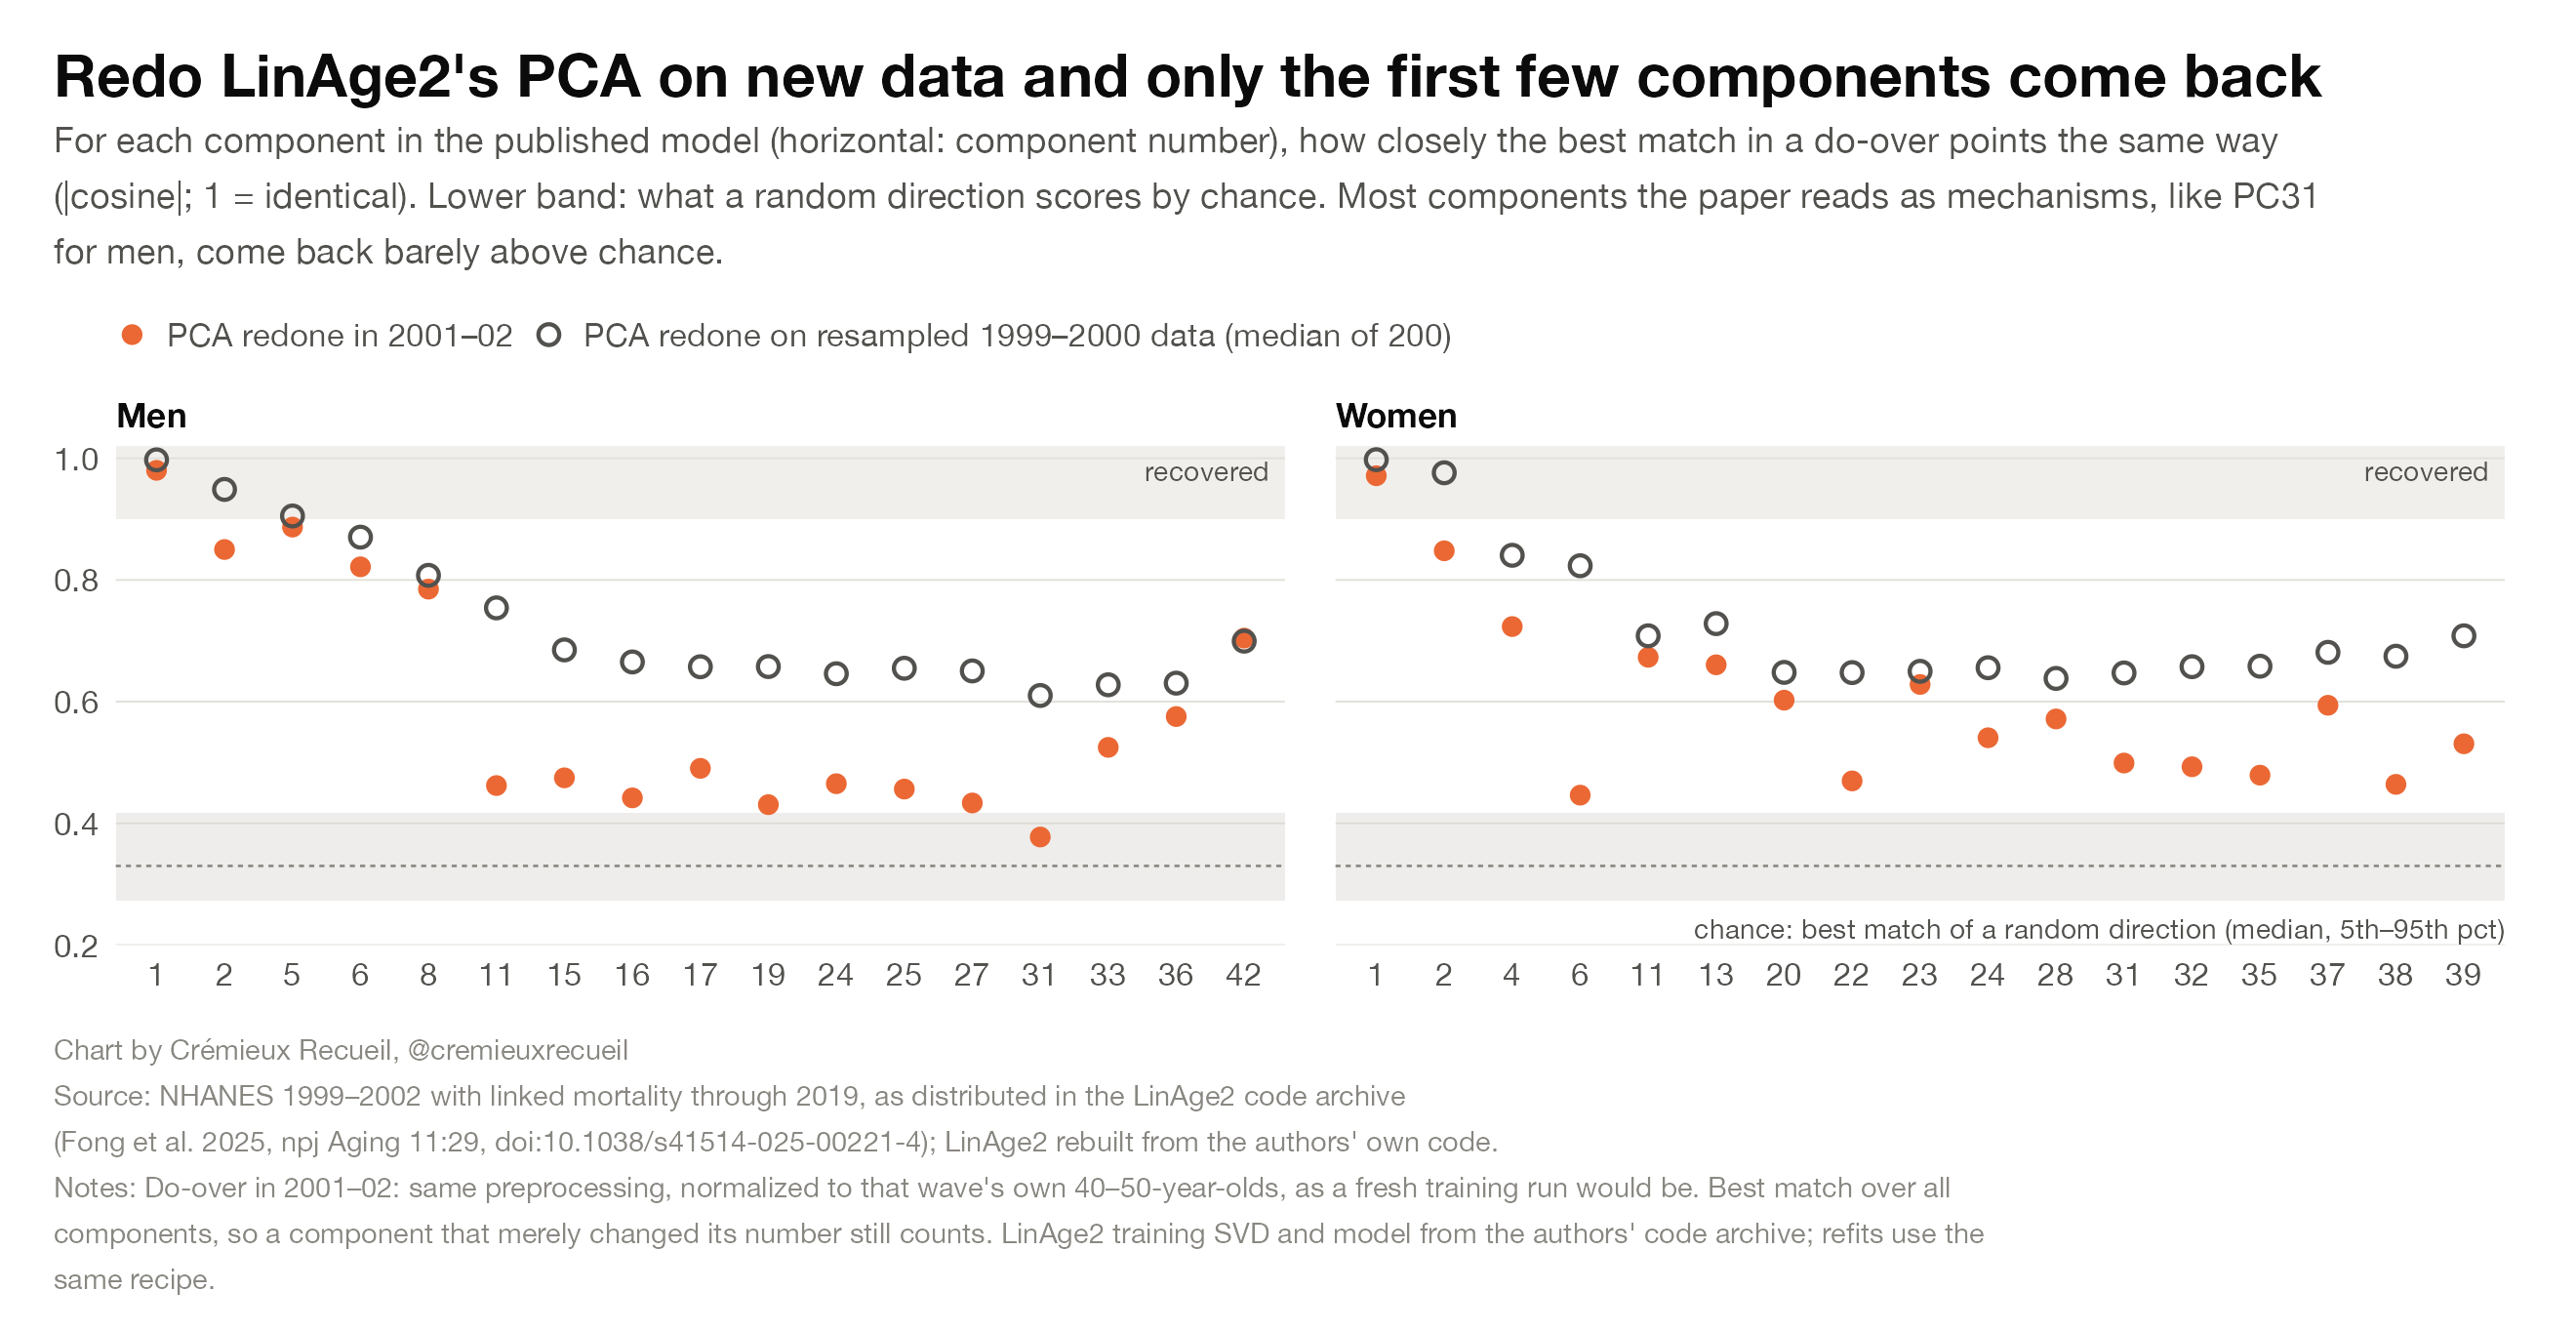
The biggest issue, in my view, is that the supposedly interpretable PCA components are nonsense. PCA is a frequently misused tool, and the components generated by it do not necessarily have any substantive meaning applied to a particular set of measures. Moreover, adding or removing a few measures can generate considerable instability in the weights it assigns. This is especially bad if you’re using a lot of components, because you’re then trying to get blood from a stone as the variance per component declines. Consistent with this, most of the components that go into LinAge2 are not identified. 7-8 per sex are within sampling error of a neighboring component and any rotation of such a pair fits the data equally well. In other words, it’s not clear what these components are, so it’s hardly possible for them to be interpretable!
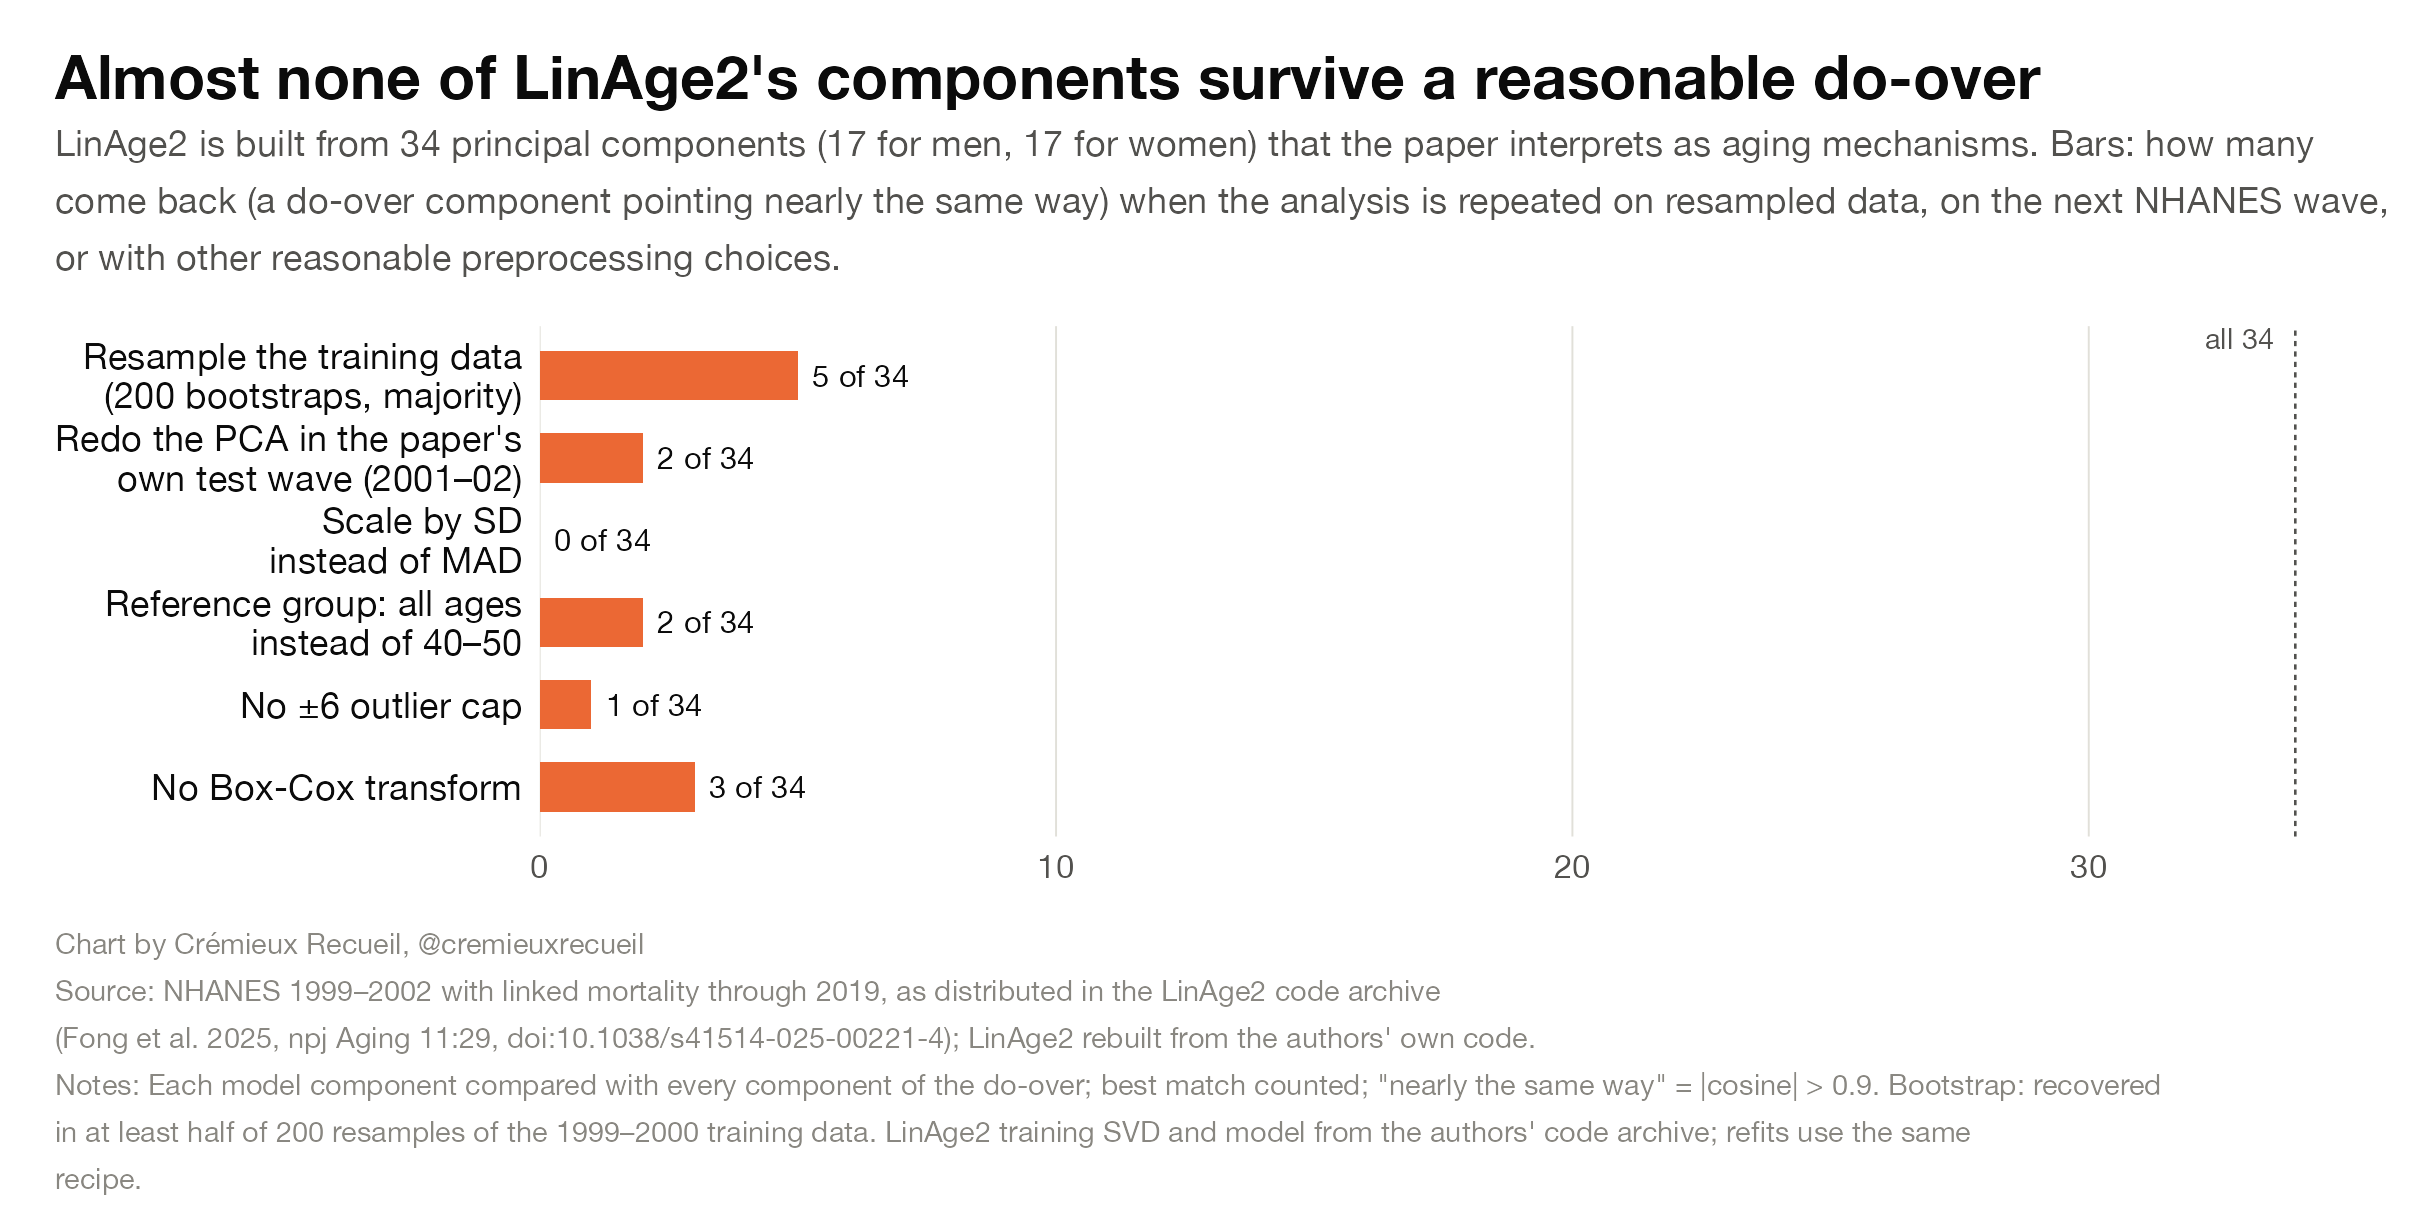
The components also do not reproduce! Redo the PCA in 2001-02 and only the first component comes back, while the rest match the originals at roughly the level of random directions. Furthermore, if you rerun the whole recipe on resampled training data, it picks a median of 16.5 components for men and 24.5 for women against 17 published ones! The overlap for the published set is only 31-36% and only PC1 is chosen in at least 80% of possible reruns. Worse, consistent with how biomarkers in the NHANES often have only moderate reliability, the input weights wobble a bunch and the effective weight on each lab agrees between reruns at 0.6 for men and 0.75 for women, versus 0.97 and 0.93 for a plain lasso on said inputs.
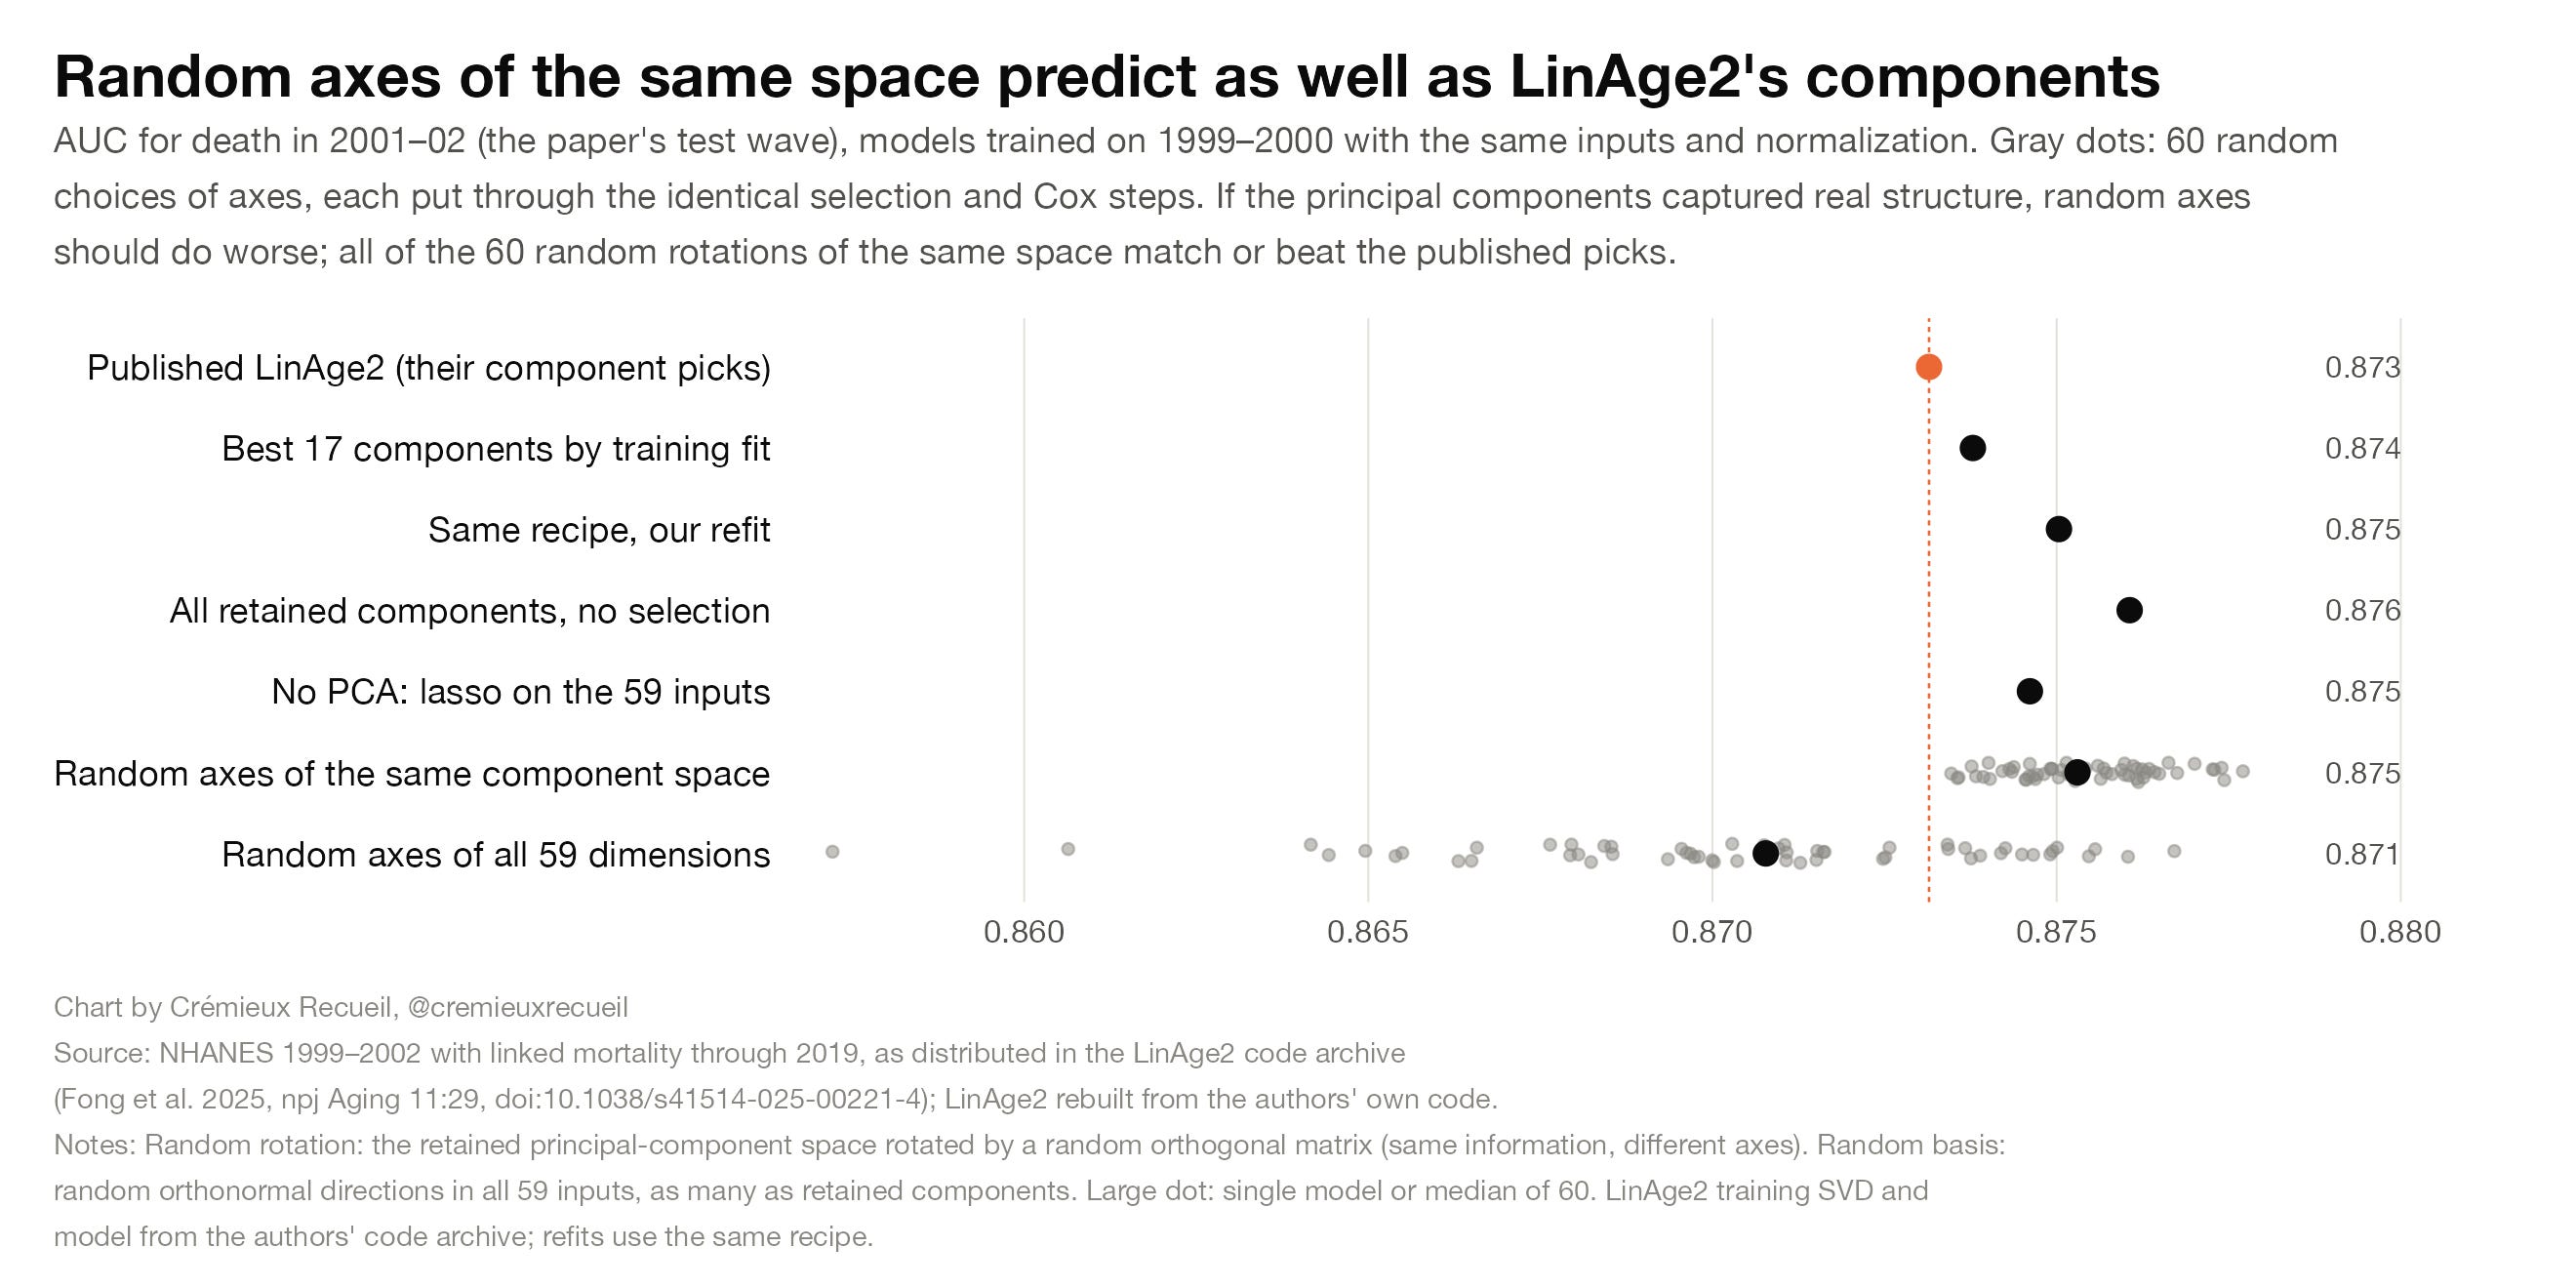
The PCA actually buys these authors nothing! On the paper’s own test wave, 60 random rotations of the component space score at least as well as the published model, and using every component with no selection scores better than their model! Skipping PCA entirely produces the same predictive power. Given that all the clock inputs are linear anyway, the finished clock reduces exactly to a weighted sum of capped inputs per sex, with weights flipping sign nonsensically for calcium, ALP, LDH, CRP, and a few other biomarkers.
To put a pin on it (and there are some other issues I could bring up having to do with comparisons to other clocks that don’t hold in later waves and many subgroups), there are coding errors and misdescriptions afoot with LinAge2. LDL was calculated from triglycerides divided by 5 on mmol/L values when they should be over 2.2. Hospital visits were a categorical code, but they treated it as a count. Thyroid disease didn’t exist in the 2001-02 data, so every case was silently coded as “no”. Creatinine values for 1999-2000 weren’t corrected per the CDC’s guidance (this applies to a few other things, but the effects of this failure to correct weren’t too large). The reference group for LinAge2 was described as “generally healthy”, but the authors’ code didn’t apply a health filter, so they’re just saying things to say things. Now let’s move on.
Beating LinAge2
LinAge2 is extremely easy to beat, despite being a commercialized product. I managed to make a far superior, far more generalizable, far easier-to-use clock in about 15 minutes. This should not have been possible.
I made three clocks: a minimal clock that just uses 14 variables, compared to the nearly 60 for LinAge2; a lean clock that uses a few more, but still fewer than LinAge2; and an optimal clock that gets the best performance possible on the NHANES data available to myself and the LinAge2 team, but which still does so with fewer variables than were used in the creation of LinAge2. Here’s what we had:
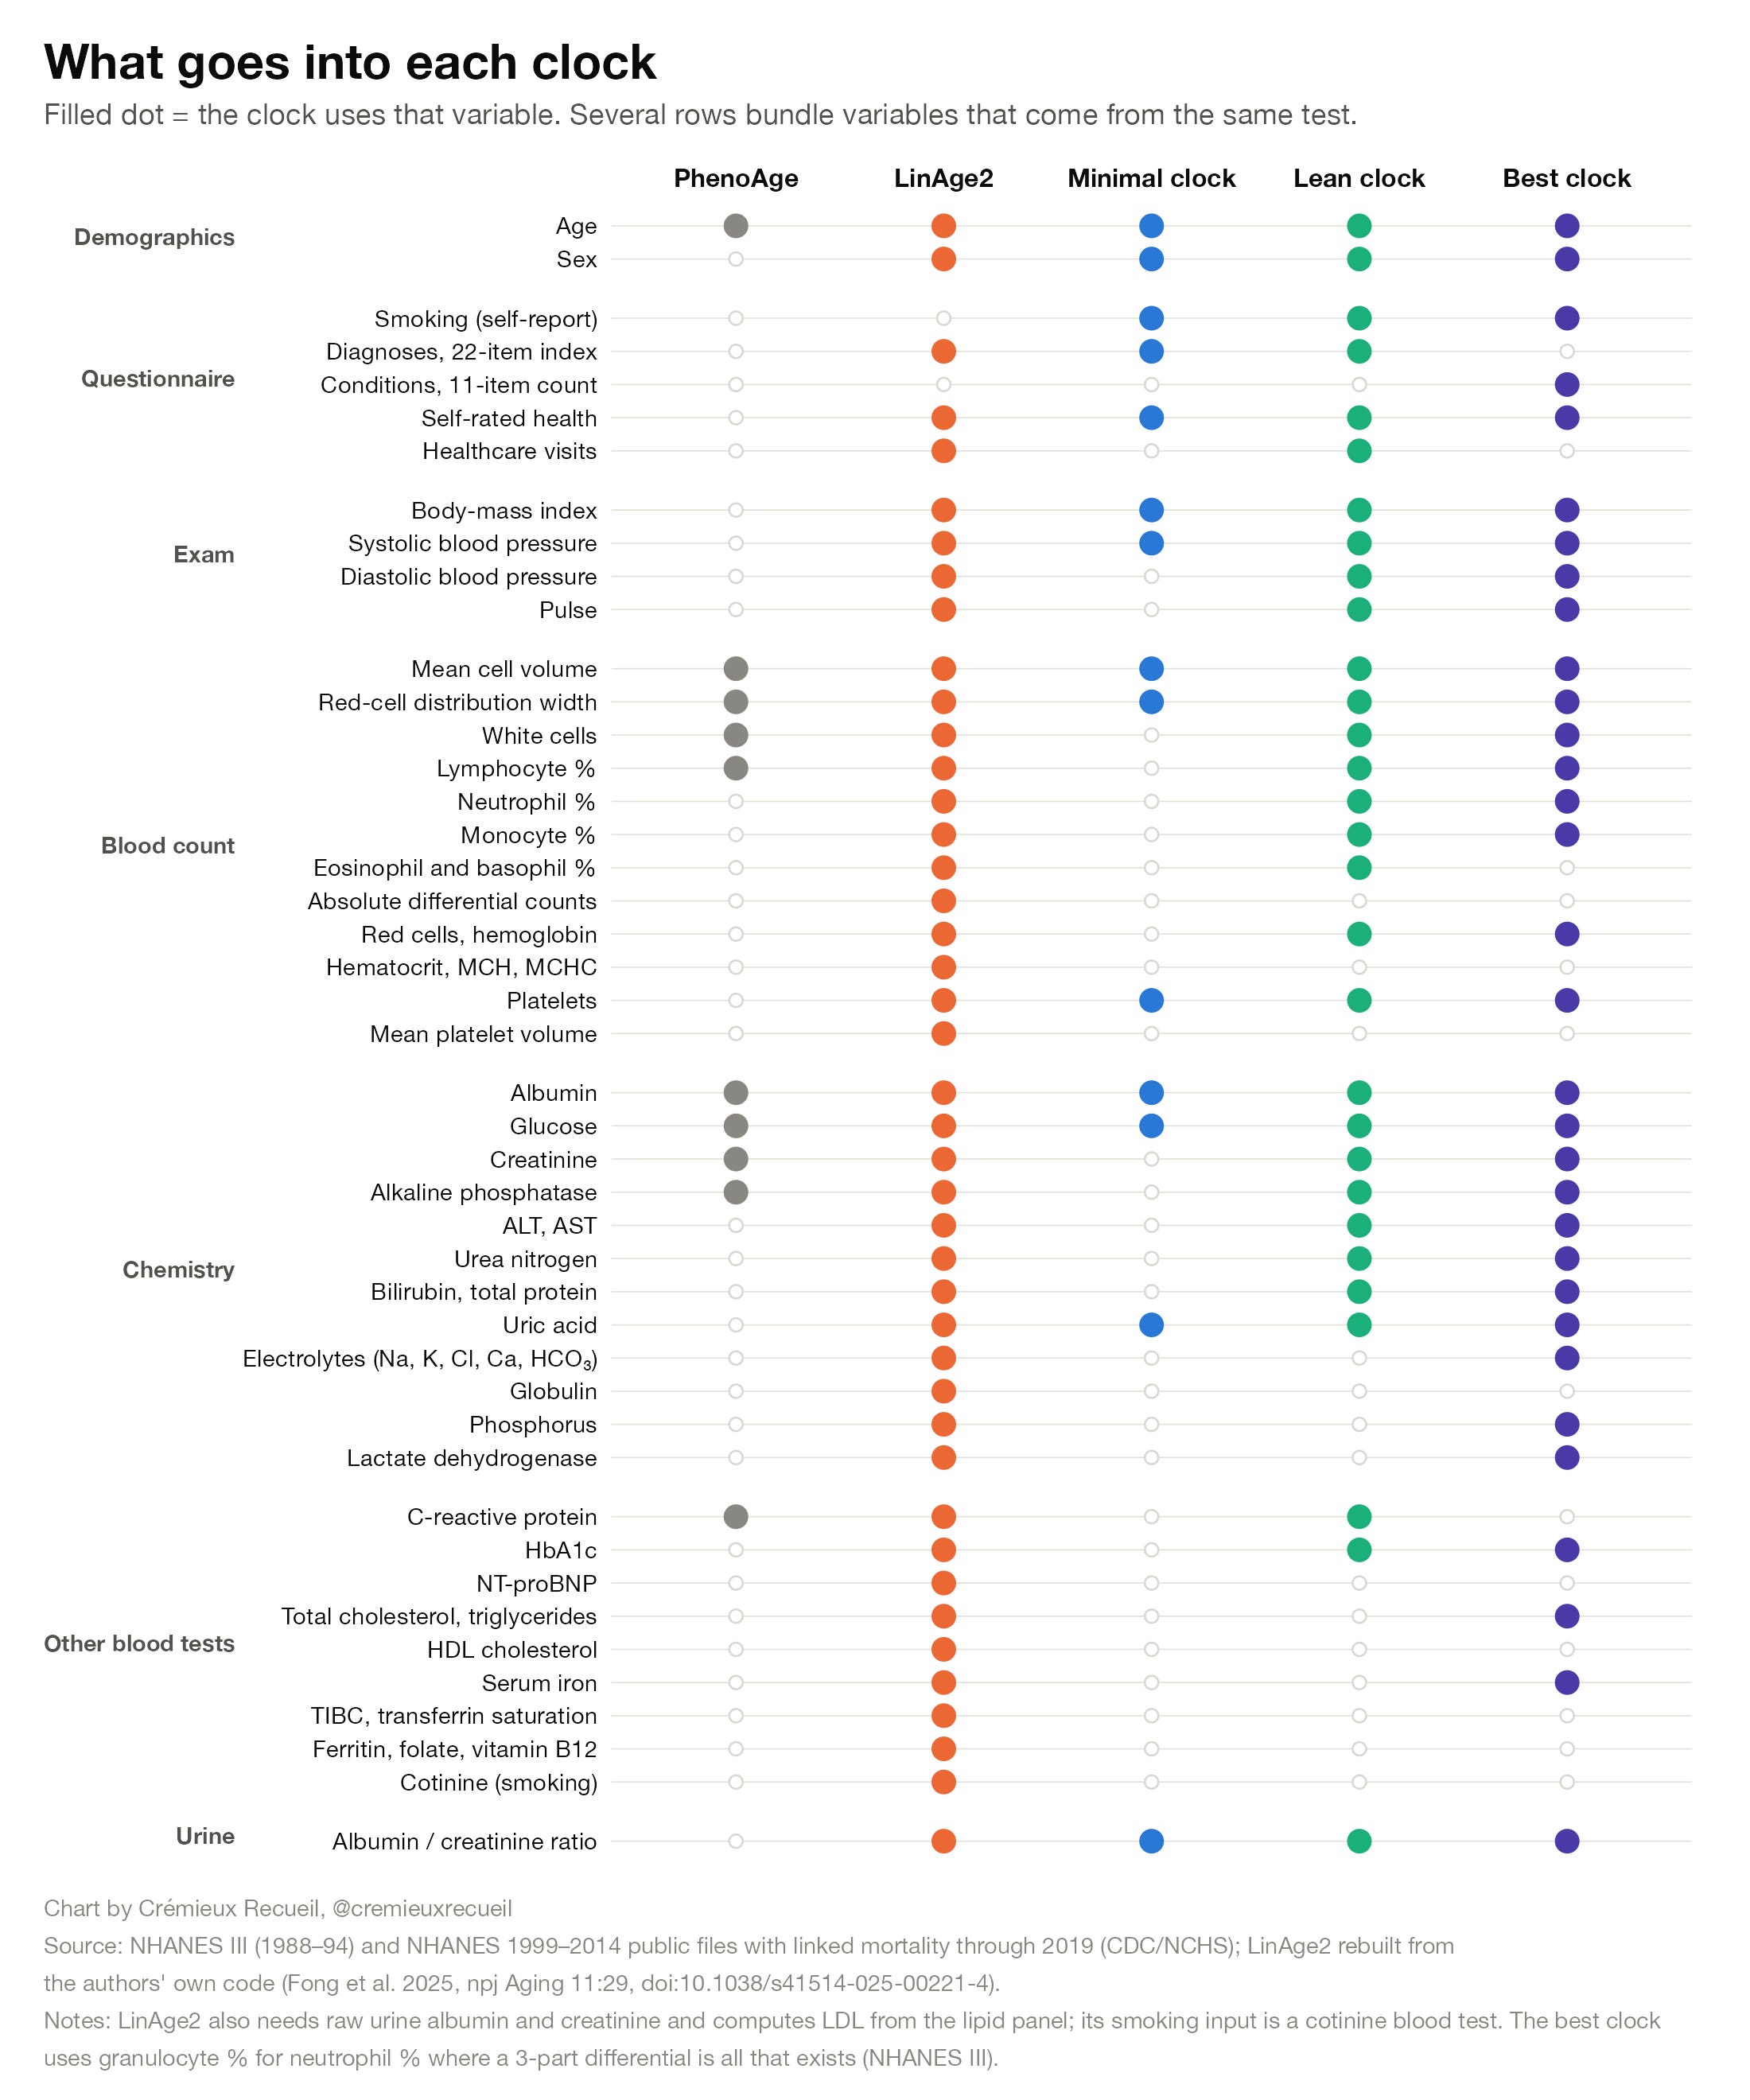
My clocks were all much simpler, and less expensive to gather data for and run.
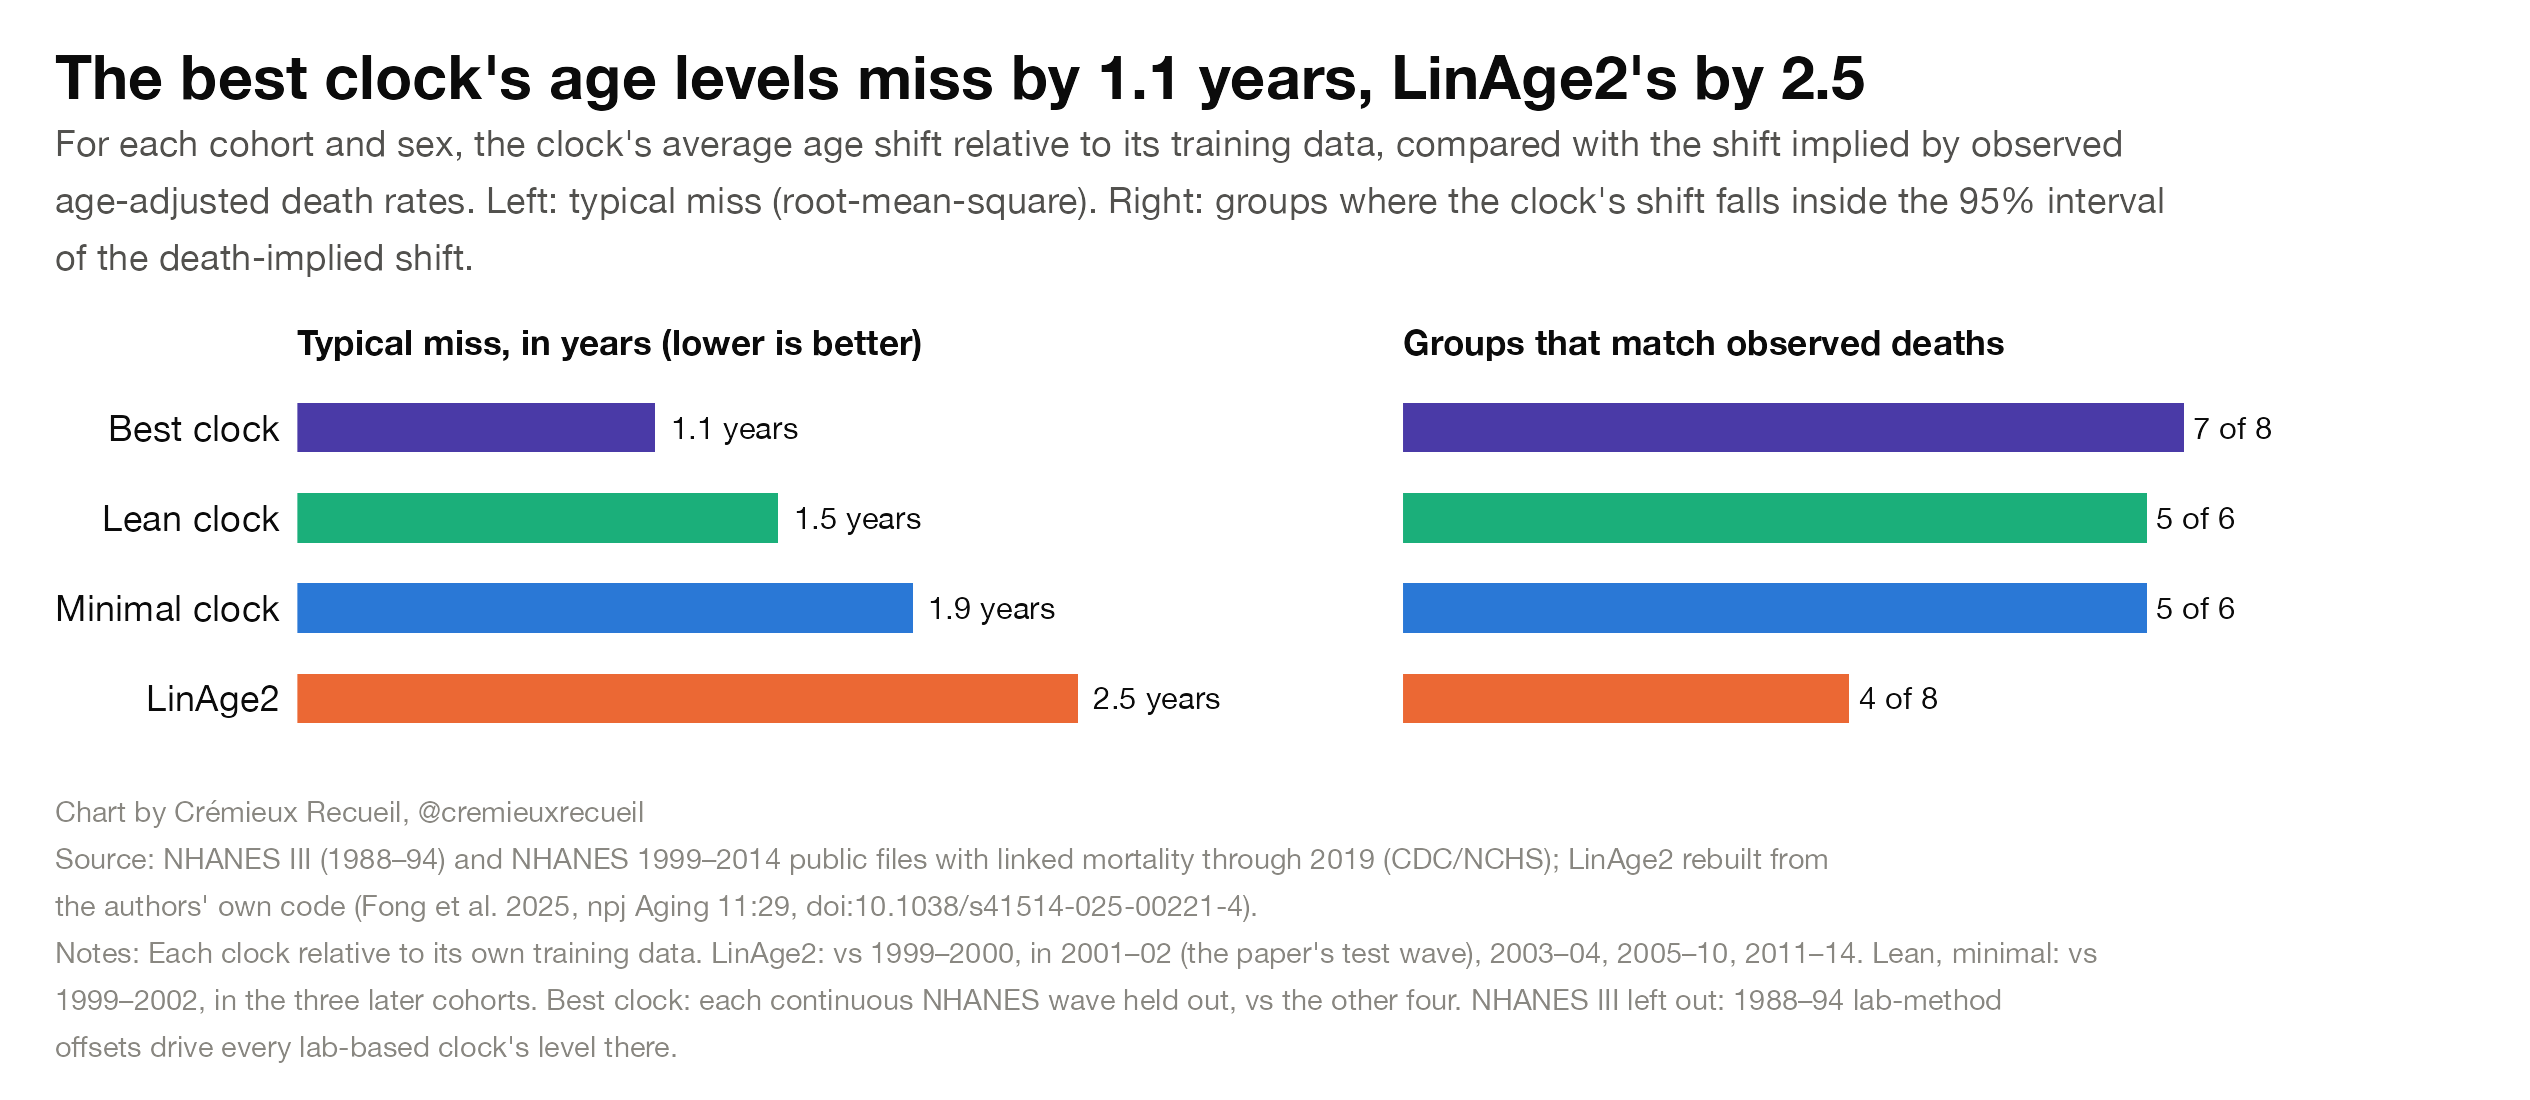
My clocks also had smaller average error in terms of predicted chronological age, and they generalized better across different waves of data.
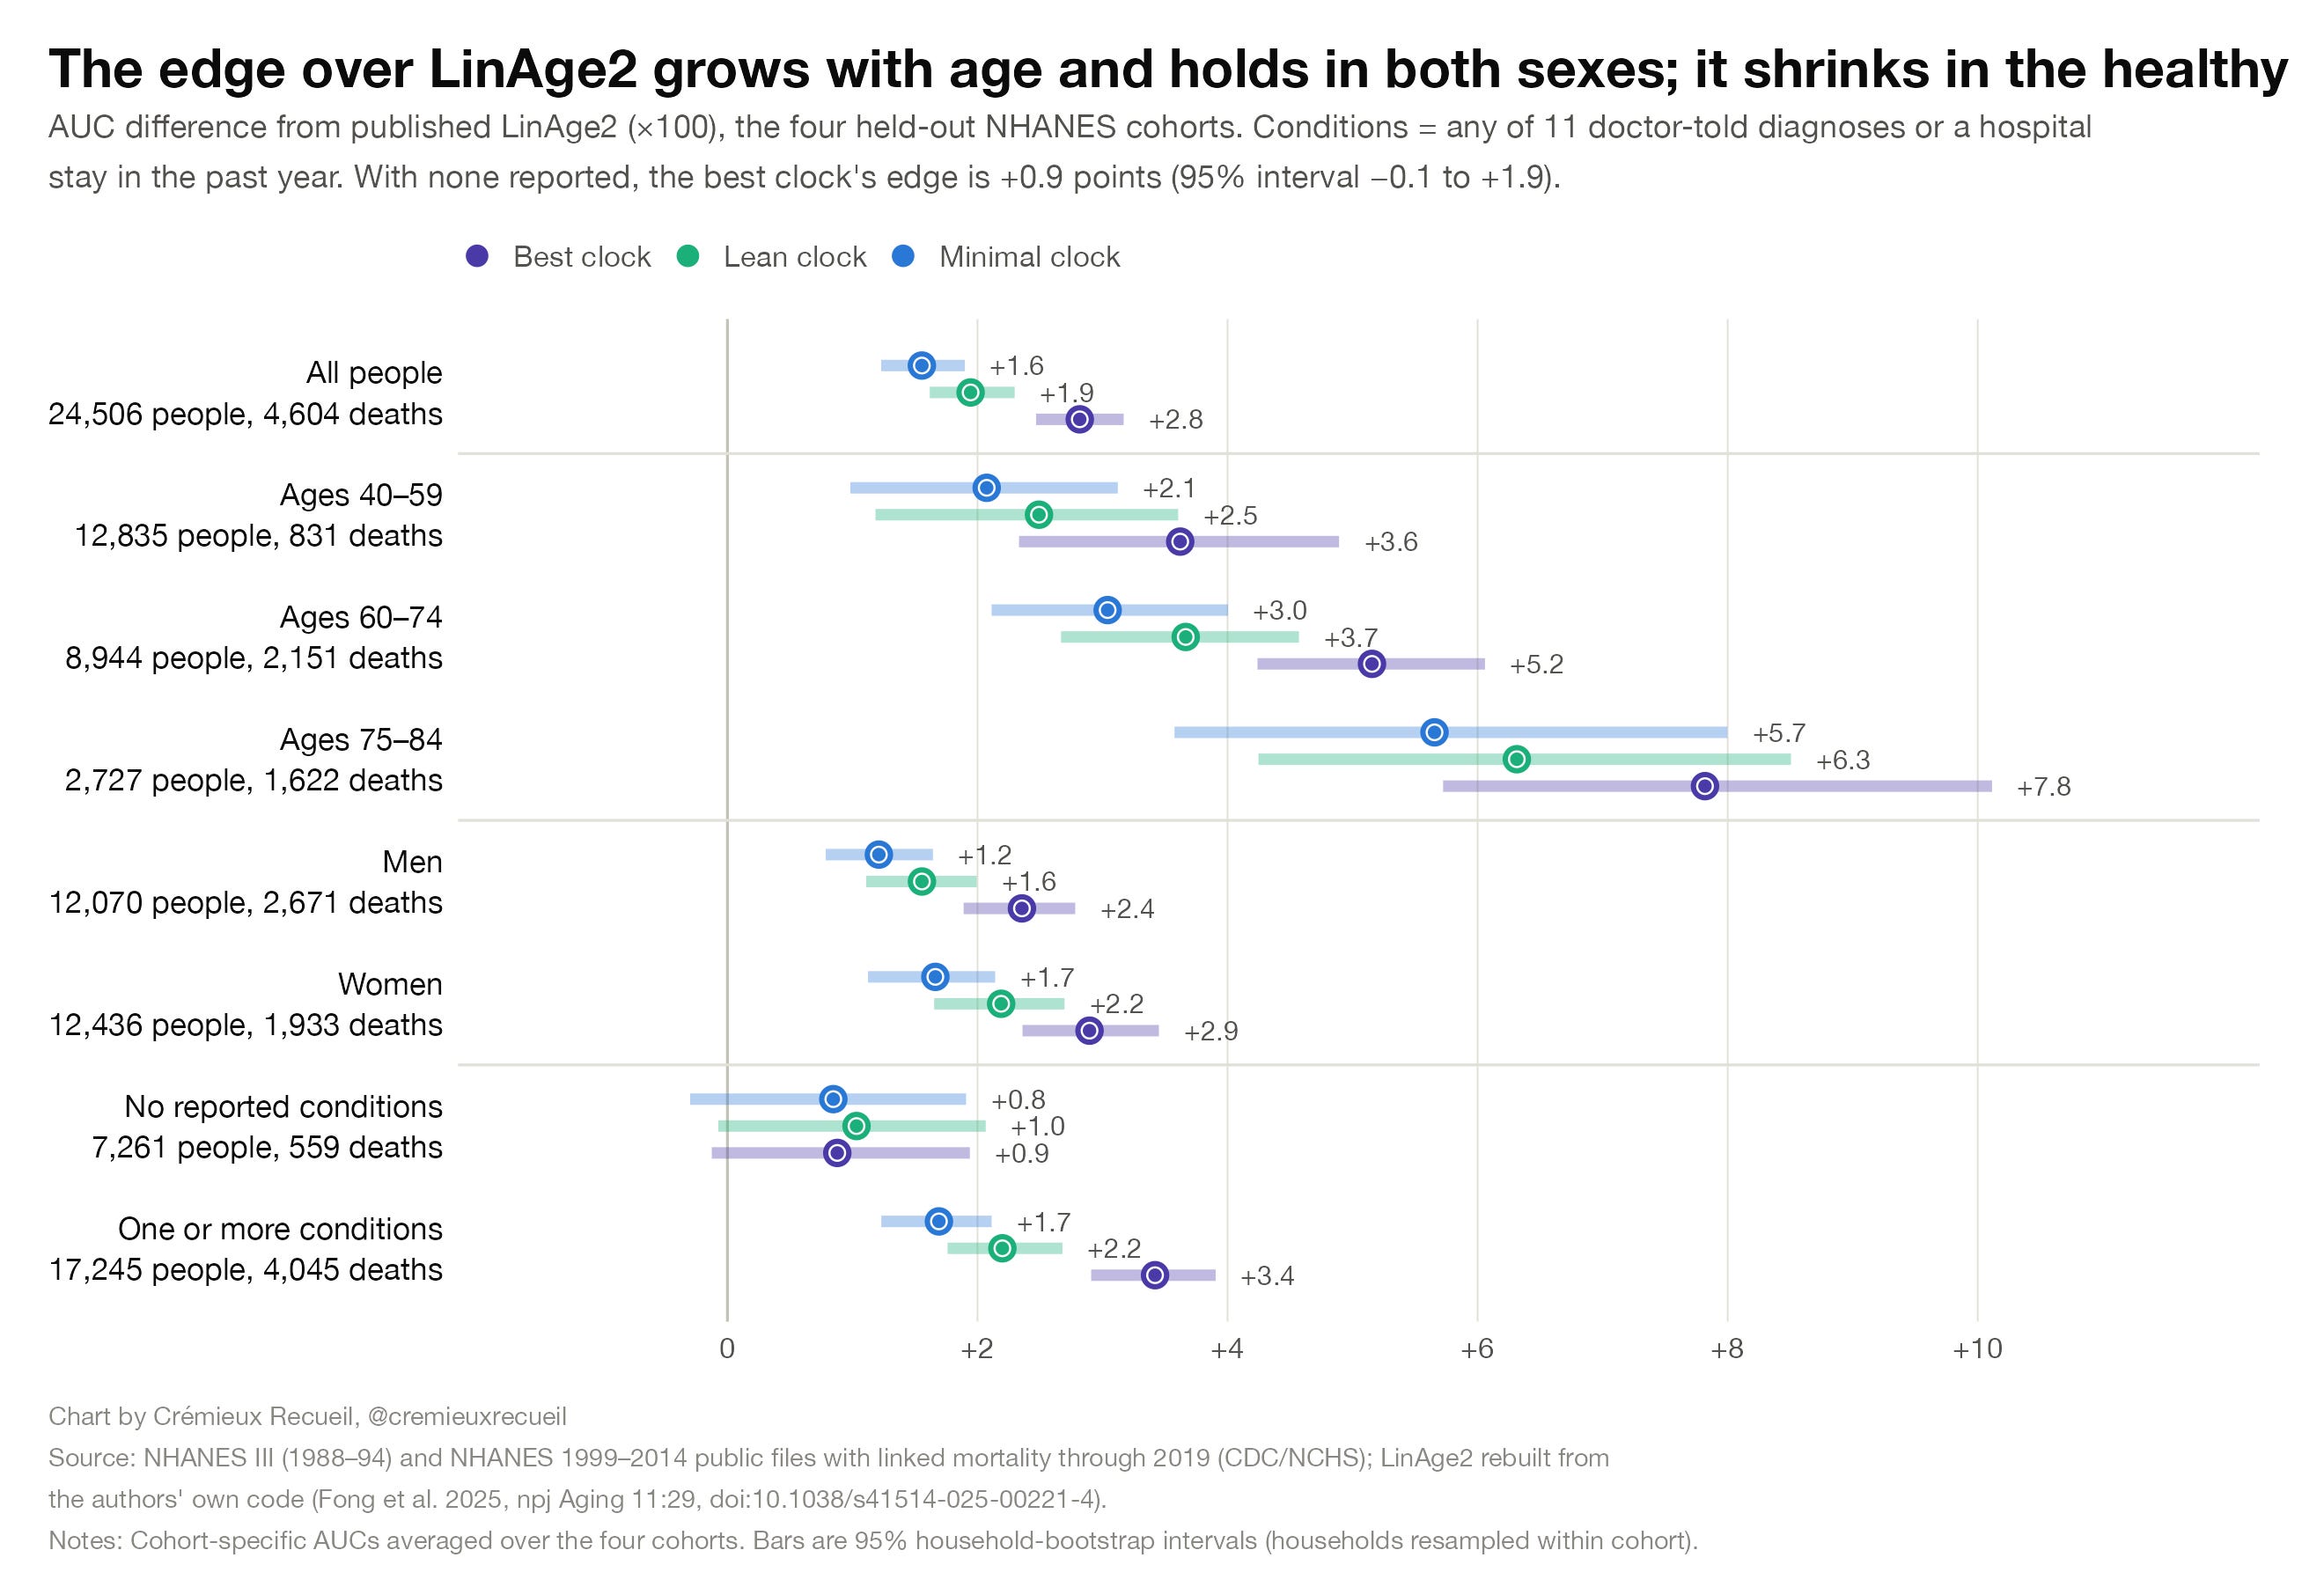
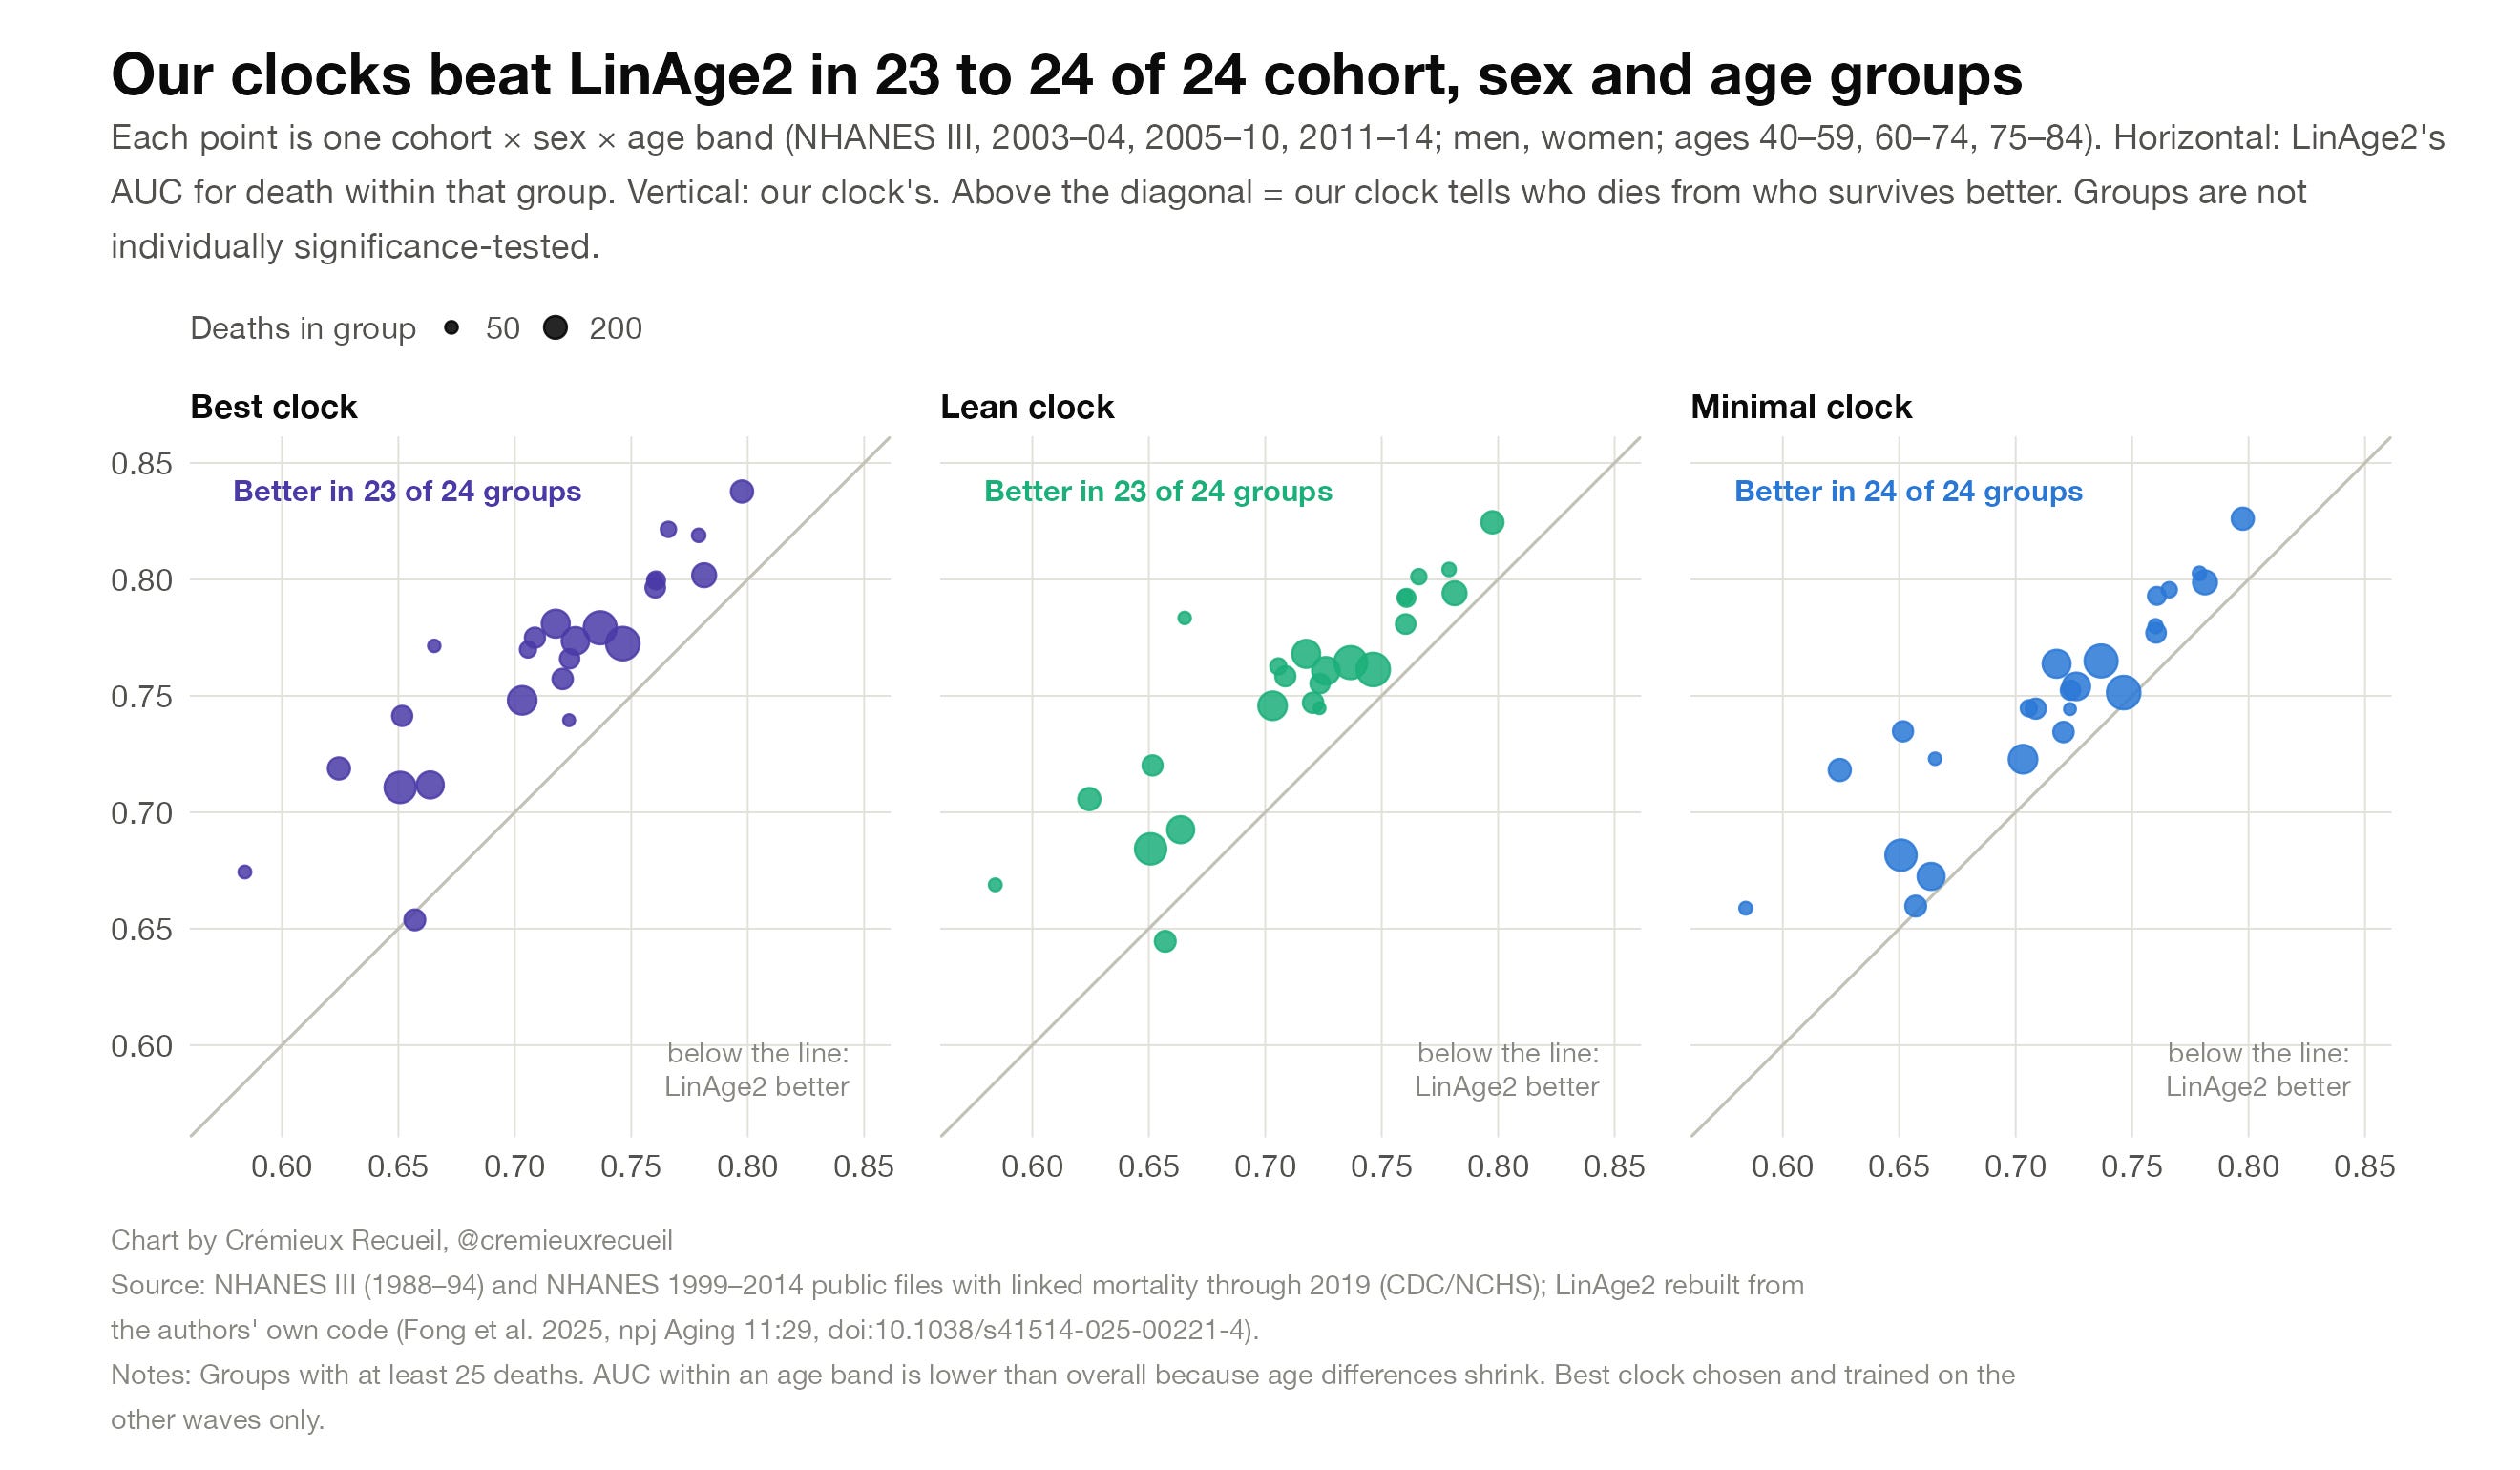
And finally, my clocks always outperformed LinAge2 or, at worst, matched it while doing marginally but not statistically significantly better.1
I also went and looked in the independent NHANES cohorts that weren’t involved in training or testing for LinAge2 and found that my clocks held up better, despite truly independent train and test splits.
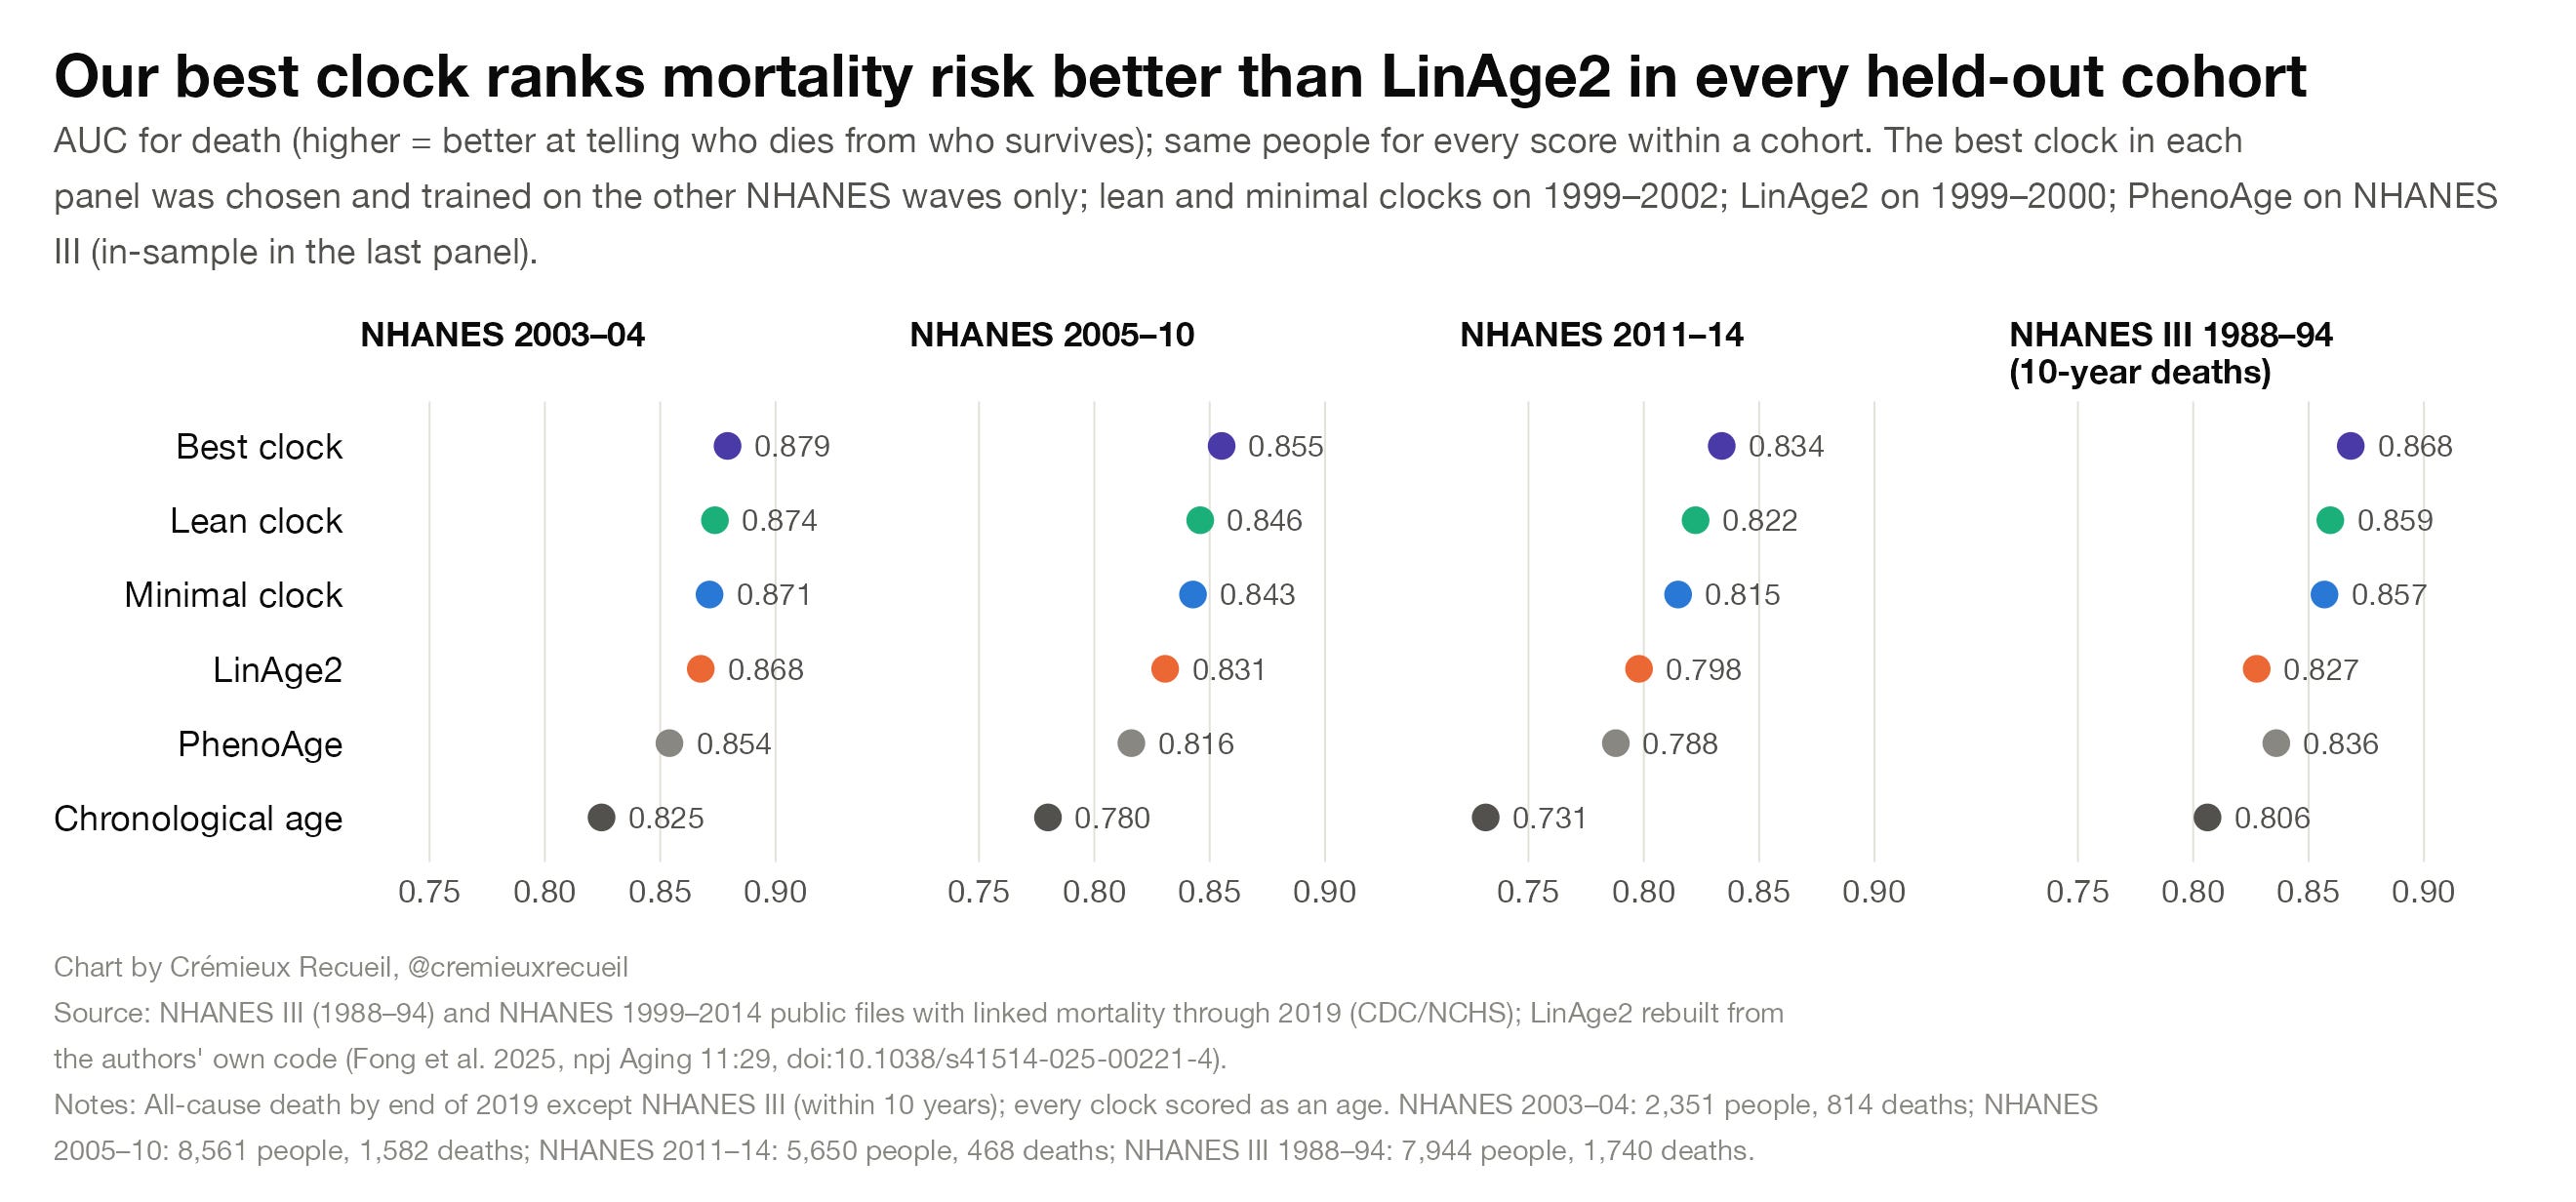
In fact, if we wanted to just match LinAge2, we could do so with barely any variables. Across ages 40-84, age alone achieves an AUC of 0.755. Ask about smoking, self-rated health, number of diagnoses, and recent hospital stays, and this goes to 0.796. Add in blood pressure and BMI and it reaches 0.799. This compares to 0.805 for LinAge2—barely any added benefit despite requiring considerably more data.
Free Clock, Never Used
I don’t believe in commercializing these things because they’re so incredibly simple, they’re made with publicly available data, it’s unclear if they’re useful, and so on. So, I’m making my clock—CremAge—freely available for anyone to use. I’m also providing a simple calculator so anyone can use it right away, and if you’re a clinician, contact me and I’ll provide you a method to automatically fill this out if you’re using Epic.
You can find my replication data, weights, and calculator tool at CremAge.app. Enjoy!
A message from my sponsor, Mechanize:
We’re hiring software engineers to build environments and evals that frontier AI labs use to train coding agents.
To get a better sense of the work we do, you can check out GBA Eval, where we had models build Game Boy Advance emulators from scratch and scored their performance.
Base pay starts at $300K/year for junior software engineers, with more for senior roles, plus equity and performance bonuses. Apply here.
It is better for almost every subgroup if you just use one of the clocks I developed instead of LinAge2.
Thank you! For this post, the information, the insights, and the free (better!) clock! BRAVO! The Internet is Not Dead yet!