

Today’s post is brought to you by my sponsor, Mechanize. They’re hiring junior software engineers at $300K/year base salary.
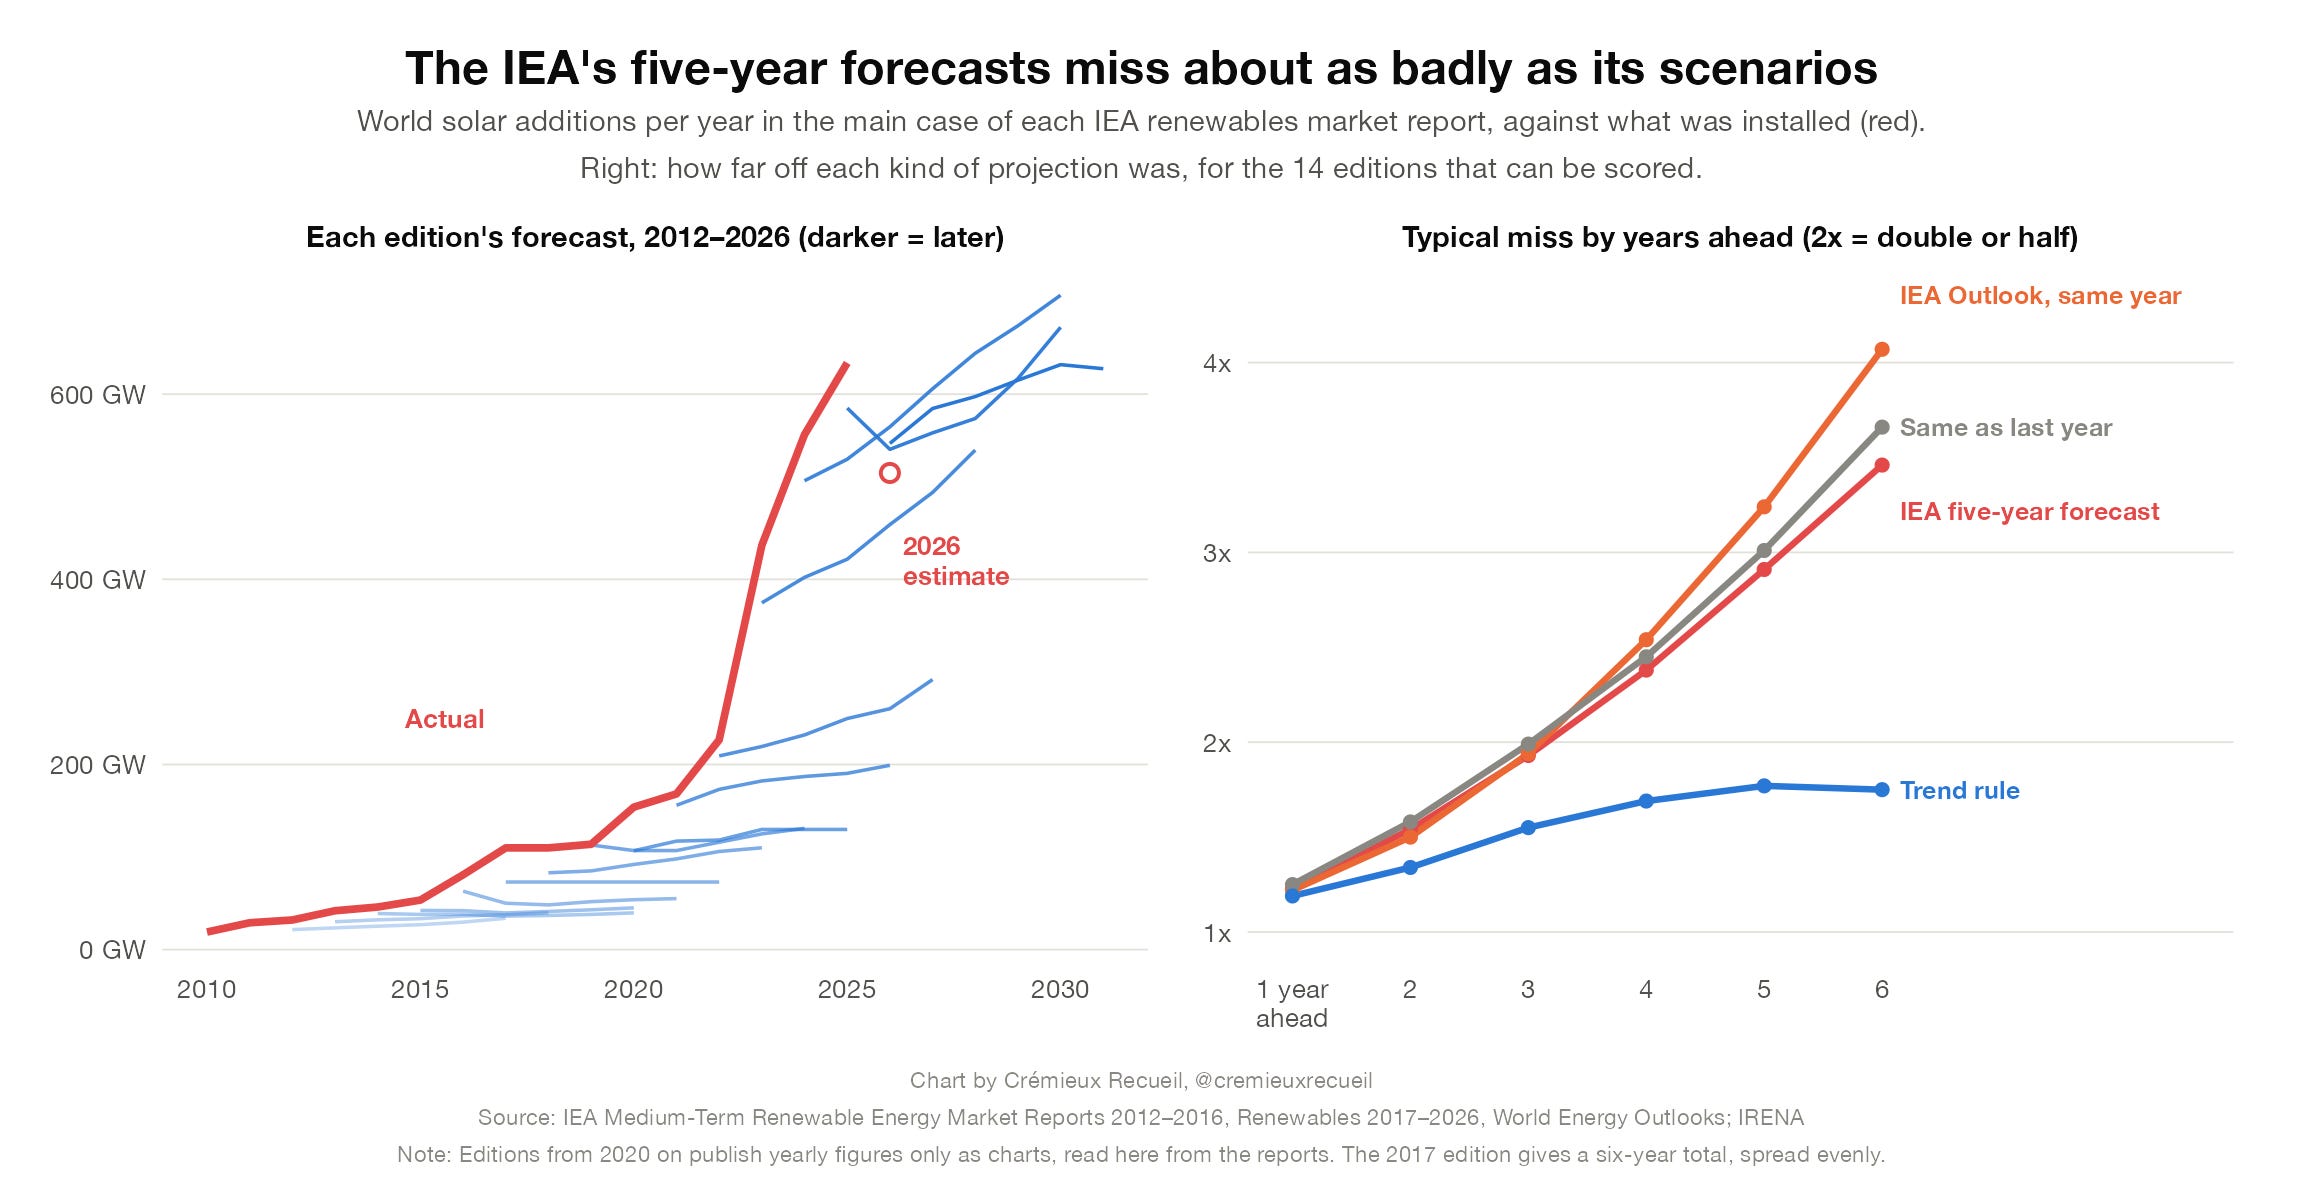
Every autumn, we’re greeted to the International Energy Agency’s (IEA’s) World Energy Outlook (WEO)—their yearly report on the state of the world’s energy generation. Every autumn, we’re also greeted to someone redrawing the same chart: a rapidly rising curve of solar panel installations per year confronted by a fan of flat lines showing where the IEA’s central scenario said installations would go. This year was no exception; we got another flat line, with the IEA seeming to project that the whole world would only add about 600 gigawatts of solar a year until 2040—a little below the 634 added in 2025.
The first I saw get to the chart this year was John Bistline:


“None of the scenarios in the WEO are a forecast.”
The official position from which the IEA gets its standing reply is that what people like John have depicted is not actually a forecast; rather, it’s a depiction of what current policy delivers, extrapolated out to the future. This defense isn’t very strong. It could be stronger if the scenarios didn’t always look like one specific form of forecast: ‘next year will be like last year.’ It would also be stronger if the IEA’s actual forecasts—published separately—did much better:
Can We Do This Properly?
What Are People Planning?
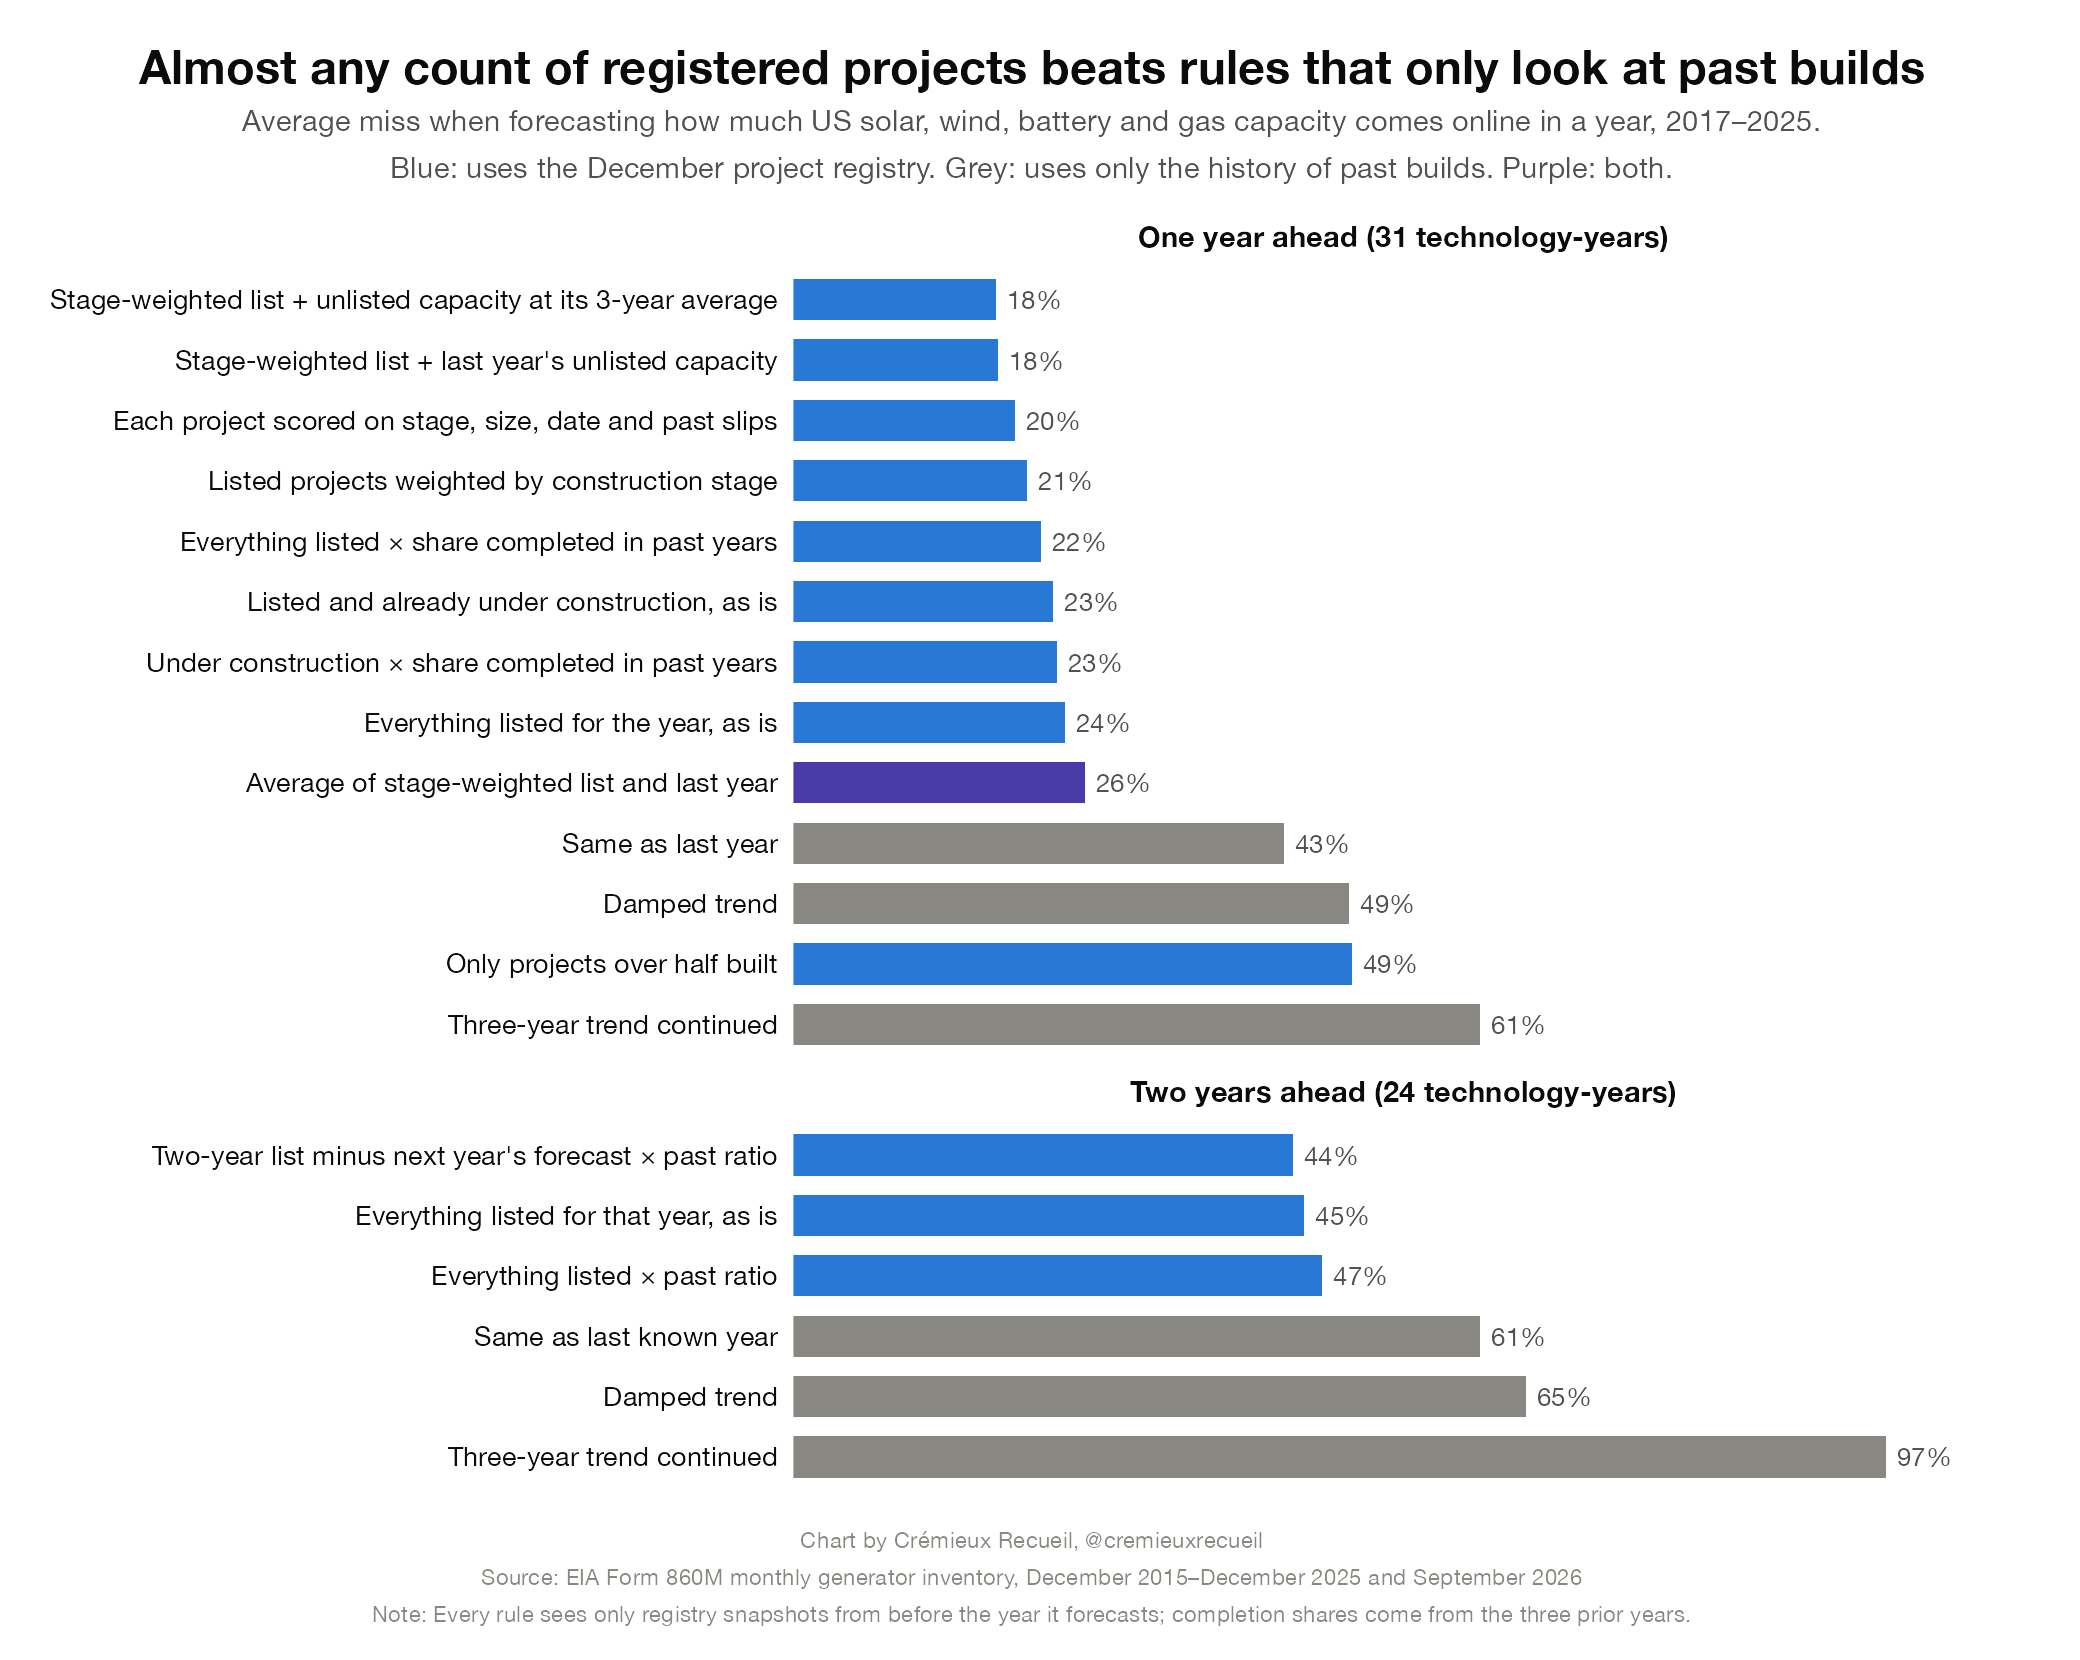
The obvious way to forecast how many solar panels are going to be built is to stop extrapolating from previous years and just counting what’s registered to be built. Since that information is public for every plant of one megawatt or more in the U.S., it’s ideal for testing that idea.
I ran thirteen different forecasting rules on the U.S.’ planned construction snapshots for solar, wind, battery, and gas plants, each set up to forecast building over the following year using only what’s known in the December before.1 Every method misses, but projecting from the previous year misses by much more, and this gets worse looking two years out:
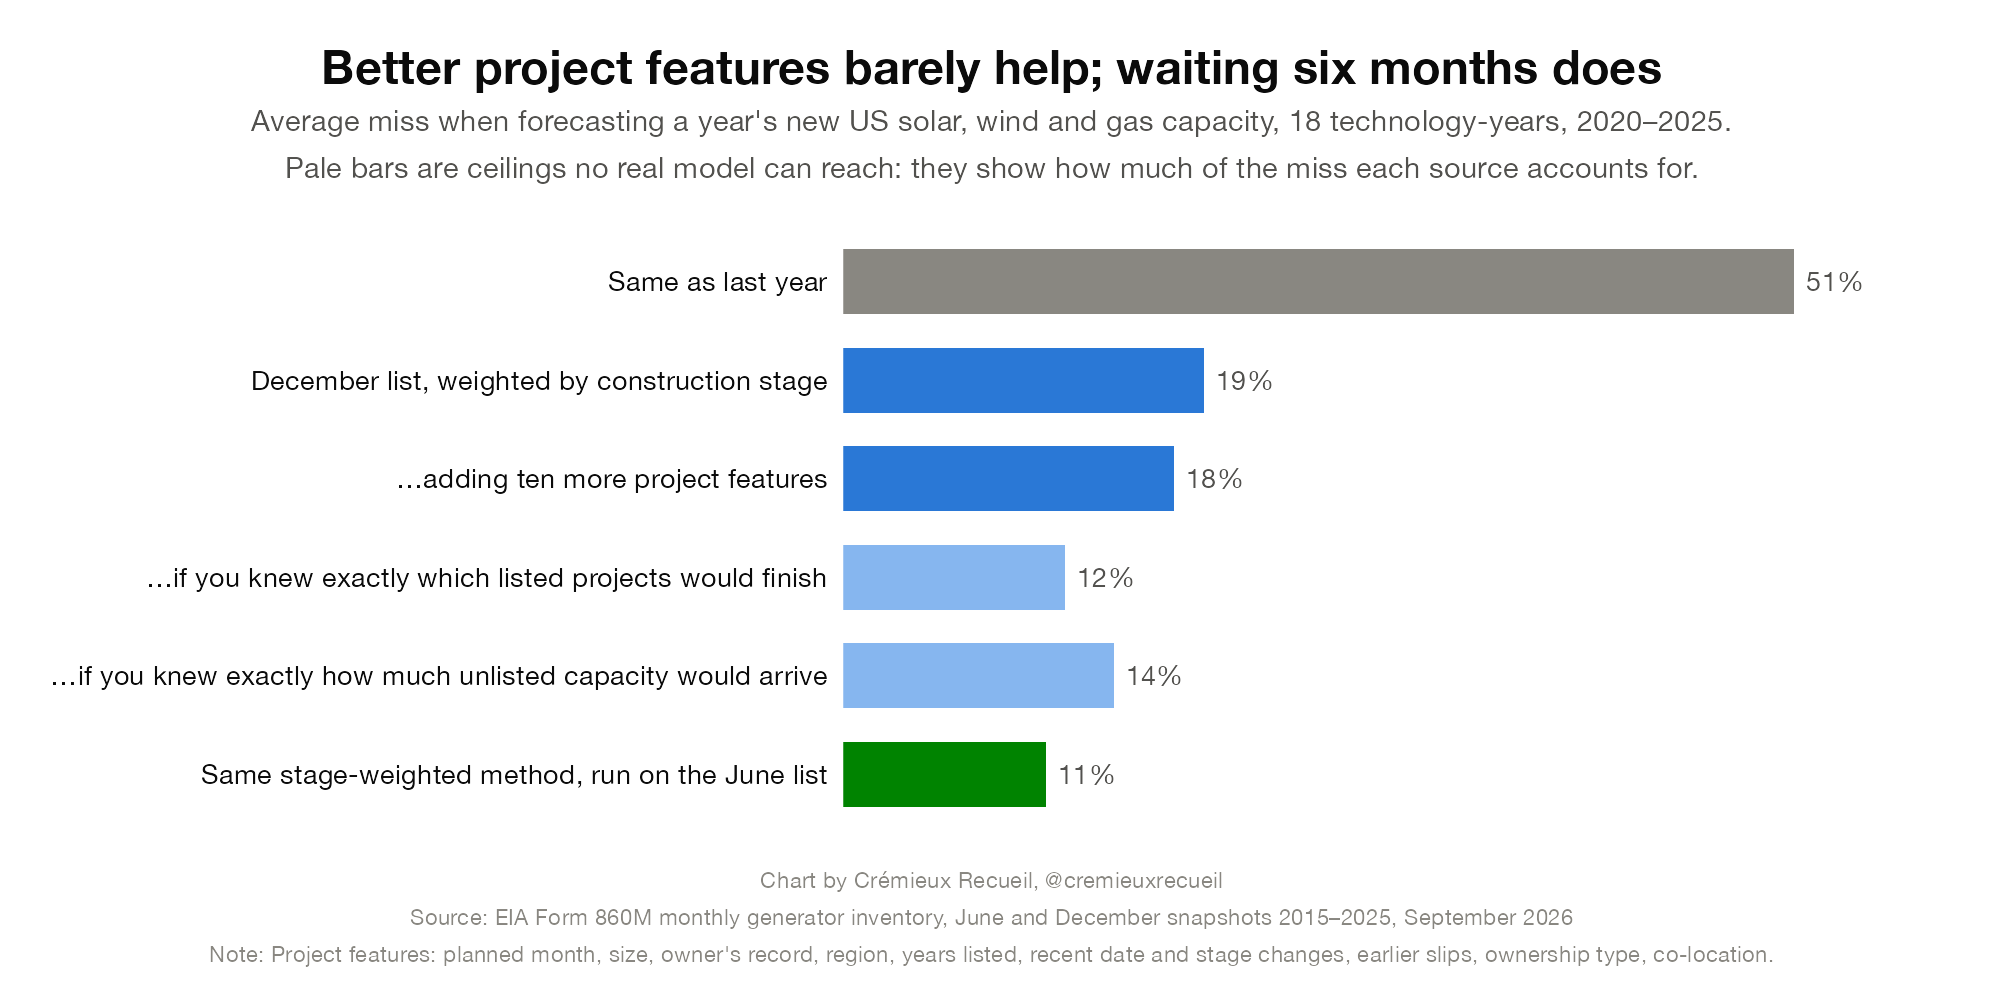
I tried several ways to make these projections better. I added details on projects, from planned months, to size, to owner records, to region, and recent date changes; I tried handling plants that were never listed, and this helped, but not much; I tried pulling unlisted plants from the grid connection queues, but found that they held so many projects they were uninformative; and then I tried waiting: apply the same methods in June and you get much more accuracy:2
Unfortunately, a register of this quality is actually rare. The U.S. has one of the best-catalogued grids, and the closest thing we get for worldwide buildouts is Global Energy Monitor’s solar tracker, compiled by researchers from a lot of different public sources. Using its data, I got alright errors, but they were larger than the within-U.S. errors.
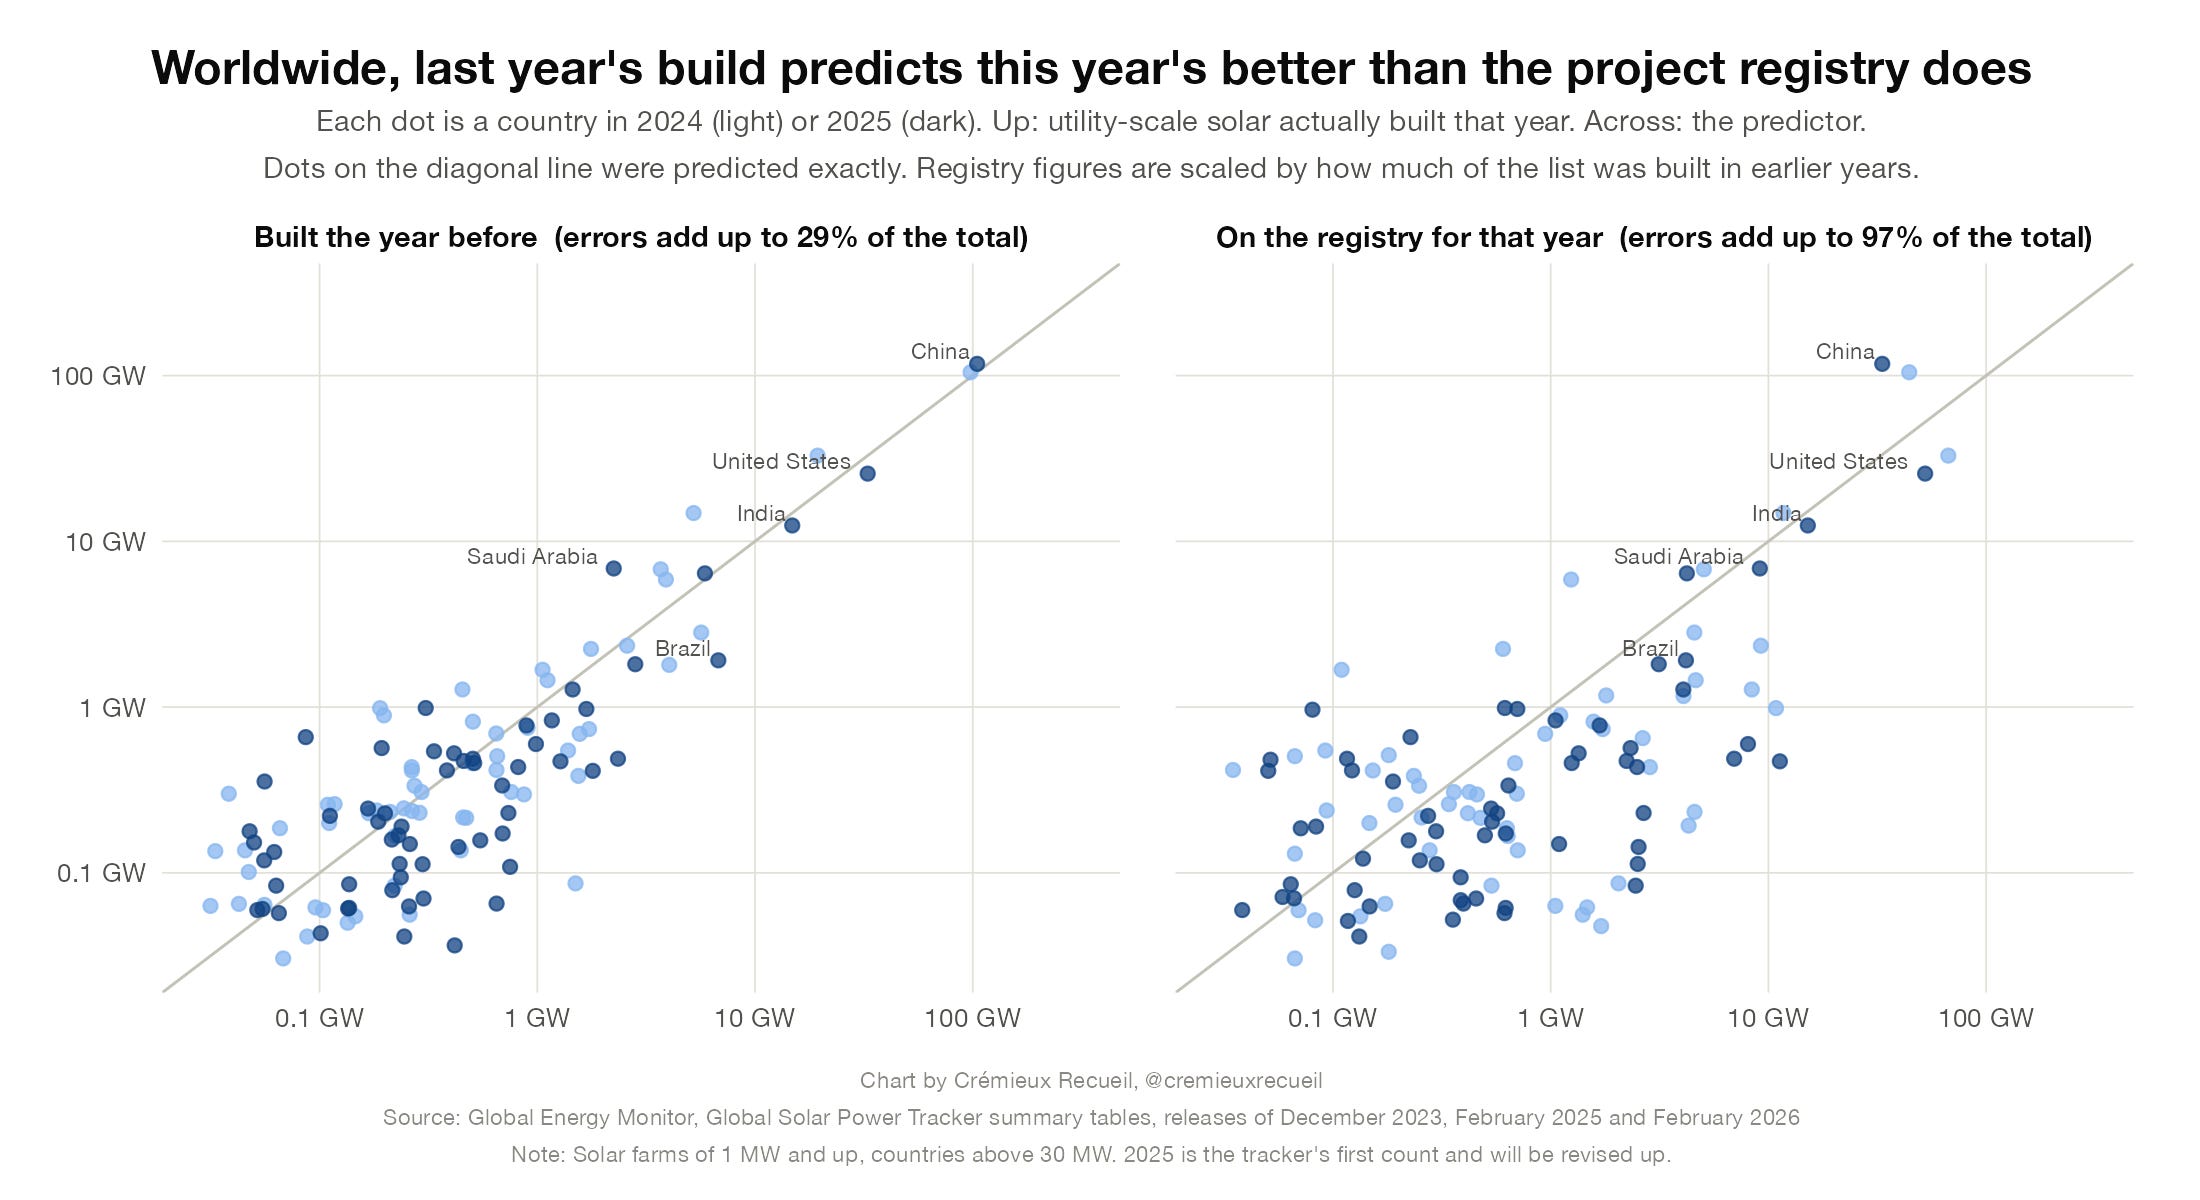
The most embarrassing failure of attempting to build forecasts from people’s plans came from using the U.K.’s planning database. The reason that was such an incredible failure is that it records permissions, and permissions are not actually building commitments—at least in Britain—so, for example, 2025 predicted 17 GW of solar since that’s what was permitted, but they built under 1 GW.
So this forecasting idea seems to not be workable due to data limitations.
Chinese Issues and Grid Connection Data
OK, so we need more data and we need to think about the solar environment.
China connected 111 GW in the first nine months of this year. That might sound like a lot, but it’s down 54% from the same months in 2025 because developers at the time were rushing to beat a pricing change. Extending the year by its usual seasonal pattern and correcting for how far that method overshot in past Septembers puts 2026 at about 515 GW worldwide, down from 634. That would actually be the first substantial drawdown since the solar industry took off.
A simple trend rule on its own says we should get 772 GW this year, and 515 is outside that projection’s lowest predicted value. The IEA’s flat 600 GW projection is actually closer than that rule this year! And the agency’s new forecast of 547 is close to the same answer I got. Monthly grid connection data did manage to make it possible to catch what a projection rule could not, making it the best substitute for a plan registry.
We can also use Chinese panel exports, which lead installations in the rest of the world by roughly a year empirically. Between 2019 and 2025, the correlation between export growth in one year and installations in the next was 0.91. Exports are down 8% in 2026, which points to a slowdown in 2027—at least outside China.
Estimating a Ceiling
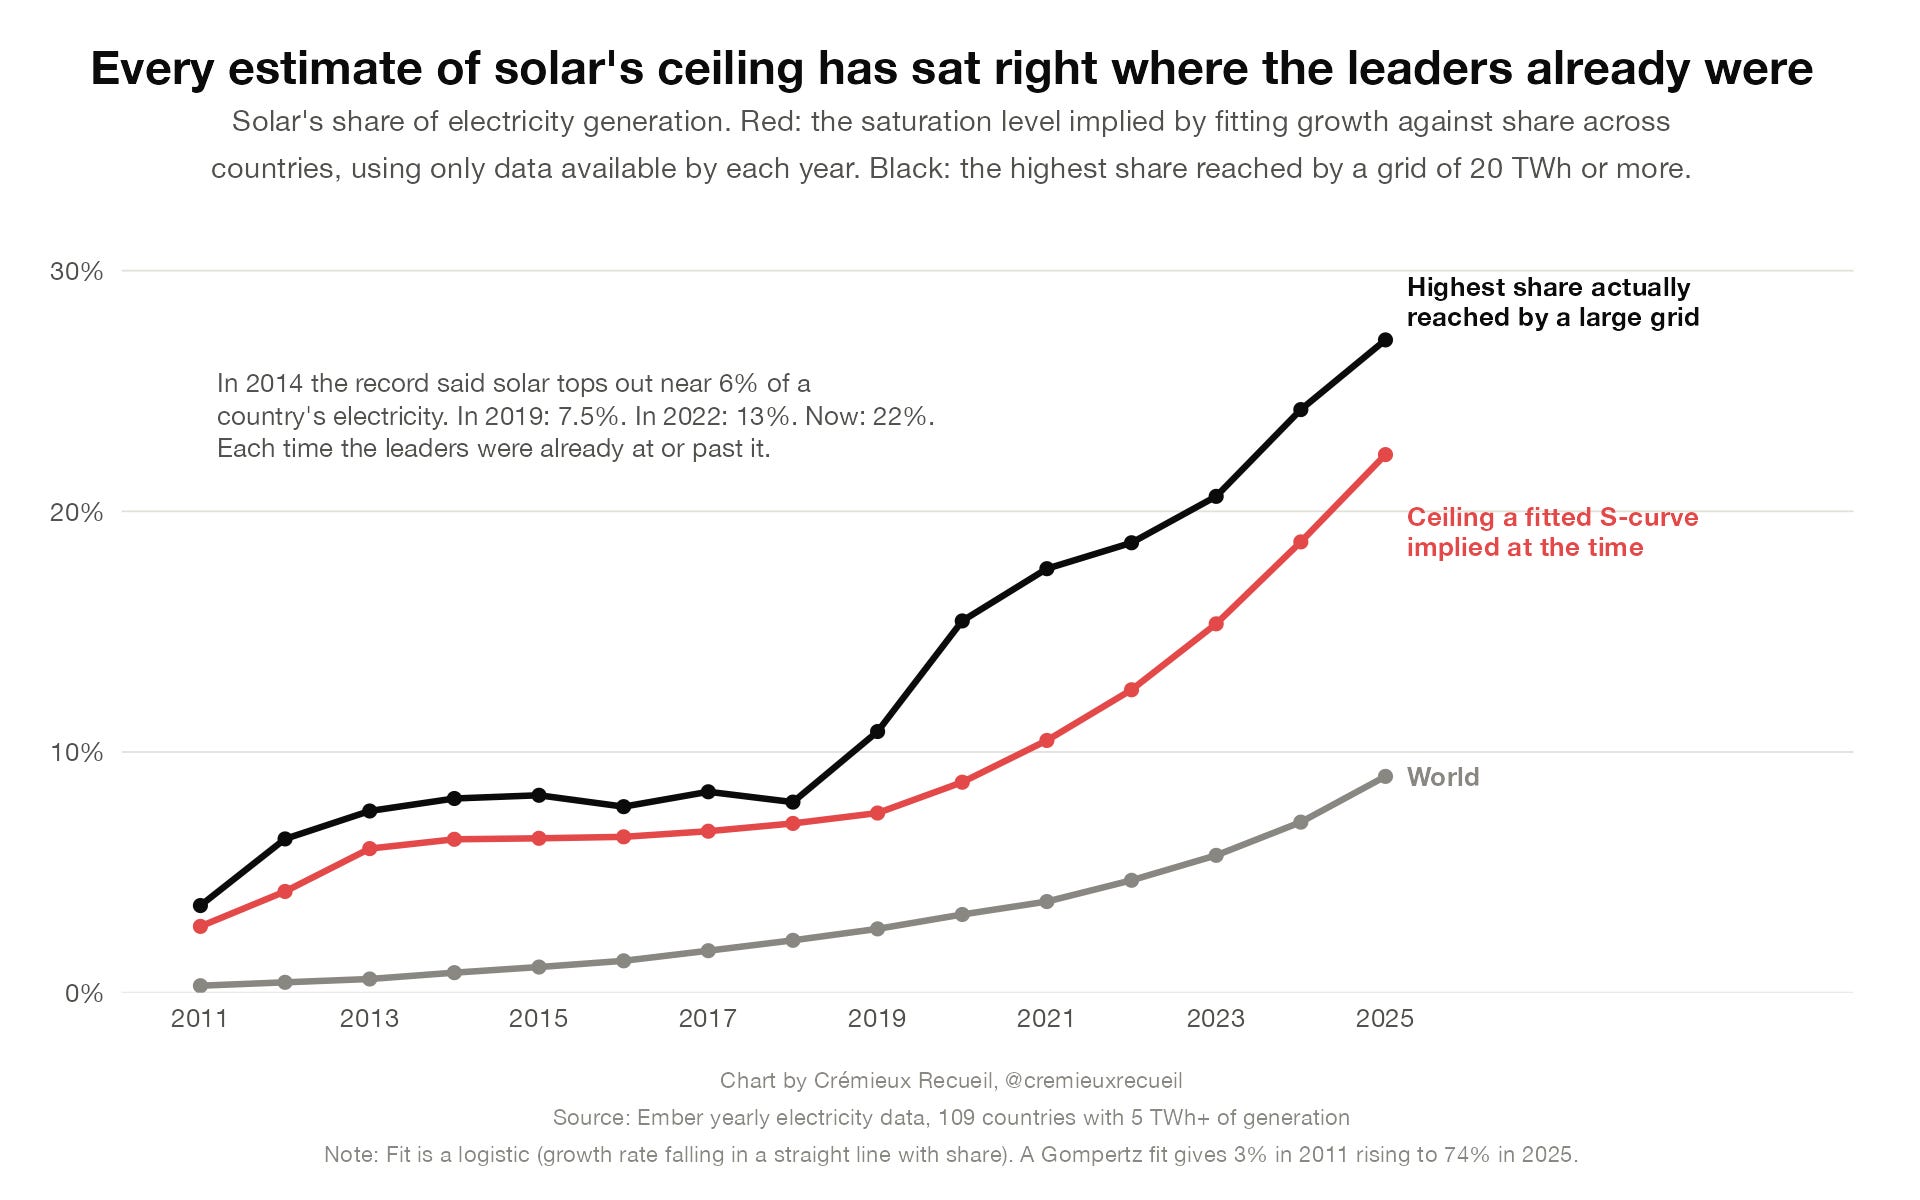
All trends eventually cap out, they stop somewhere, they don’t go on forever.3 The obvious place for a trend to stop is when solar supplies as much of the grid’s electricity as it can use. The standard approach people take is, given this assumption, to estimate a ceiling from countries further along the curve.
This is plainly impossible. Fitting an S-curve across countries gives a ceiling of 6% of electricity in 2015, 9% in 2020, and 22% today. In each year, the leader was already above the estimate, and even poorer countries like Hungary (27%) and Chile (25%) are gaining two to three points a year. Adding a fitted ceiling to trend would’ve made the IEA’s ten-year forecasts—and any of mine—four to seven times worse. We should not assume there’s a readily-identifiable ceiling.
The Kitchen Sink
I’m really not sure how to model this because solar panels are subject to technological progress and they’re stimulating demand for batteries, which will make them more usable. I threw the kitchen sink in and rejected basically every feature I could find. My eventual model predicts a dip this year and considerable growth going forward. It’s pretty simple, and I think it’s directionally realistic:
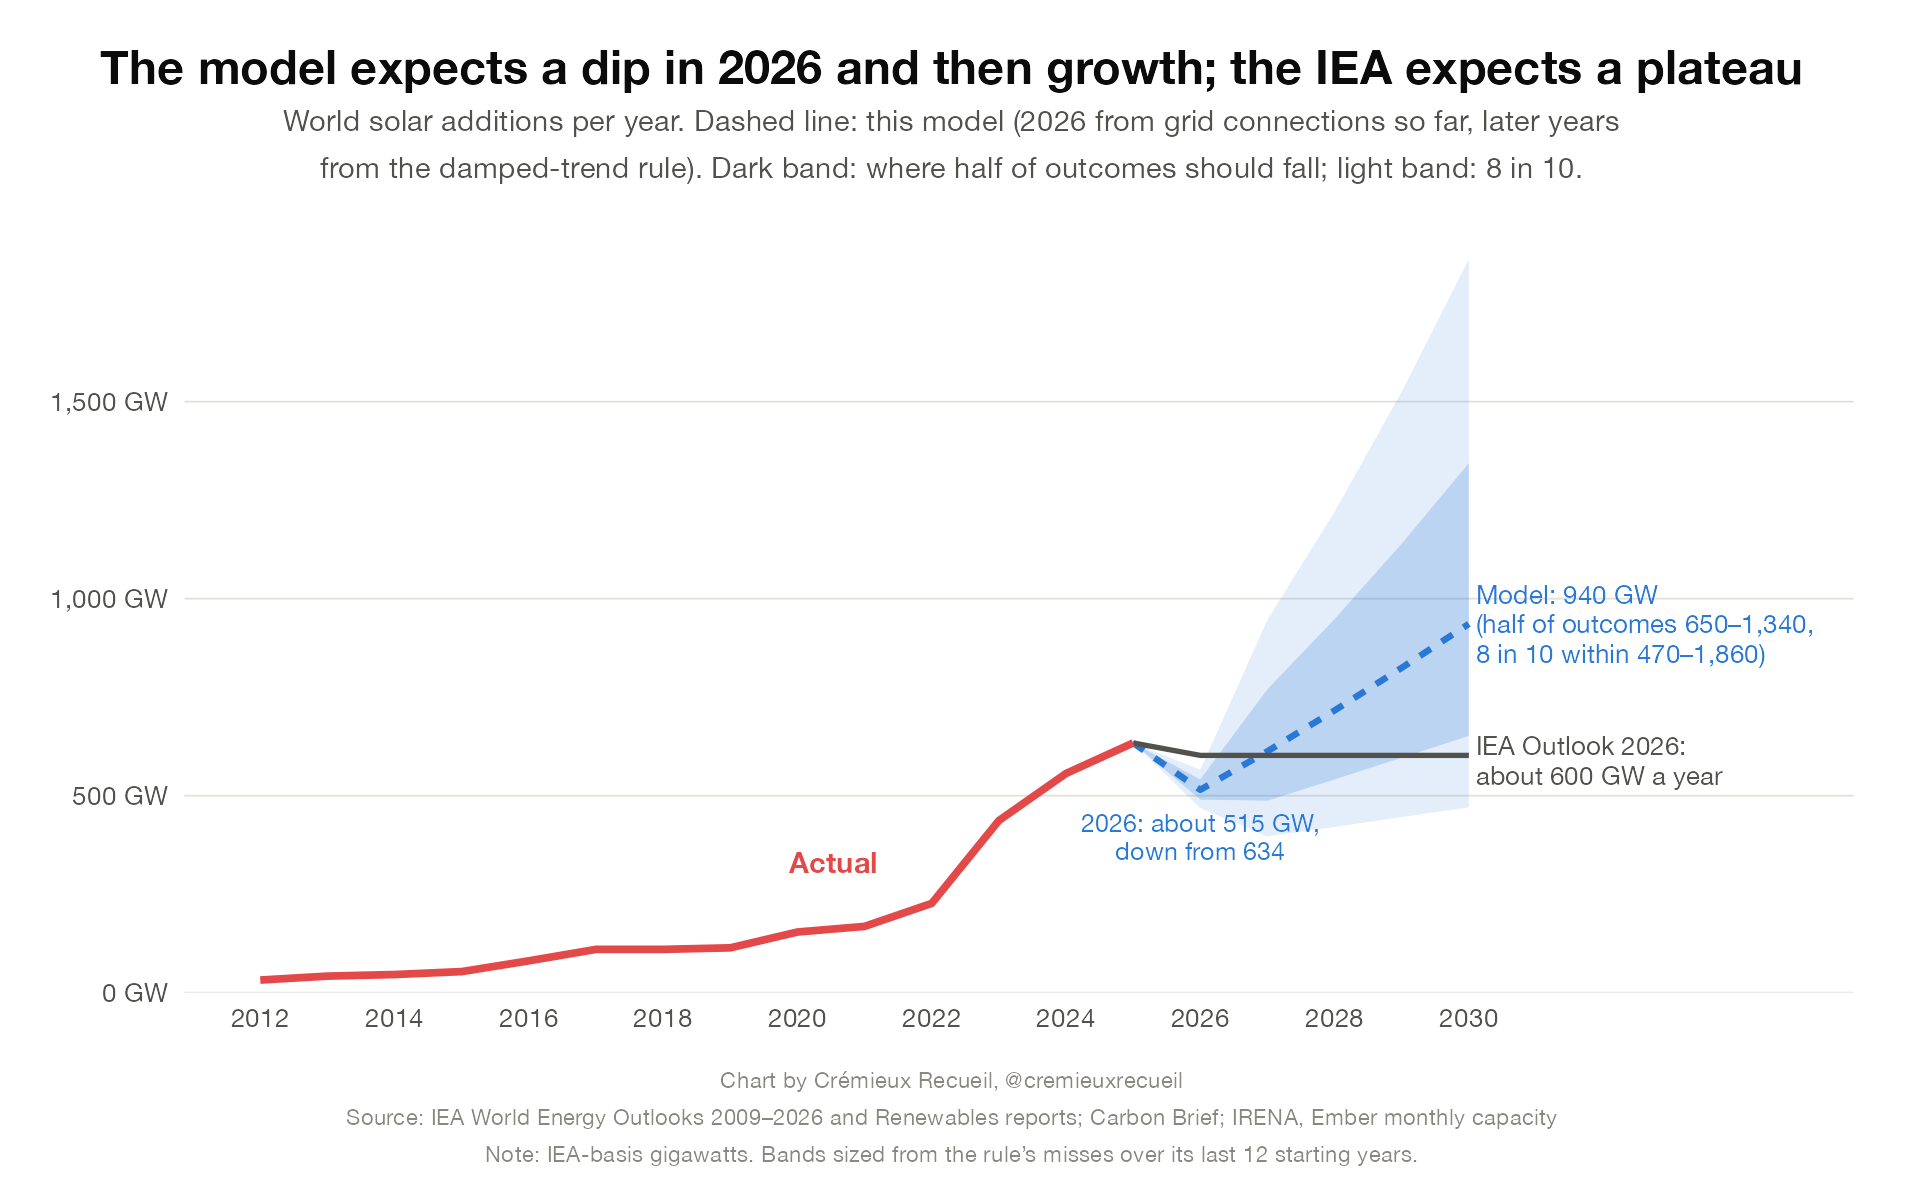
In 2026, the model predicts we end up with 515GW of buildout—the first down year in a while. In 2027, it predicts 610 GW, though falling Chinese exports argue for a lower estimate. In 2030, it predicts between 780 to 940 GW being installed, depending on the ceiling. The rule’s past misses place half of potential outcomes between 650 and 1,340 installed, and there’s a one-in-five chance additions are at or below the IEA’s 600 GW from their outlook. As to 2035 and beyond, the prediction is 730 to 1,500 GW per year, set by how much grids can absorb. With 50%, that causes the estimate to plateau near 1,150.
Is This Actually Good?
A forecast is only useful if its range has been tested, so I replayed my procedure as it would’ve run in past years, using only what was known at the time. What I can say is that the ranges hold up and, while the central estimate is never exactly right, the actual outcome fits within the prediction band 95% of the time until 2023, when it contains it 82% of the time after the big surge in building.
What this certainly does do is beat the IEA’s projections. Forecasting ‘the year so far plus a simple trend rule’ gives half the prediction error of the IEA’s estimates, but it’s still off about 21% on average.
Predicting Solar
It’s very hard to predict the future with any meaningful degree of accuracy. The IEA tries for solar every year, and they fail every year. This is bad because it means solar park developers face uncertainty that they can’t manage with forecasting.
Ideally, prediction would give a year or two of usable warning whenever someone keeps a mandatory list of projects. Someone has to decide what to try to build, years ahead of it getting built. That includes how much grid to build out, how many panel factories to finance, how much gas and goal capacity to keep online, and how much storage to pair with the panels. Each decision rests on a number for how much solar is coming, and the IEA’s numbers are the most widely used.
But the IEA’s numbers are definitely faulty, so they definitely cost people money. When their estimate is too low, as their outlook has consistently been, the grid gets planned for less solar than actually arrives. It becomes hard to say how much of extant project curtailment traces to those estimates. When their estimate is too high, the cost falls on the people who built to meet that estimate. For example, some 90% of Chinese panel makers are losing money and over 70 such firms have filed for bankruptcy since 2024 alone.
Better forecasting wouldn’t remove these costs, but it would improve the situation and make a buildout easier. Having warning about market conditions a year or two ahead of time could make the difference between many projects living and dying, between our energy becoming greener faster or remaining dirty and expensive for longer.
Perhaps what we need, rather than forecasts, is prediction markets!
This was a timed post. The way these work is that if it takes me more than an hour to complete the post, an applet that I made deletes everything I’ve written so far and I abandon the post. You can find my previous timed post here.
A message from my sponsor, Mechanize:
We’re hiring software engineers to build environments and evals that frontier AI labs use to train coding agents.
To get a better sense of the work we do, you can check out GBA Eval, where we had models build Game Boy Advance emulators from scratch and scored their performance.
Base pay starts at $300K/year for junior software engineers, with more for senior roles, plus equity and performance bonuses. Apply here.
