Range Restriction: Why Generalizing From Your Social Group Is Harder Than You Think
A Guest Post by samizstat
When you hear people talk about IQ, one idea you'll often come across is some variant of:
IQ doesn't matter above a certain threshold.
Or if not IQ, then some IQ-like measurement, like SAT scores. And it is often supported by an anecdote, typically like:
Among my highly-accomplished friends/colleagues/peers, there's not much relation between SAT1 and how good they are at [thing].
Are they right? Yes, and no. Their own observations within their social group may be completely accurate, but it doesn't support the conclusion that IQ ceases to be meaningful above some threshold.
How can this be the case? The answer is restriction of range, which is a particular kind of sampling bias:
Restriction of range is the term applied to the case in which observed sample data are not available across the entire range of interest. The most common case is that of a bivariate correlation between two normally distributed variables, one of which has a range less than that commonly observed in the population as a whole.
When you think about it, this is actually the default for most people. In our daily lives, we do not interact with an unbiased sample of the population. We self-segregate: by class, by race, by wealth, by interests, and (implicitly) by intellectual ability. In the quote, the tell-tale sign we are dealing with range restriction is the "highly-accomplished" qualifier. If your social circle is full of people with advanced degrees, then you are in a range-restricted bubble, in which (naïve) correlation behaves counterintuitively.
Technically-speaking: suppose we have two random variables X and Y, where Y is linearly dependent on X, plus some random variation, such that X and Y are imperfectly correlated. We impose range restriction, meaning we only sample observations for which Y is above some cutoff value. Then we compute the sample correlation within the range-restricted sample. Correlations within such a sample are attenuated and harder to estimate reliably, compared to the population as a whole. That is to say, as we increase the cutoff threshold, the correlation you observe tends to shrink towards zero, and the dispersion of correlations across repeated samples increases.
This phenomenon is easy to demonstrate via simulation. First, let's look at attenuation.
We will simulate an idealized population of 10,000 people. Their IQs will follow a Gaussian distribution with the familiar average of 100 and standard deviation of 15. We will also assign to them them a rating for some other skill. What kind of skill? It doesn't matter. You may imagine it to be chess, business acumen, or basket-weaving, whatever you like. We will suppose, by fiat, that among the whole population, the skill is linearly related to IQ, with no threshold effect. A person's skill also has a component unrelated to IQ. We model this as a Gaussian-distributed noise term whose magnitude is chosen such that the expected population-wide skill-IQ correlation is 0.6. We denote this as ρ. We choose the parameters so that skill has a mean of 1000 and a standard deviation of 100.
Note that the correlation observed for this particular random sample is slightly different from the value of ρ we chose. ρ is the expected correlation, r is the sample correlation. r will be a better and better approximation of ρ as the sample size increases.
To be sure, this is a "spherical-cows-in-a-vacuum" kind of model. We all know the real world is more complicated than this. But even with such a cartoony model, we can investigate the consequences of range restriction.
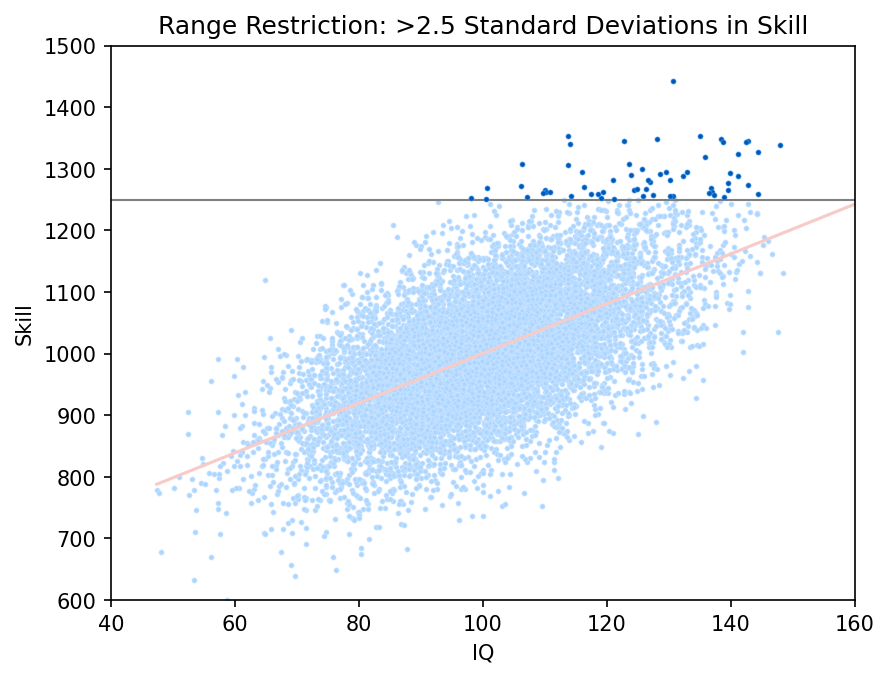
Let's impose a sharp cutoff on the skill-axis, at 2.5 standard deviations, only considering points that lie above it. This crudely approximates a "highly-accomplished" social environment. Then we’ll re-compute the correlation and fit a linear model.
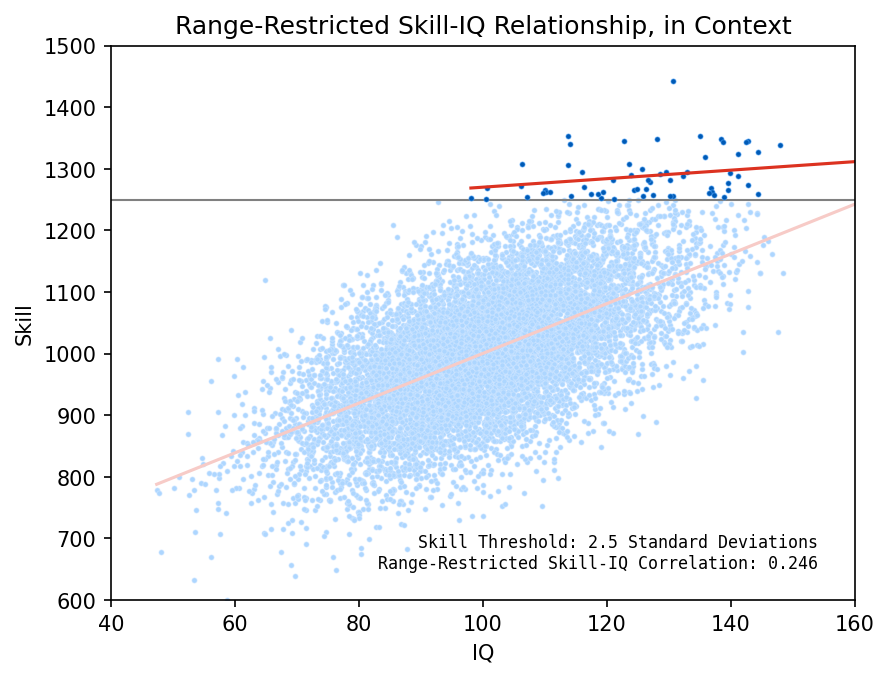
In this range restricted group, the correlation between skill and IQ is much lower. Members of this group would look around them and see that IQ does a poor job of explaining the skill distribution of their peers. From their perspective, it looks like this:
Indeed, the graph shows that the most talented individual has an IQ of about 130. The next tier of skill has IQs between 115 and 150. Meanwhile, the fellow with the highest IQ is in the bottom rung of skill in this group!
It would be easy to imagine that IQ stops working as a predictive tool at the higher levels of human accomplishment. Oh sure, they would say, it might be a good tool to diagnose learning disabilities, but once you exceed some level of sufficiency, one IQ score is about as good as another.
But we know this can't be what's going on in this graph! By construction, our model has no intrinsic threshold; we made it linear through the whole population. The only threshold is one imposed artificially, after the fact, by range restriction.
An animation might make this clearer.
We can see why the people with the highest IQs weren't also the most skilled: super-high IQs are much rarer than moderately-high IQs, meaning the 120-130 IQ range has far more opportunities to hold outliers who beat the odds. The global correlation is after all, imperfect, meaning there are other non-IQ sources of skill variation. The extreme upper tail of the IQ distribution is thinly-populated by definition, so it won't have much effect on the correlation sample statistic.
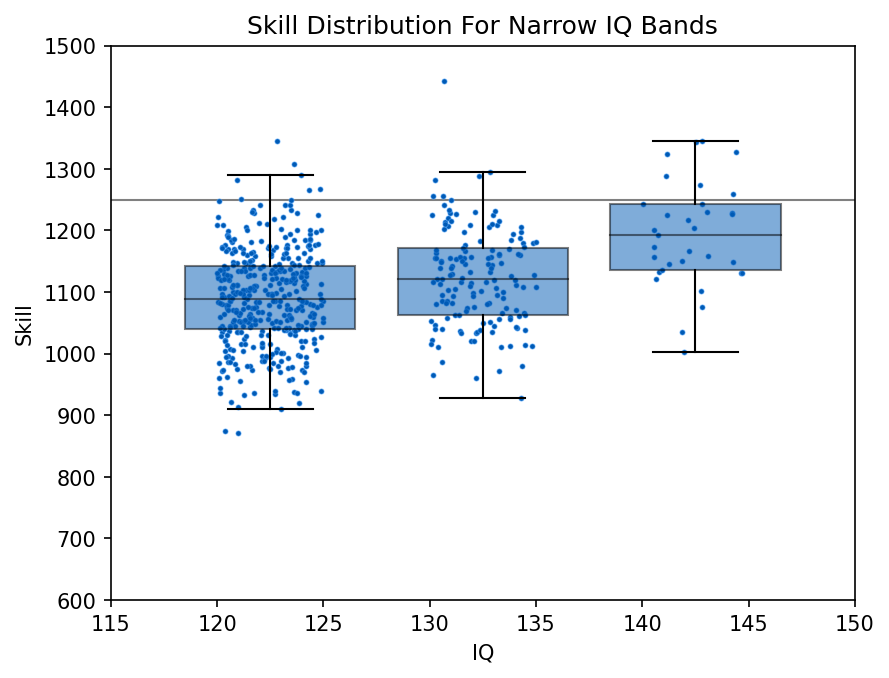
Looking within narrow IQ bands, we can see the variation in skill is about the same in each, and the median level of skill rises monotonically with IQ. So, if you have to recruit a highly skilled group, and measuring true skill is expensive and time-consuming, an IQ test can work as a rough proxy across the whole range of variation. But of course, once you hire such a workforce, the correlation within the group will be attenuated.
Incidentally, this turns out to be a big real-life problem with any job-screening method. You need to validate the criteria against real-world performance, but you can only (easily) measure the real performance of the people you actually hired! You don't see how the people you passed on would have performed. If you forget about that source of sampling bias, you can mistakenly conclude that your screening method isn't effective.
Aside from attenuation, range-restricted sample correlations also show higher variability. We can see this by repeatedly re-running the simulation with a different random seed, and animating the resulting samples. The whole-sample correlation (r₀) is fairly stable around its expected value (ρ₀ = 0.6), while the restricted-sample correlation (rₜ) fluctuates wildly around its lower expected value (ρₜ).
Inside the restricted subgroup, it looks even more chaotic:
The number of points plotted is about the right size to be someone's social circle. The observed skill-IQ correlation in this small elite group has a decent probability of being near-zero, or even negative, purely due to sampling variation. For those samples, an inhabitant might look around himself and conclude that IQ is useless (or worse) for predicting that particular skill. But again, this is happening in a model with no fundamental threshold, and a population-level correlation set at 0.6 by fiat. Generalizing from a range-restricted sample cannot be done naïvely.
This next graph shows how the skill threshold affects the distribution of sample correlations. As we increase the threshold, the sampling variation explodes.
But wait, shouldn't we expect this no matter what, because the sample size is so much smaller? Yes, obviously we should get a noisier estimate with fewer data points. But sample size isn't the whole story.
We can create a "ρₜ-equivalent bivariate Gaussian", i.e., an unrestricted 2D Gaussian distribution that has the same global correlation ρ₀ as the range-restricted distribution's underlying ρₜ (calculated by numerical integration). Then we can sample equal numbers from the two distributions and compare the standard error on their observed correlations.
When we do this, it turns out that the range-restricted distribution still gives more variable sample correlations, and this gets worse the higher the skill threshold.

The main reason for this is the attenuation effect discussed earlier. Consider first an unrestricted bivariate Gaussian with true correlation ρ₀. The standard error on r₀ is given by (1 - ρ₀²)/√N, i.e. it's zero at both ends where ρ₀ is ±1, a maximum in the middle where ρ₀ = 0, and varies smoothly and monotonically with respect to the absolute value of ρ₀.
The range-restricted distribution doesn't follow this equation exactly, but the overall shape is the same. So, since a range-restricted sample has an attenuated true correlation (i.e. `|ρₜ| < |ρ₀|`), the standard error on `rₜ` must be correspondingly higher. And that's just what we see:
In these graphs, the blue dots are from Monte Carlo simulations, and the blue line is fitted to them, since there's no closed form solution for the truncated case. The red line is the (1 - ρ²) equation for the bivariate Gaussian, for comparison.
As you can see, even once we account for the attenuation effect, the standard error on the correlation is still inflated compared to the Gaussian. Meaning, even if you're just trying to estimate the IQ correlation only within the elite skill group, your confidence intervals will be too narrow if you use statistical methods that don't account for the sampling bias. In other words, you'll be overconfident in your conclusions.
To summarize: even in our very simple linear model, range restriction can severely mask or reverse the true relation between two quantities while playing havoc with naïve inference. It can give the appearance of "threshold effects", which aren't really there. We didn't even have to appeal to non-normality in the underlying population; the conditional non-normality resulting from sampling bias is sufficient. Of course, these are just simulations, so they say nothing about whether there is an IQ threshold effect in real life. But I hope it demonstrates why range restriction must always be investigated as an alternative explanation. We used IQ as a motivating example, but the phenomenon is quite general.2 Once you recognize it, you'll start to see it everywhere!
In America, it will usually be said about SAT scores, because
A) more people know their SAT than their IQ, and
B) it's more socially acceptable to reveal your SAT score than your IQ score.
This article will talk about IQ, but it applies just as well for the SAT or any other standardized test.
it is related to Berkson's Paradox.


Thanks. very good. animations particularly helpful.
Interestingly, in the Armed Forces, if proper IQ tests are used, the successful applicants will show very diminished racial differences in ability.
RANGE RESTRICTION DRAMA: In hiring there is a 'debate' that would love both of your input on. It starts with this:
https://www.researchgate.net/publication/232564809_The_Validity_and_Utility_of_Selection_Methods_in_Personnel_Psychology
And the author was working on this follow up before he died:
https://home.ubalt.edu/tmitch/645/session%204/Schmidt%20&%20Oh%20validity%20and%20util%20100%20yrs%20of%20research%20Wk%20PPR%202016.pdf
In the meantime there was this 'takedown' on the focus on cognitive:
https://www.researchgate.net/publication/357440267_Revisiting_meta-analytic_estimates_of_validity_in_personnel_selection_Addressing_systematic_overcorrection_for_restriction_of_range
To which the original author's co-author went with this:
https://www.researchgate.net/publication/372810008_Revisiting_Sackett_et_al's_2022_rationale_behind_their_recommendation_against_correcting_for_range_restriction_in_concurrent_validation_studies
And got the following reply:
https://www.researchgate.net/publication/372810181_Correcting_for_range_restriction_in_meta-analysis_A_reply_to_Oh_et_al_2023
So, who is right???