
The Persistence of Poverty in America
For most of America's poor, poverty is temporary

This was a timed post. The way these work is that if it takes me more than one hour to complete the post, an applet that I made deletes everything I’ve written so far and I abandon the post. You can find my previous timed post here.
Truly persistent poverty is rare in America. The number of people who remain below the official poverty line for a long time is very small; the portion of people who remain truly destitute is even lower yet.
If we followed the people who were below the poverty line in 2007, 2009, 2011, or 2013 through 2018, we’d see that within two years, most of them are already out of poverty. 10 years on, three-quarters of them are no longer below the poverty line!

That chart shows the poverty rate over time for different samples. That means it includes people who entered and exited poverty. But how many people were in poverty the whole time? If we look at continuous poverty spells, we’ll see that group contains even fewer people:

A lot of poverty has to do with people very young or very old. The difference between those groups has to with young people aging into their careers and old people aging out of their careers. One has rising earning power and the other has declining earning power, and as a result, we see that a larger share of the young tend to exit poverty as the years pass by:

It’s true that the young have an easier time exiting poverty, partly because their incomes ‘naturally’ tend to rise, but their initial rates of poverty are considerably higher. Older people who are poor are more select than young people who are.

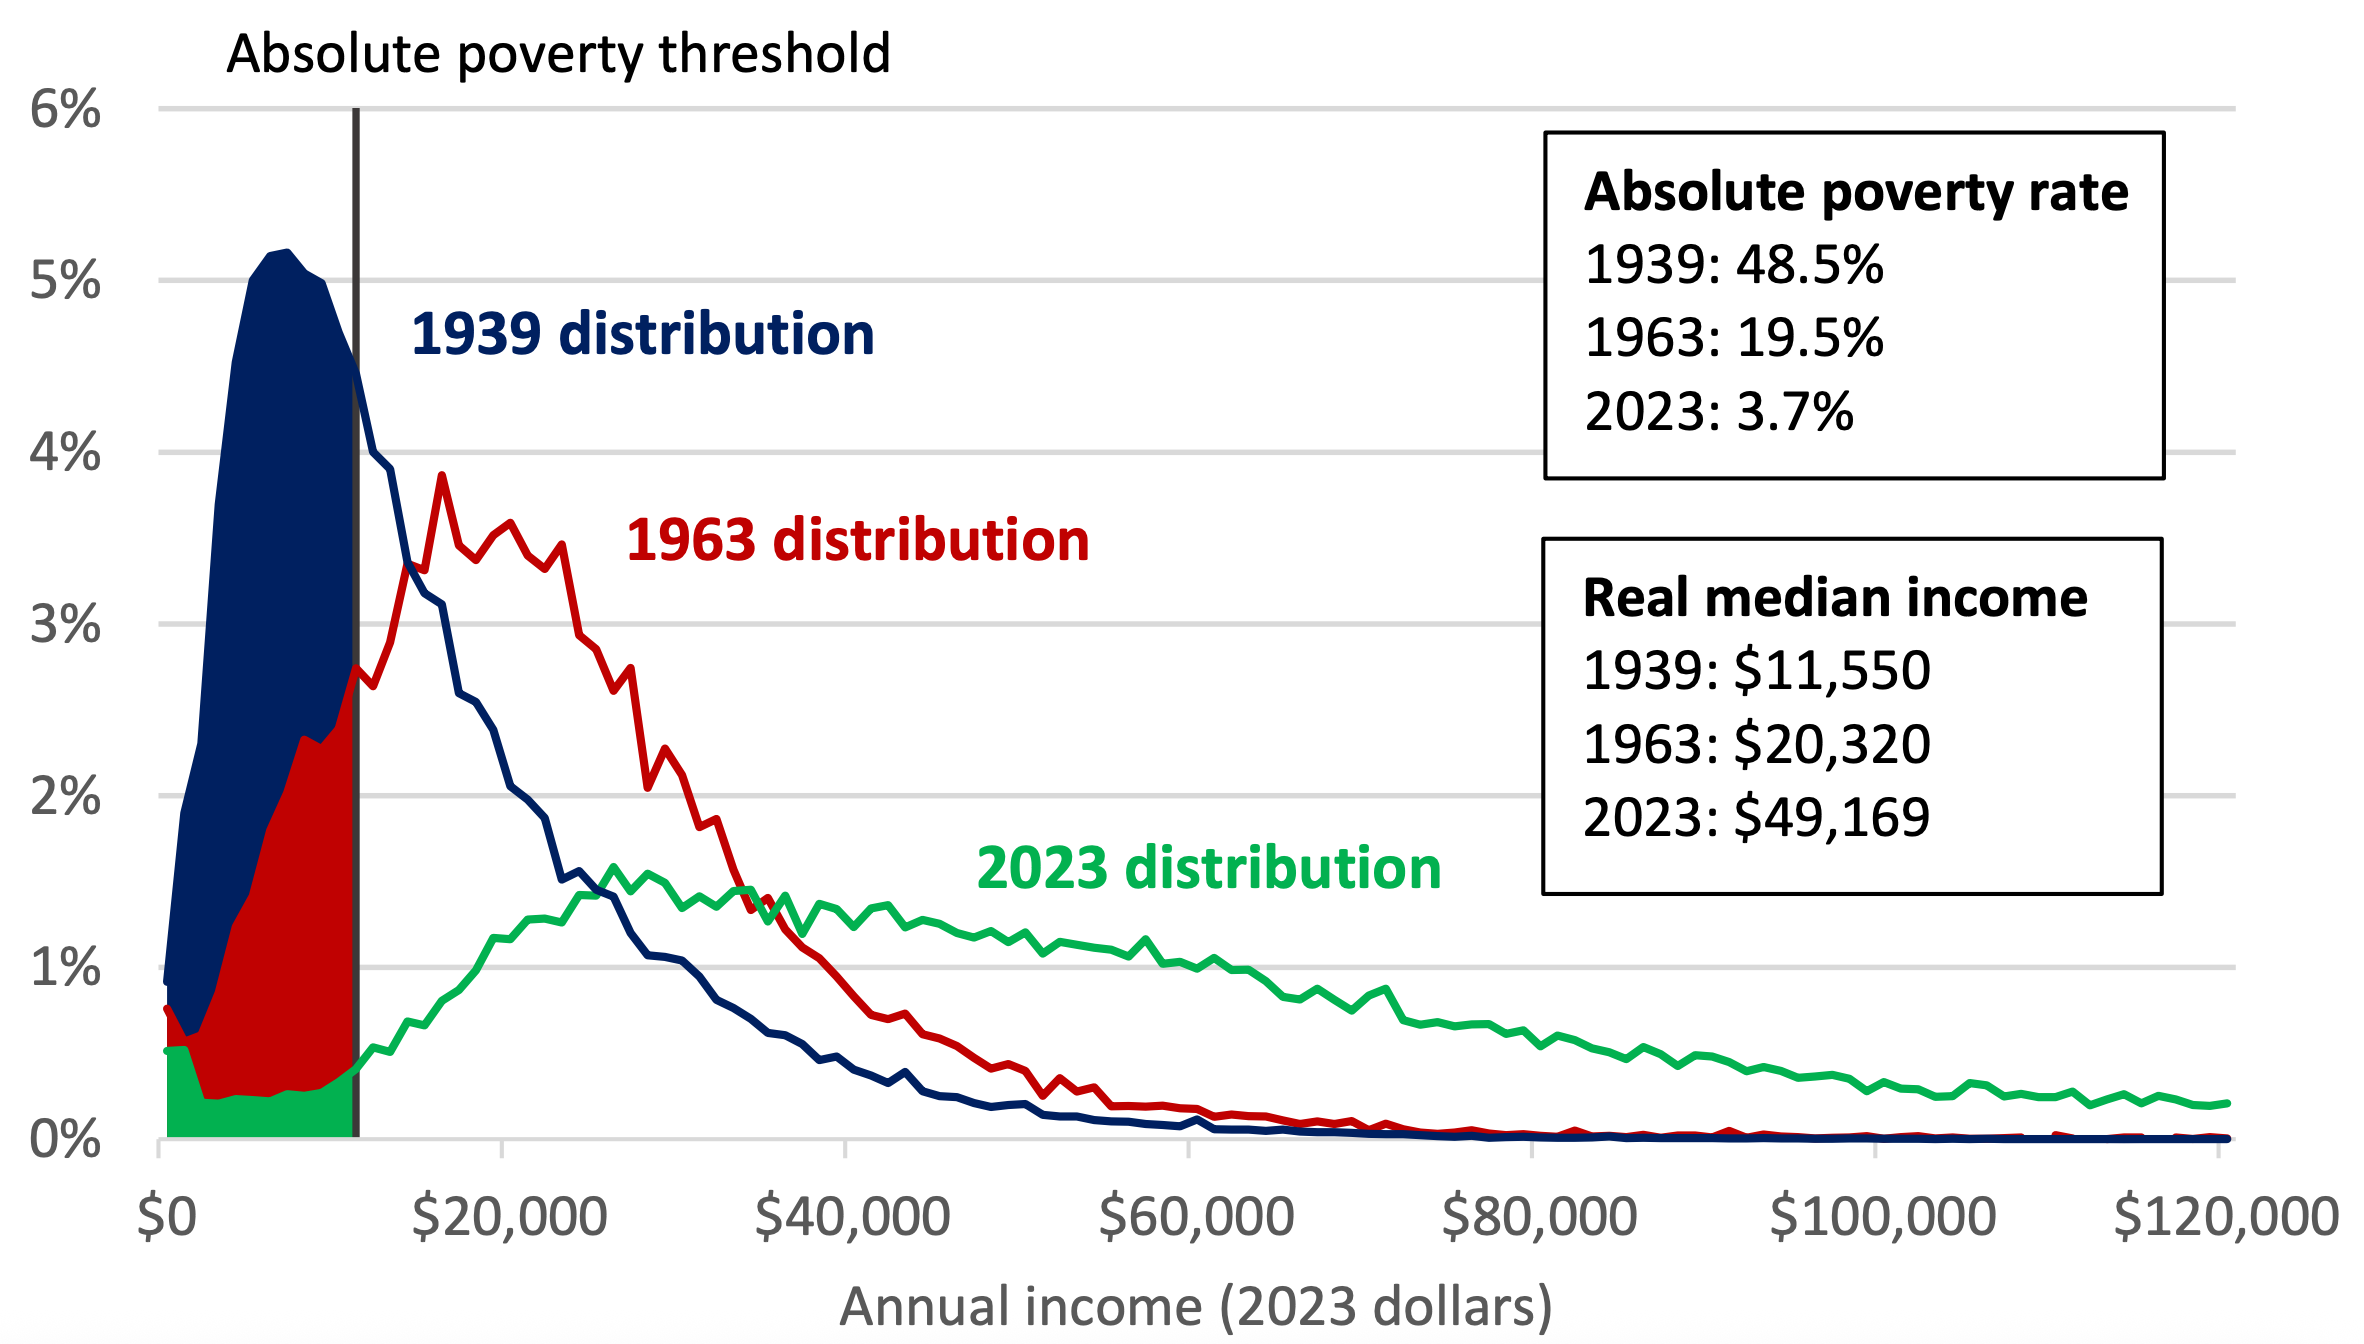
On that note, how persistent has poverty been in America? People may not stay poor, but the poverty rate has been stagnant for decades, right? Perhaps, but that’s because the threshold moves. If we use a consistently defined absolute poverty threshold, we get a different picture: America has practically eliminated poverty since the Great Society reforms took place.

In a very real sense, people do not tend to persist in poverty in America and poverty has not been persistent in America. We should still care about poverty and work to eliminate it, but it’s also worth considering how far we’ve come. Far!
Postscript: Methodological Details and Qualifications
First, the most obvious thing: picking a sample that’s currently in poverty means regression to the mean. The first year is the fastest for poverty reduction for that reason. Similarly, if you select a group of people without capital and check how long it takes their descendants to converge back to the population, you’ll notice that the first generation improves the most markedly because we’ve selected on extremity.
Second, exiting poverty does not mean that people become well off. Typically, those who are in poverty do not become middle- or upper-class. Exceptions largely have to do with age-related poverty. More realistically, it tends to take multiple generations to go from lower- to middle-classdom. We have many illustrations of this fact. For example, consider the fates of different ethnic groups, people with the surname “Olson”, descendants of Ivy Leaguers, and descendants of people with surnames once associated with being very rich:

Alternatively, considers the fates of the Scottish, English, Welsh, and Irish in England:

Or to take an even further back example, consider the fates of the descendants of the richest families in Florence in 1427: as of 2011, they’re still overrepresented at the top of the ladder!
Third, the study on the persistence of poverty in the U.S. used administrative data from the IRS. Because that data is comprehensive, that means it’s more reliable than if the study used the same poverty rate data source the official poverty rate comes from, which is a survey. To get an idea of why, go read my earlier article on how the Current Population Survey (CPS) overstates poverty since it underestimates receipt of welfare. To get an idea of how the discrepancy looks, consider this chart from the study:
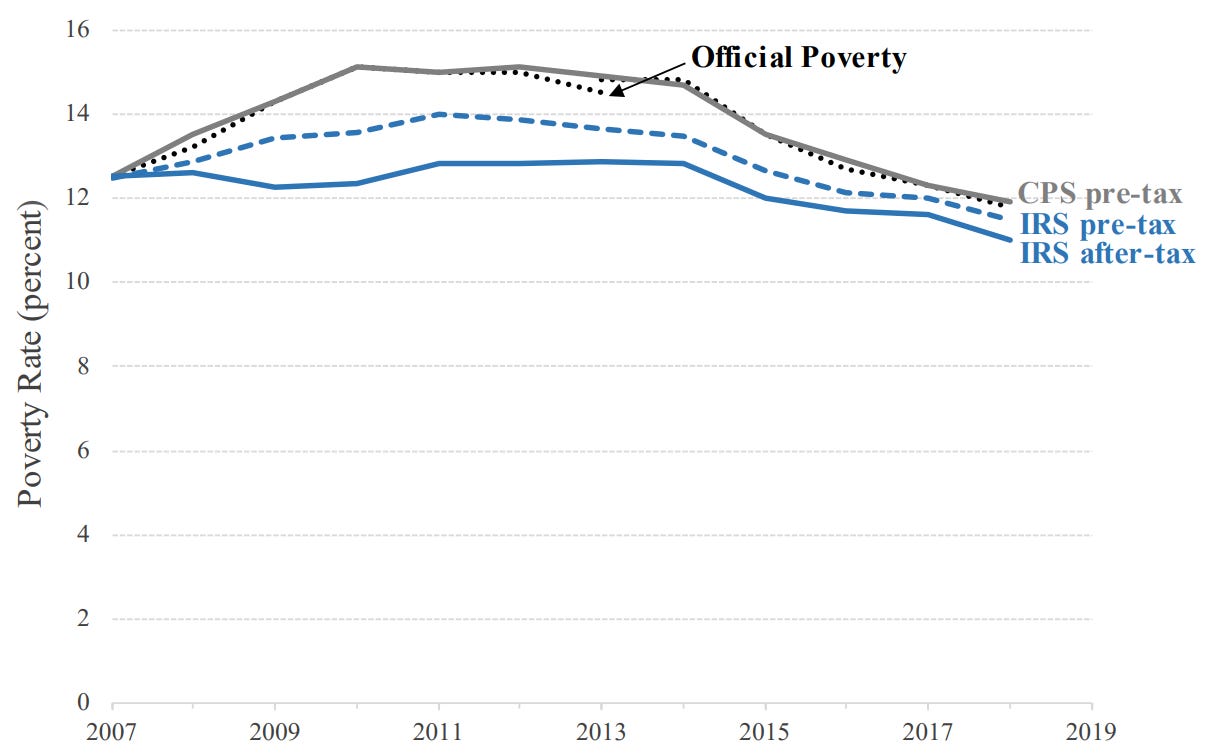
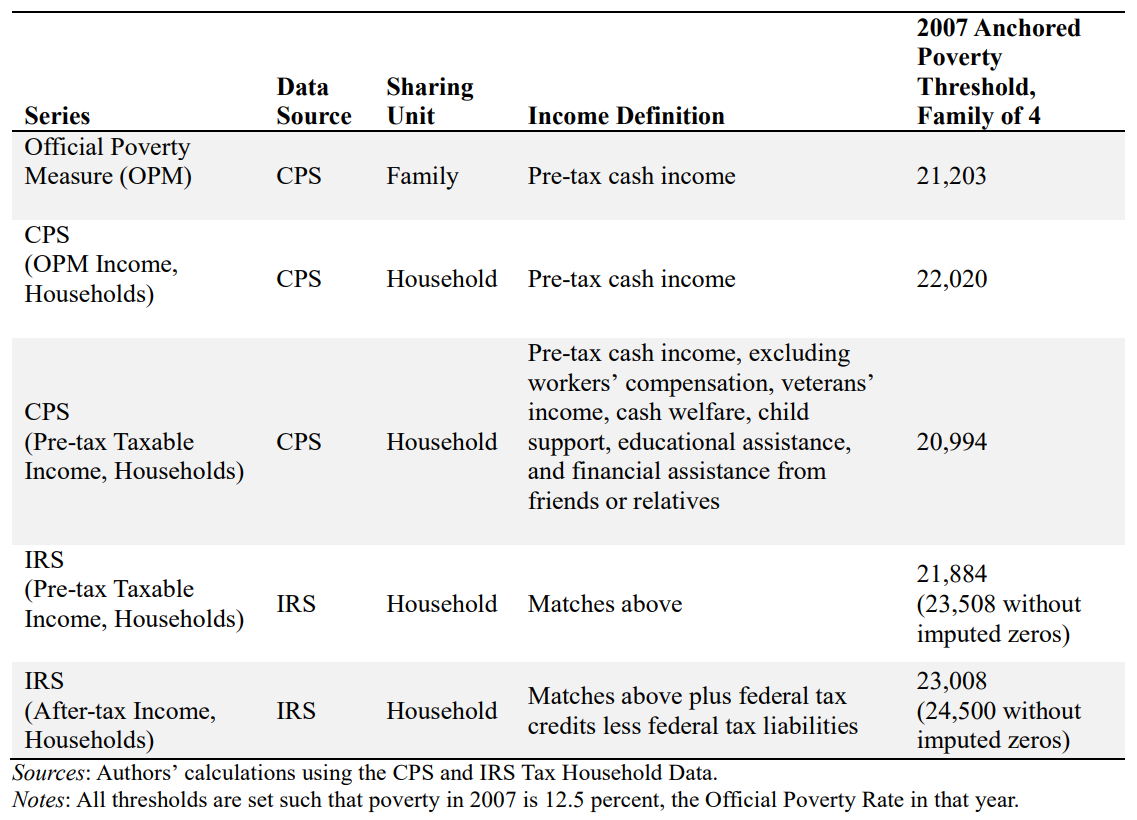
The difference in poverty rates is not huge, but it’s still considerable. To get an idea of why this discrepancy exists, consider the aforementioned difference between survey and administrative data. The income definitions and the levels of aggregation also differ, like so:
February 2, 2026 Update: Demographics, Time, and Poverty
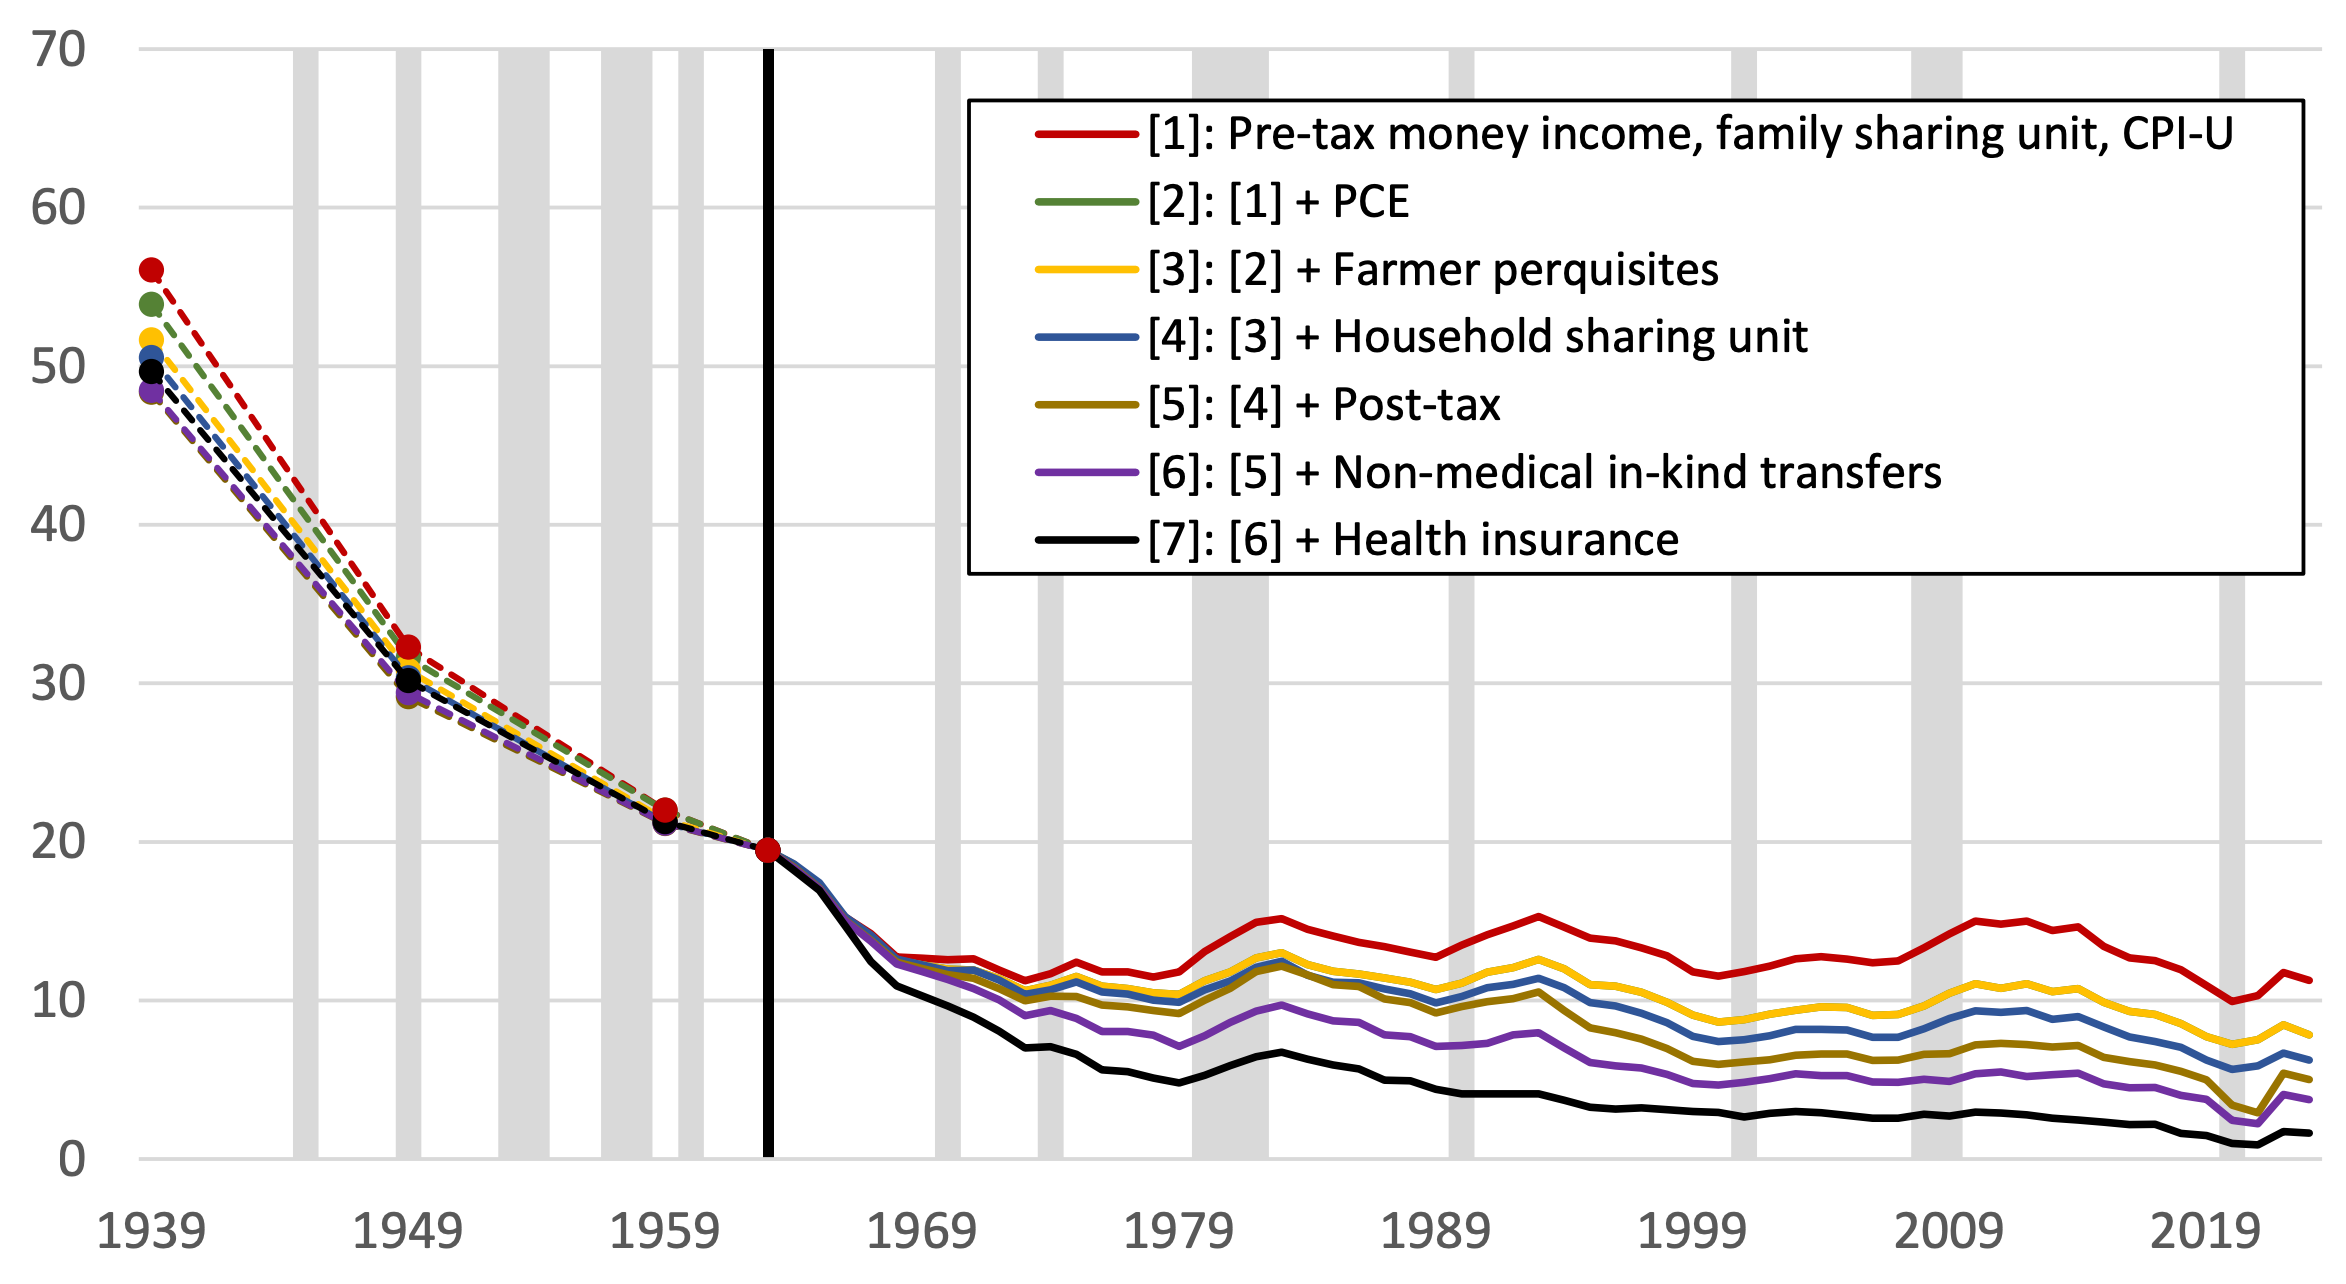
Burkhauser and Corinth have a new preprint on poverty measured in absolute terms. In this paper, they’ve extended the timeline back to 1939 and provided poverty rates split by race and age. Let’s look at the full timeline first:
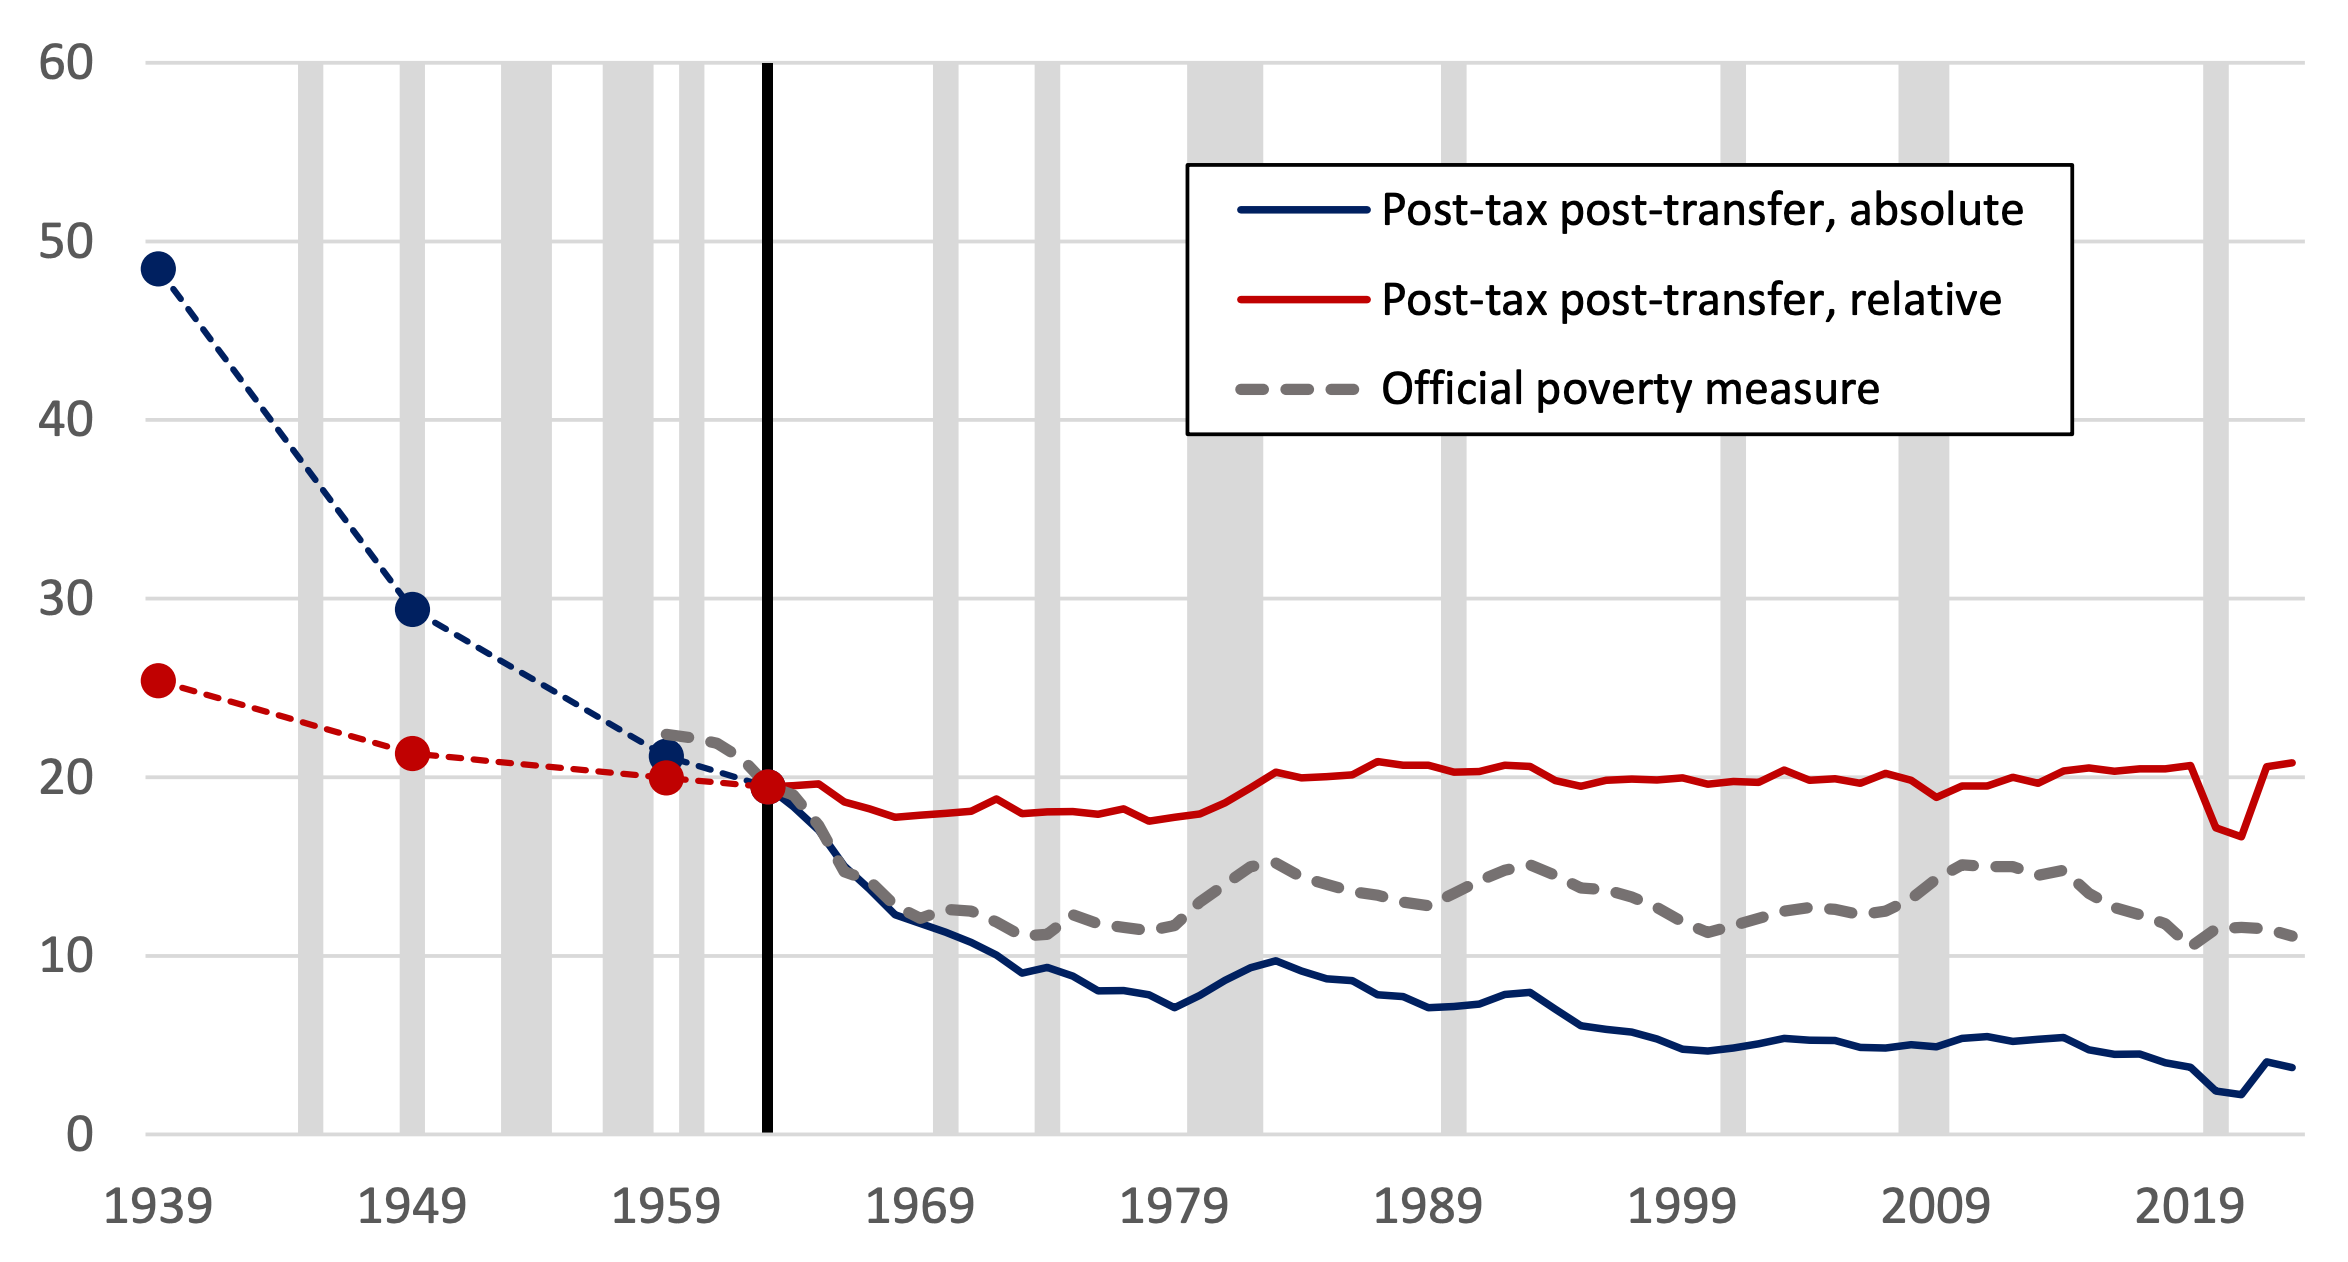
It’s notable that the rate of poverty reduction was greater before the advent of the War on Poverty—that is, poverty reduction via economic growth. But this may simply reflect the statistical fact that the threshold is near the median for 1939 and some part of the slowdown may be due to the fact that income levels have increased in variance over time, which could be a natural demographic development, a reflection of changes in housing policy, regression to the mean, etc.
The paper also shows that, after the War on Poverty begins, transfers and methodological quibbles became more important for the rate of poverty. In any case, the poverty rate is low, moving from a simple, relative to complex, absolute income measure.
Now, onto race and age. As these graphs show, there have been considerable reductions across races and ages, with major convergence by race. This looks like, and maybe explain large parts of, the decline in poverty and convergence across regions.
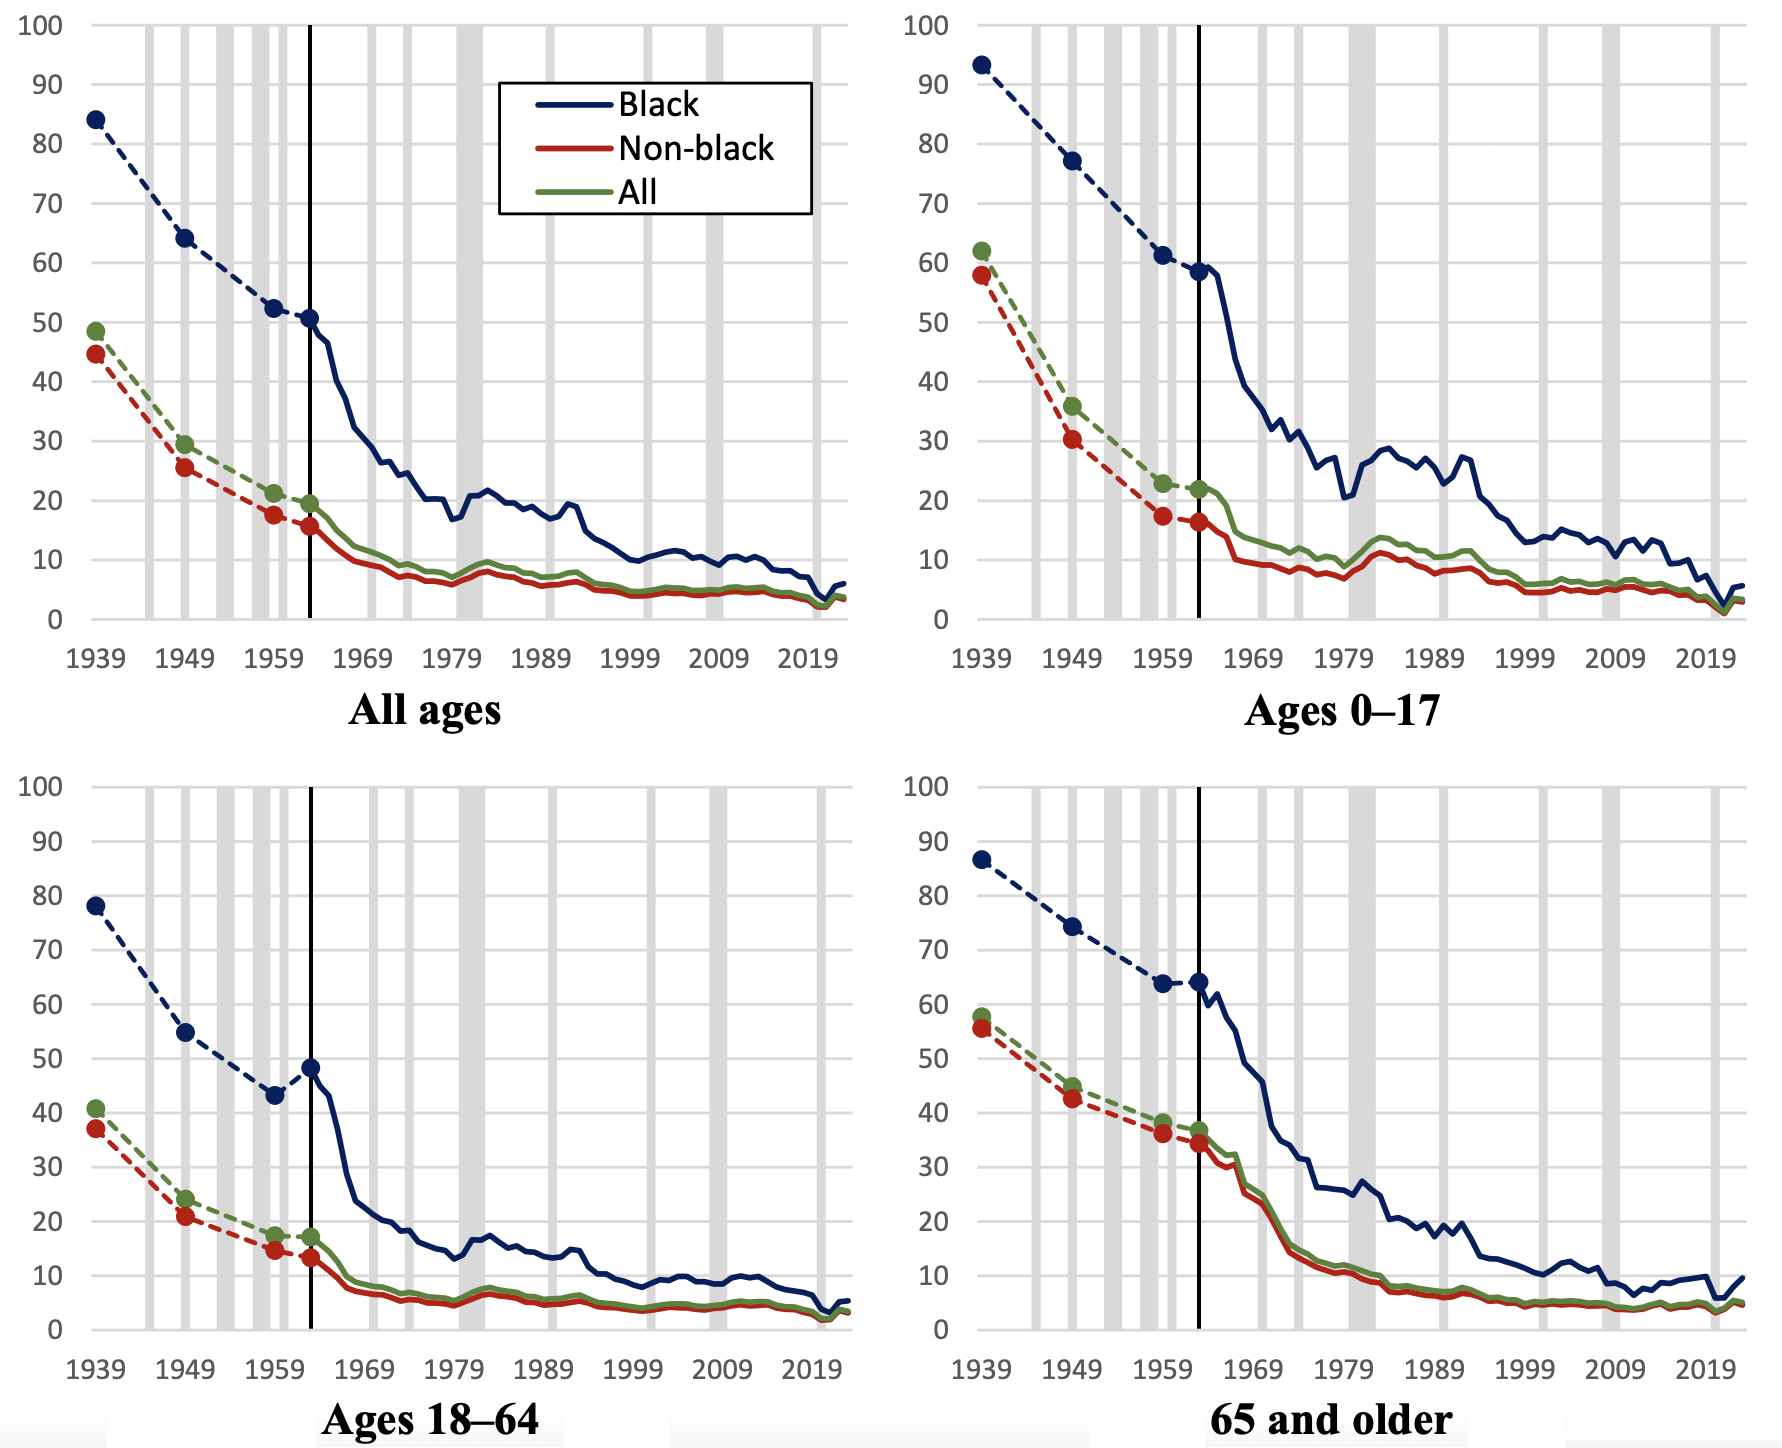
The level of poverty reduction shown in the above set of graphs is amazing. In 1939, nine-tenths of Black children (~93%) were in poverty, whereas in 2023, the rate is just 6%. There’s a smaller percentage who are in poverty in today than who weren’t in poverty in 1939!
Moreover, a large share of the decline of poverty has been due to growth rather than transfers. By market income, 93% of Black kids in 1939 were in poverty and 21% in 2023 were, with half of that reduction coming after the War on Poverty begins.1
The share would have been greater without the War on Poverty, but it’s not at all clear that the poverty rate itself would be lower without said War.
"For most of America's poor, poverty is temporary."
This has been the case for many decades.
This should be the type of information that leads to adjustments to many entitlement programs, given their original purpose. The dependence these programs create, and the perception many people have of them as a form of safety net, make it a difficult proposition, but a smart society should use proper evaluations and adjust accordingly.