
What Went Into the Melting Pot?
A brief history of American immigration between 1610 and 2013

Here’s a broad overview of the historical changes in America’s demographics, the policies guiding those changes, and the contribution of immigration to America’s demographic change and growth.
The Big Picture
During the Colonial Era and the early postcolonial era, virtually all of the immigration to the U.S. was from Britain. This is a touch misleading, however, as the people who move to a place to settle it are not, in fact, immigrants, they are settlers. This distinction bears remembering, because one cannot be an immigrant to a country that doesn’t exist. So the people from this era are of two sorts: settlers—“founding stock”—and, unfortunately, slaves.1
Samuel Huntington distinguished the two groups thusly in Who Are We?: The Challenges to America’s National Identity:
Settlers and immigrants differ fundamentally. Settlers leave an existing society, usually in a group, in order to create a new community, a city on a hill, in a new and often distant territory. They are imbued with a sense of collective purpose. Implicitly or explicitly they subscribe to a compact or charter that defines the basis of the community they create and their collective relation to their mother country. Immigrants, in contrast, do not create a new society. They move from one society to a different society. Migration is usually a personal process, involving individuals and families, who individually define their relation to their old and new countries. The seventeenth- and eighteenth-century settlers came to America because it was a tabula rasa. Apart from Indian tribes, which could be killed off or pushed westward, no society was there; and they came in order to create societies that embodied and would reinforce the culture and values they brought with them from their origin country. Immigrants came later because they wanted to become part of the society the settlers had created. Unlike settlers, they experienced “culture shock” as they and their offspring attempted to absorb a culture often much at odds with what they brought with them. Before immigrants could come to America, settlers had to found America. (pp.’s 39-40)
In these broad terms, here is America’s early population trajectory:

Unfortunately, more granular breakdowns of the White category are not available, and they are certainly not available for the Black category. But there’s already something about the Black category that’s very worth remembering. As Henry Louis Gates Jr. noted based on the Trans-Atlantic Slave Trade Database, the number of slaves imported to North America was just 388,000 of the 10.7 million people who survived the Middle Passage between 1525 and 1866. The Black population of the U.S. exceeded 388,000 some time between 1760 (when it was 325,806) and 1770 (when it was 459,822), suggesting that the most important part of growth for the Black population of the U.S. was only initially importation.
As I mentioned, the primary source of immigration in this era was Britain. But, there were important, but comparatively small contributions, from places like the Netherlands, Finland, France, Czechia, and Germany. Since there aren’t records showing the inflows or other forms of population contribution (like being annexed into the Thirteen Colonies) from these groups, we can proxy their contributions through things like counting congregations. Starke & Finke did exactly that in a publication entitled “American Religion in 1776: A Statistical Portrait”. At the nation’s founding, the distribution of congregations looked like this:

The varied contributions of different European nations are pretty clearly displayed here. Now, it is worth noting that this is the number of congregations, not the number of congregants. These numbers track each other fairly well for the Protestant denominations, but not for the Roman Catholics or Jews, who were concentrated in specific areas.
Maryland has often been dubbed the “Catholic Colony”: “the majority of Catholics (58.9%) were there, even though they made up only 15 percent of church members.” Estimates of the total number of Catholics at the time of the Revolution vary between 40,000 and contemporary estimates of 24,000 from the likes of Archbishop John Carroll in 1785. Notably, Carroll confirmed the concentration of Catholics when he noted that 90% of them resided in Maryland or Pennsylvania.
America was a Protestant nation at its birth, with a small number of Jews and Catholics. The Jews in question—who were acknowledged by founders like George Washington—were, in one way, like both the Catholics and the Dutch and German Reformed congregants: they were almost-all either Spanish, Portuguese, Dutch, or German, making them substantially different from most later Jewish arrivals. The first Jewish arrivals in the northern colonies were like the first Jewish arrivals in the southern colonies, in that they were Sephardic. Unlike them, however, these Jews who arrived in 1654 came from the Netherlands, although they were still Portuguese Jews.
The Catholics were also ethnically-different from later co-religionist arrivals. In some places, Irish Catholics were expressly forbidden from coming to the fledgling colonies, although they nevertheless managed to make it somehow, and Charles Carroll was even a Declaration of Independence signatory. Though later Catholics would largely be Irish, Italian, and finally Hispanic, these Catholics were Irish, French, Spanish, and Portuguese.
The dominating ethno-religious schism in the early history of the U.S. was Protestants versus Catholics, and immigration played a major role in the ability of these two parties to come into conflict for the obvious reason that, if the Catholic population had remained small, they simply wouldn’t have inspired any sort of schism. To understand how the religious picture in the U.S. changed by 1850, we can just plot it:

Now that we’ve seen something of America’s early years, let’s view its population from 1830 to 2020.

That’s the big picture view of America’s population history. It’s broad, the categories are coarse, and America has become a massive nation over time. Notably, America’s growth between 2010 and 2020 from a population size of 309.3 to 329.5 million is aberrant. It’s the first period in America’s history where the White population did not grow; in fact, it’s the first period in America’s history where the White population actively shrank. America is changing.
Immigration and Identity
An unfortunate fact is that no one has good estimates of the proportion of American Whites who come from the nation’s founding stock. A neutral fact is that what has been broadly considered to make someone an American has changed over time. The American identity, much like the American population, has grown.
Settlers and immigrants had different identities, and immigrants changed what America meant over time. In fact, African Americans also contributed to changing what it meant to be American over time, because between 1607 and 1965, American identity included a racial element. I’ve reproduced the broad outline of American identity that Huntington laid out in his Table 3.1:
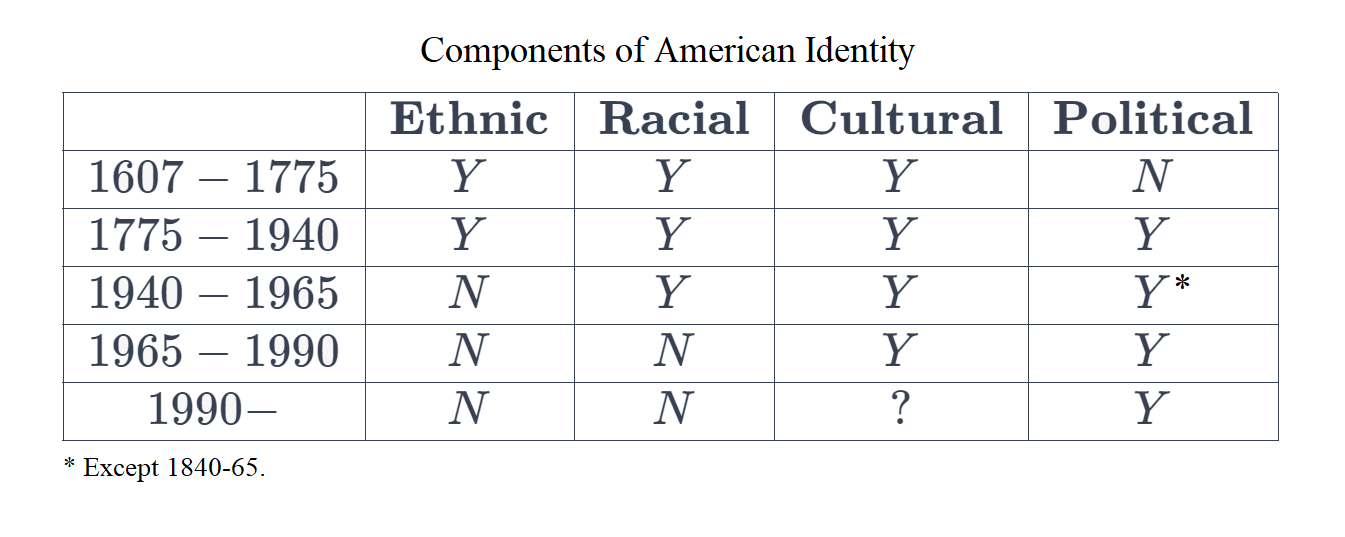
The accompanying paragraph explains the table:
America is a founded society created by seventeenth- and eighteenth-century settlers almost all of whom came from the British Isles. Their values, institutions, and culture provided the foundation for and shaped the development of America in the following centuries. They initially defined America in terms of race, ethnicity, culture, and most importantly, religion. Then in the eighteenth century, they also had to define America ideologically to justify their independence from their home-countrymen. These four components remained part of American identity for most of the nineteenth century. By the latter years of that century, the ethnic component had been broadened to include Germans, Irish, and Scandinavians. By World War II and the assimilation into American society of large numbers of southern and eastern European immigrants and their offspring, ethnicity virtually disappeared as a defining component of national identity. Following the achievement of the civil rights movement and the immigration act of 1965, so did race. As a result, by the 1970s American identity was define in terms of culture and Creed. At this point, the core Anglo-Protestant culture that had existed for three centuries came under attack, raising the prospect that American identity might come to be equated solely with ideological commitment to the Creed.
These changes clearly would not have occurred without a change in America’s ethnic composition and the eventual realization of equality along the lines of race as an ideal that finally gave way to African Americans being considered truly American.
To understand how this happened, know that the U.S. Census Bureau records that the U.S. received 78,377,017 immigrants between 1820 and 2013. In 1820, the U.S. population was 9,638,453; by 2013, it had risen to 316,059,947. Immigration, founder stock births, and immigrant births all made major contributions to the population in the U.S. now. But overall, the most important summary chart is this:

From around America’s founding to the 1940s, it was primarily receiving White immigrants, principally derived from Europe, Canada, and… Oceania?
The Early Era: 1820-81
Between 1820 and 1881, America received some 9,985,008 immigrants. The first thing that sentence might evoke is the question “Why start counting in 1820?” The choice of 1820 as the starting year is purposeful. It has to do with the passage of the Steerage Act in 1819. Prior to the passage of that act, there were simply no decent records of immigrants. But, with its passage, shipmasters were required to maintain records of immigrants they brought to America’s shores. So here we are:

Some of the specific source countries listed in this chart reveal what’s happening with Oceanian immigration: it refers to Australia and New Zealand, not Melanesia, Micronesia, or Polynesia. What really stands out is that the vast majority of America’s earliest immigrants came from Northern and Western Europe. Or in other words, they came from the same places as the nation’s founding stock. Because people from similar parts of the world have more similar cultures and languages with one another than with people further away, this obviously helps with integration. The fact that individuals from these countries also had personalities shifted towards the typical American also helped.
Looking to more distant cultures, of the 229,280 Eastern Asian immigrants, 228,945 were from China. Similarly, every one of the 25,119 Central American immigrants was supposedly from Mexico. The closest culture to America’s is, of course, found in Canada, and it supplied a respectable number of immigrants for its size as well.
Some of this immigration is odd. It does not represent immigration and the attainment of citizenship and, indeed, it cannot. The simple reason for this is that since the Naturalization Act of 1790, one could only become naturalized if they were a “free white person” who had “good moral character”, and had lived in the country for at least two years. In 1795, the residency requirement was extended to five years, and in 1798, to fourteen years. Regardless, the U.S. clearly wanted to maintain its racial composition from the 1790 Census, when it was ethnically 66.2% English, 5.6% Scottish, 4.5% German, 2% Dutch, 1.6% Irish, 0.5% French, 0.27% Whites of unknown origin, in addition to 17.8% slaves, 1.3% non-White freemen, and 0.19% Amerindian.
The shipmaster records these data were compiled from were reported to the Secretary of State, who reported them to Congress, who stored the records. But, the Steerage Act did not limit immigration. With the passage of the Passenger Law of 1847 and its namesake in 1855, immigration was not limited per se, but it was regulated: passenger ships docking in the U.S. had to provide a minimum of deck space per passenger, so arrivals had to arrive in relative comfort. This didn’t explicitly limit the number of immigrants, but it made it more costly to come to the U.S., so immigrants became more selected for preexisting wealth. Since Western and Northern Europe were wealthier than other regions of Europe that could have furnished White immigrants, this might have reinforced their dominance in immigrant inflows.
California became the 31ˢᵗ state to join the union on September 9ᵗʰ, 1850. In the year of its founding, California imposed a tax on foreign miners amounting to $20 per month. Using the Bureau of Labor Statistics’ CPI calculators I found with a quick Google, that amounts to $789.20 today. That’s a sizable monthly bill that proved so unpopular that it was repealed in 1851. But, losing no time, the California legislature reenacted the bill in 1852, albeit at a monthly tax of $4 ($159.89 today) instead.
California didn’t enact this tax to raise revenues. What California was doing was making it hard to live as a foreigner. This amounted to the first explicit attempts to limit immigration. To compliment this obscene monthly bill, they also enacted the Anti-Coolie Law, which was formally titled “An Act to Protect Free White Labor against Competition with Chinese Coolie Labor and to Discourage the Immigration of the Chinese into the State of California.” One of the bill’s stipulations was that, if you were Chinese, you had to pay $2.50 for mining or business licenses. This was no explicit ban on entry, but it was a tax on living, with, well, stated intent.
California led the way in laws against immigrants and the federal government lagged behind. At some points, California and the federal government even butted heads when it came to immigration law. For example, due to labor shortages attributable to the Civil War, the Immigration Act of 1864 encouraged foreign laborers to come to the U.S. The Naturalization Act of 1870 went further than this and strongly contravened California’s efforts by giving Blacks, Amerindians, and some Filipinos citizenship.
The matter of necessity for the Union in the Civil War radically altered the perception of immigrants and greatly increased the acceptance of the Irish especially. The reason for this was that the Confederacy and the Union both started as Anglo-Saxon nations, but the army of the Union ended up being 25% foreigners, with an additional 18% of their soldiers born to at least one foreign-born parent. This compares to 5% of the Confederacy’s military who had foreign parentage. This is somehow mainstream knowledge.
From Reconstruction to World War: 1882-1920
Between 1882 and 1920, 22,986,644 immigrants made their way to the U.S.

Notice the compositional shift. In this era, the most common sender was none other than Eastern Europe, which disproportionately sent Jews. Western Europe had even fallen behind Southern Europe, which disproportionately referred to Italians and, particularly, southern Italians. Canada, again, made a powerful showing relative to their own population. Also, once again, Australia and New Zealand found themselves the only members of Oceania that were even present on the board.
One of the most interesting shifts in this era was in the composition of Eastern Asian immigrants. East Asian immigrant inflows in the 1820-81 era were nearly 99.9% Chinese. But now, the inflows from Eastern Asia were only 3.4% Chinese. The major East Asian contributor now was Japan. The curious visitor to upstate New York’s Remington museum might walk away wondering why this paragon presenter of the American experience was friends with so many White people who loved Japan, who decorated their homes in Japanese style, who had statues and memorabilia galore from Japan, etc. That has to do with these inflows.
Something else worth noting at this point is that the meaning of inflows from the Caribbean, Pacific Islands, Western Asia, and the like has changed over time. Caribbean immigrants were primarily White, not Black like they are today; Pacific Islanders were not the people coming from the Pacific Islands. Instead, the people who came were Brits, Germans, Portuguese, etc. The people coming from Western Asia were not Palestinians, they were Jews, Christians, exceptionally White-appearing Berbers, and so on. Even the inflows from Southern Asia were primarily not Indian per se, they were largely British. This isn’t to say that no “diversity” came from those regions, but the inflows were—if we’re being frank—basically just additional sources of Englishmen and Scots. Even the inflows from Central America weren’t Hispanics as we know them today, they were Castizos and Peninsulares, not Mestizos, Zambos, other varieties of slave descendants, or Amerindians.
Shortly before this era began, the U.S. instituted its first actual restriction on immigrants. This came in the form of the Page Act of 1875. The Act banned “undesirables”: Asian women who might become prostitutes; Asians who might be forced to labor, and; all people who were convicted in their countries of origin. Shortly after this era began, the U.S. instituted the Immigration Act of 1891, barring entry to anyone who was infected with a disease, who was a polygamist, or who had received a conviction for moral turpitude in their country of origin. For example, if someone was convicted of being a homosexual, that warranted barring their immigration.
The inflows between 1876 and 1881 were 87.8% Northern and Western European and fully 31.4% Scandinavian, with a generous 19.4% Irish, 16% German, 15.3% British, and 5.8% from other parts of Northwestern Europe. As the chart above shows, that obviously changed. That change had to do with fleeing from pogroms, but it also had to do with the demand for foreign labor and the reaction to foreign labor. For example, consider how California’s Gold Rush era came to an end in the 1850s and the transcontinental railroad completed in 1869. With the end of those eras and projects, why bring in Chinese workers? Given the extensive use of those Chinese workers and the poor labor market during the 1873-79 Long Depression, anti-Chinese sentiment grew, and that also made it less attractive to come to the U.S. if you were Chinese. This all makes sense if you believe that Lee Chew’s Biography of a Chinaman was an honest account.
Immigration restrictions grew in this era in a profound way. For example, the Alien Contact Labor Law of 1885 prohibited people from entering the U.S. as contractor laborers unless the person in question was vital to the establishment of a new trade or industry. But, it was preceded by the reason for picking this era’s starting date and the last paragraph’s subject: the Chinese Exclusion Act. Enacted in 1882, the Chinese Exclusion Act restricted immigration to the U.S. to a substantial degree by simply forbidding Chinese people from coming to the U.S. for ten years. As the act expired, it was replaced by the Geary Act in 1892, giving it another ten years of life. As that act expired, it was replaced by the Scott Act in 1902, but in order to stop the process of renewals from taking place in 1912, this act simply made the ban on Chinese immigrants permanent.
The Chinese Exclusion Act is a good place to start a descriptive era, but so too is the Immigration Act of 1882. This act forced each immigrant to pay fifty cents on entry, and it also forbade the entry of anyone who was insane or who immigration officers believed would become a burden on the state. Another good time to start this era might have been 1901, if only because, that year, President William McKinley was assassinated by a Polish socialist anarchist. Shortly after McKinley was assassinated, in 1903, Congress passed the Anarchist Exclusion Act, which barred the immigration of anarchists, epileptics, homeless people, and pimps.
This really was America’s “Golden Era” when it came to the volume of immigration regulations Congress produced. This becomes even more certainly true when you consider that this was also the era in which the U.S. embarked on its first informal immigrant restrictions. The first such major informal restriction followed the Naturalization Act of 1906, which made English-language knowledge a citizenship requirement. This informal agreement was the 1907 Gentleman’s Agreement between the U.S. and Japan. Its details are simple: the American government would make an effort to reduce discrimination against Japanese Americans and wouldn’t explicitly restrict Japanese immigration, and Japan would hold up their end of the bargain by voluntarily restricting Japanese immigration to the U.S.
In the same year as the Gentleman’s Agreement, the real proof that this was the peak era for immigration restriction sentiment cropped up: the Dillingham Commission.

The Dillingham Commission was established to investigate how immigration affected the U.S. in every way. The Commission was supposed to take an empirical approach to the issue, and its members traveled around, consulted scholars, looked at how immigrants were assimilating first-hand, went to the sources of immigrants to learn more about their cultures and how compatible they might be with American culture, and so on.
When their investigation was through and they were ready to render their conclusions, they argued the U.S. should drastically reduce immigration from Eastern and Southern Europe. They recommended things like
Considering immigrant quality and quantity with respect to their ability to assimilate
Putting the well-being of native Americans (i.e., non-immigrants) above immigrants
Continuing to allow immigrants whose skills were vital to new industries
Forbidding the immigration of criminals and deporting those who would become criminals in addition to international cooperation to facilitate the verification of immigrant criminal backgrounds
Deporting immigrants who became burdens on the public purse
Barring prostitutes from immigrating
Deporting immigrants who made remittance payments, as those indicated non-assimilation
Giving states the opportunity to report how many agricultural workers they needed, so immigrants could be sought for this field particularly
Extending the ban on Chinese laborers to include East Indians, and being more skeptical to the Japanese and Koreans
Banning immigrants who had no intention of staying and becoming Americans
Keeping out the illiterate, establishing racial quotas2, limiting entry numbers for particular ports, increasing required assets on arrival, increasing the head tax for entry, reducing the head tax for skilled immigrants who have families, and more.
The old and the new immigration differ in many essentials. The former was… largely a movement of settlers… from the most progressive sections of Europe…. They entered practically every line of activity…. Many of them became landowners…. They mingled freely with the native Americans and were quickly assimilated. On the other hand, the new immigration has been largely a movement of unskilled laboring men who have come… from the less progressive countries of Europe…. They have congregated together in sections apart from native Americans and the older immigrants to such an extent that assimilation has been slow.
I think their views were abundantly clear, and their policy success3 was unequivocal. In the same year the Dillingham Commission was started, the Expatriation Act was also enacted. This act declared that American women who married foreign nationals were to lose their citizenship. This stipulation was repealed with the Cable Act of 1922, but it remained in force for the particular case of Asian foreign nationals, and this would only be removed entirely in 1931, with the option for reversal for those affected only coming about in 1940. Two years after the Commission reported their findings, California also enacted a similarly exclusionary act, the Alien Land Law. This law forbade people who were ineligible to become citizens from purchasing land, and several other states followed suit.
The Immigration Act of 1917 put the Dillingham Commission’s advice into action and established the “Asiatic Barred Zone”, so that only Japanese and Filipinos could immigrate from Asia. Because of the Gentleman’s Agreement and the Philippines’ status as a protectorate, this effectively meant the end of Asian immigration. The power to do everything else the Dillingham Commission desired with respect to importations would be elaborated the following year, when the Immigration Act of 1918 gave the U.S. government the power to deport “undesirables”, including, mainly, leftist activists.
America’s Restrictionist Era: 1921-51
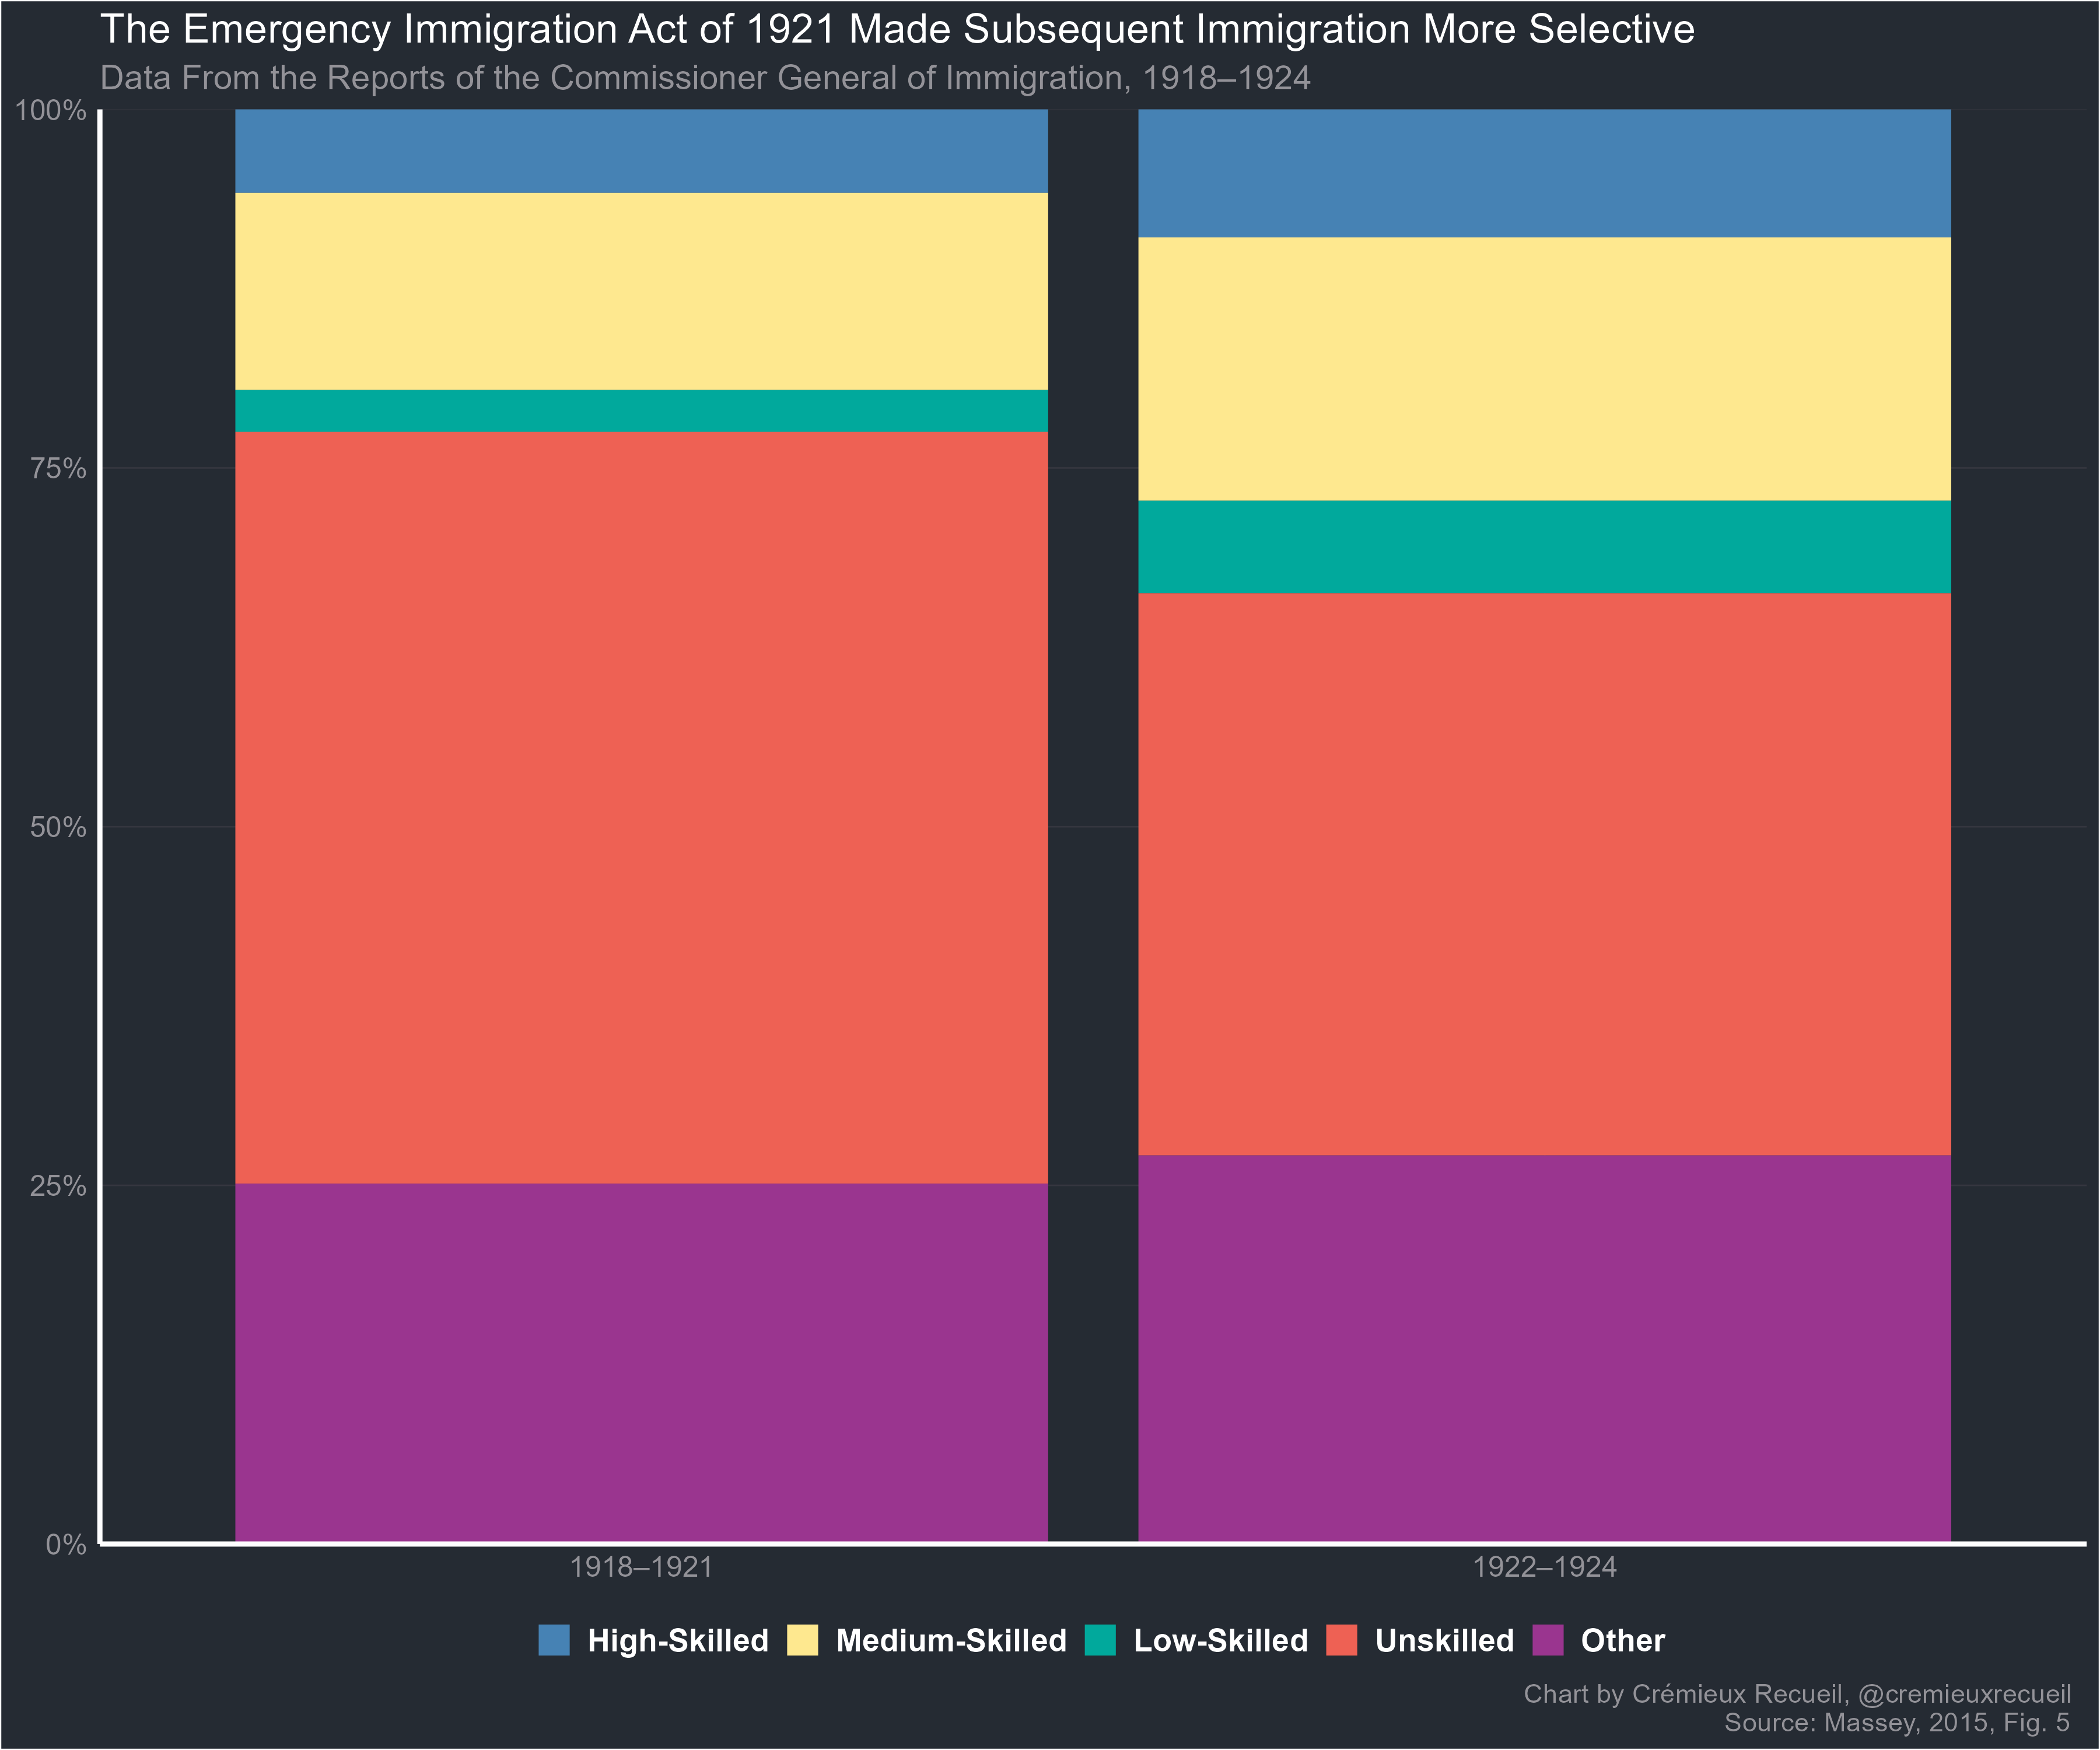
Where 1882-1920 was the peak of restrictive sentiment, 1921-51 was the peak of immigration-restricting legislation. The acts passed in this era made powerful changes to immigration, starting with the Emergency Quota Act of 1921. This act, and the later Immigration Act of 1924, are why this era only featured 6,305,238 immigrants.4

The compositional changes that resulted from the Emergency Quota Act should be obvious from what it did: it limited inflows to 3% of the 1910 U.S. population derived from a given country in 1910. But at the same time, Canada was not affected. That is why Canada makes such an outsized appearance here, in addition to Canada becoming a funnel for outside immigrants to represent themselves as Canadians.
This change made immigration more selective with respect to occupational class:
Another way to look at this is to compare arrivals at different ports to Canadians:

The finding that immigration restrictions lead to more selective immigration is fairly obvious and straightforward. If it’s harder to immigrate, immigrants will obviously end up higher-quality and fewer in number.5 This has replicated numerous times, in numerous places, including in the U.S. three-quarters of a century later, when the 2006 Secure Fence Act may have simultaneously reduced immigrant numbers, while increasing their quality.6 But we must digress: the point is that this restriction worked to reduce immigrant numbers, with all the expected results if barriers matter.
The Immigration Act of 1924 went further than the Emergency Quota Act by limiting immigration to just 2% of a population’s 1890 share. But this quota was revised to have its basis in the 1920 population in 1927, and the National Origins Formula updated in 1929 barred Asian immigration completely, while capping the immigration quota at 150,000, with roughly 85% of the weight assigned to Northern and Western European countries, with no limits on countries in the Western Hemisphere.
In 1934, the Asian immigration situation became worse for Asians, when the Tydings-McDuffie Act promised the Philippines its independence while stripping Filipinos of their U.S. citizenship. In the decade before this law, two Asians attempted and failed to follow John Svan’s example.
For reference, John Svan was the person who, in 1908, went to court to argue that Finns were White, and thus capable of becoming citizens. The prosecutor in this case, one John Sweet, made the case that Finns had an ancient origin in Asia, and were thus “Yellow” Mongols. Furthermore, Sweet argued, John Svan was a socialist, thus proving that he was of an Asian, collectivist frame of mind, unlike the White men who resided in America. But the judge ruled that, even though Finns might have Asian ancestors, their environment and their more recent admixture with Germanic peoples made them obviously White, and thus capable of becoming citizens. Takao Ozawa’s 1922 attempt to argue that Japanese could become citizens, and Bhaghat Singh Thind’s 1923 attempt to argue that Indians could become citizens, were much less successful.
In 1940, the Alien Registration Act was enacted and all aliens over the age of 14 were fingerprinted and registered. Clearly, the law in this era of rapidly increasing state capacity was powerfully set to the purpose of restricting immigration.
Prior to this time period, Americans did not like immigrants. America was not celebrated as a “nation of immigrants”. But, perhaps as a reaction to all of this legislation or against anti-immigrant sentiment by recent, naturalized arrivals, that sentiment started to change. As Huntington noted:
After the prohibition of large-scale immigration in 1924… attitudes toward America’s immigrant heritage began to change. That change was dramatized by President Franklin Roosevelt’s famous challenge to the Daughters of the American Revolution in 1938: Remember, remember always, that all of us, and you and I especially, are descended from immigrants and revolutionists.” [….]
[Claims of this nature] are valid partial truths, but false total truths. Roosevelt was partly wrong when he suggested that all Americans were descended from “revolutionists”; he was totally wrong when he suggested that he and his DAR audience were (at least in their name line) descendants of “immigrant.” Their ancestors were not immigrants but settlers, and in its origins, America was not a nation of immigrants, it was a society, or societies, of settlers. (pp.’s 38-39)
And so, despite the power of the law acting to limit immigration to previously untold degrees, sentiment on immigration began to shift towards a more favorable stance that was first clearly revealed with the Magnuson Act of 1943.
This act reversed the Chinese Exclusion Act of 1882, but the National Origins Formula was kept in place, so only 105 Chinese could immigrate each year. Perhaps the contact effect of World War II experience accelerated the demise of anti-immigrant sentiment. After World War I, the perceived need for economic self-sufficiency might have reduced the sentiment growing then, but clearly no such need was felt after World War II. And indeed, the fact that World War II led to a prolonged foreign presence might have made the contact effect that much more intense, because it promoted family formation with foreigners. This is why there was the War Brides Act of 1945 and its amendment to include Chinese women in 1946, followed by the Alien Fiancées and Fiancés Act of 1946, and then the later amendment to include Korean and Japanese war brides in 1947. In 1946, there was also the Luce-Celler Act, which allowed 100 Filipinos and 100 Indians per year to immigrate to the U.S., while also letting them naturalize domestically. The 1948 Displaced Persons Act also came in this period, and it allowed nearly 200,000 refugees from the Baltic nations of Estonia, Latvia, and Lithuania come to the U.S. too. The 1953 Refugee Relief Act allowed for a further 200,000 refugees per year.
The Baby Boom and Civil Rights: 1952-67
1952 marked the turn of another era with the passage of the McCarran-Walter Act, which is more often referred to as the Immigration and Nationality Act of 1952. Congress passed this act in defiance of a presidential veto, and they immediately ended race as a barrier to immigration and naturalization, allowed families to enter the U.S. without quotas, and altered the National Origins Formula so it didn’t favor Northern and Western Europe quite as much, although the difference was fairly minor in absolute terms. The act also set the total quota for immigrants at one-sixth of one percent of the U.S. population and it placed restrictions on British colonial immigrants, while also making immigrants who married American women exempt from the quotas. This short era saw America receive some 4,432,522 immigrants.
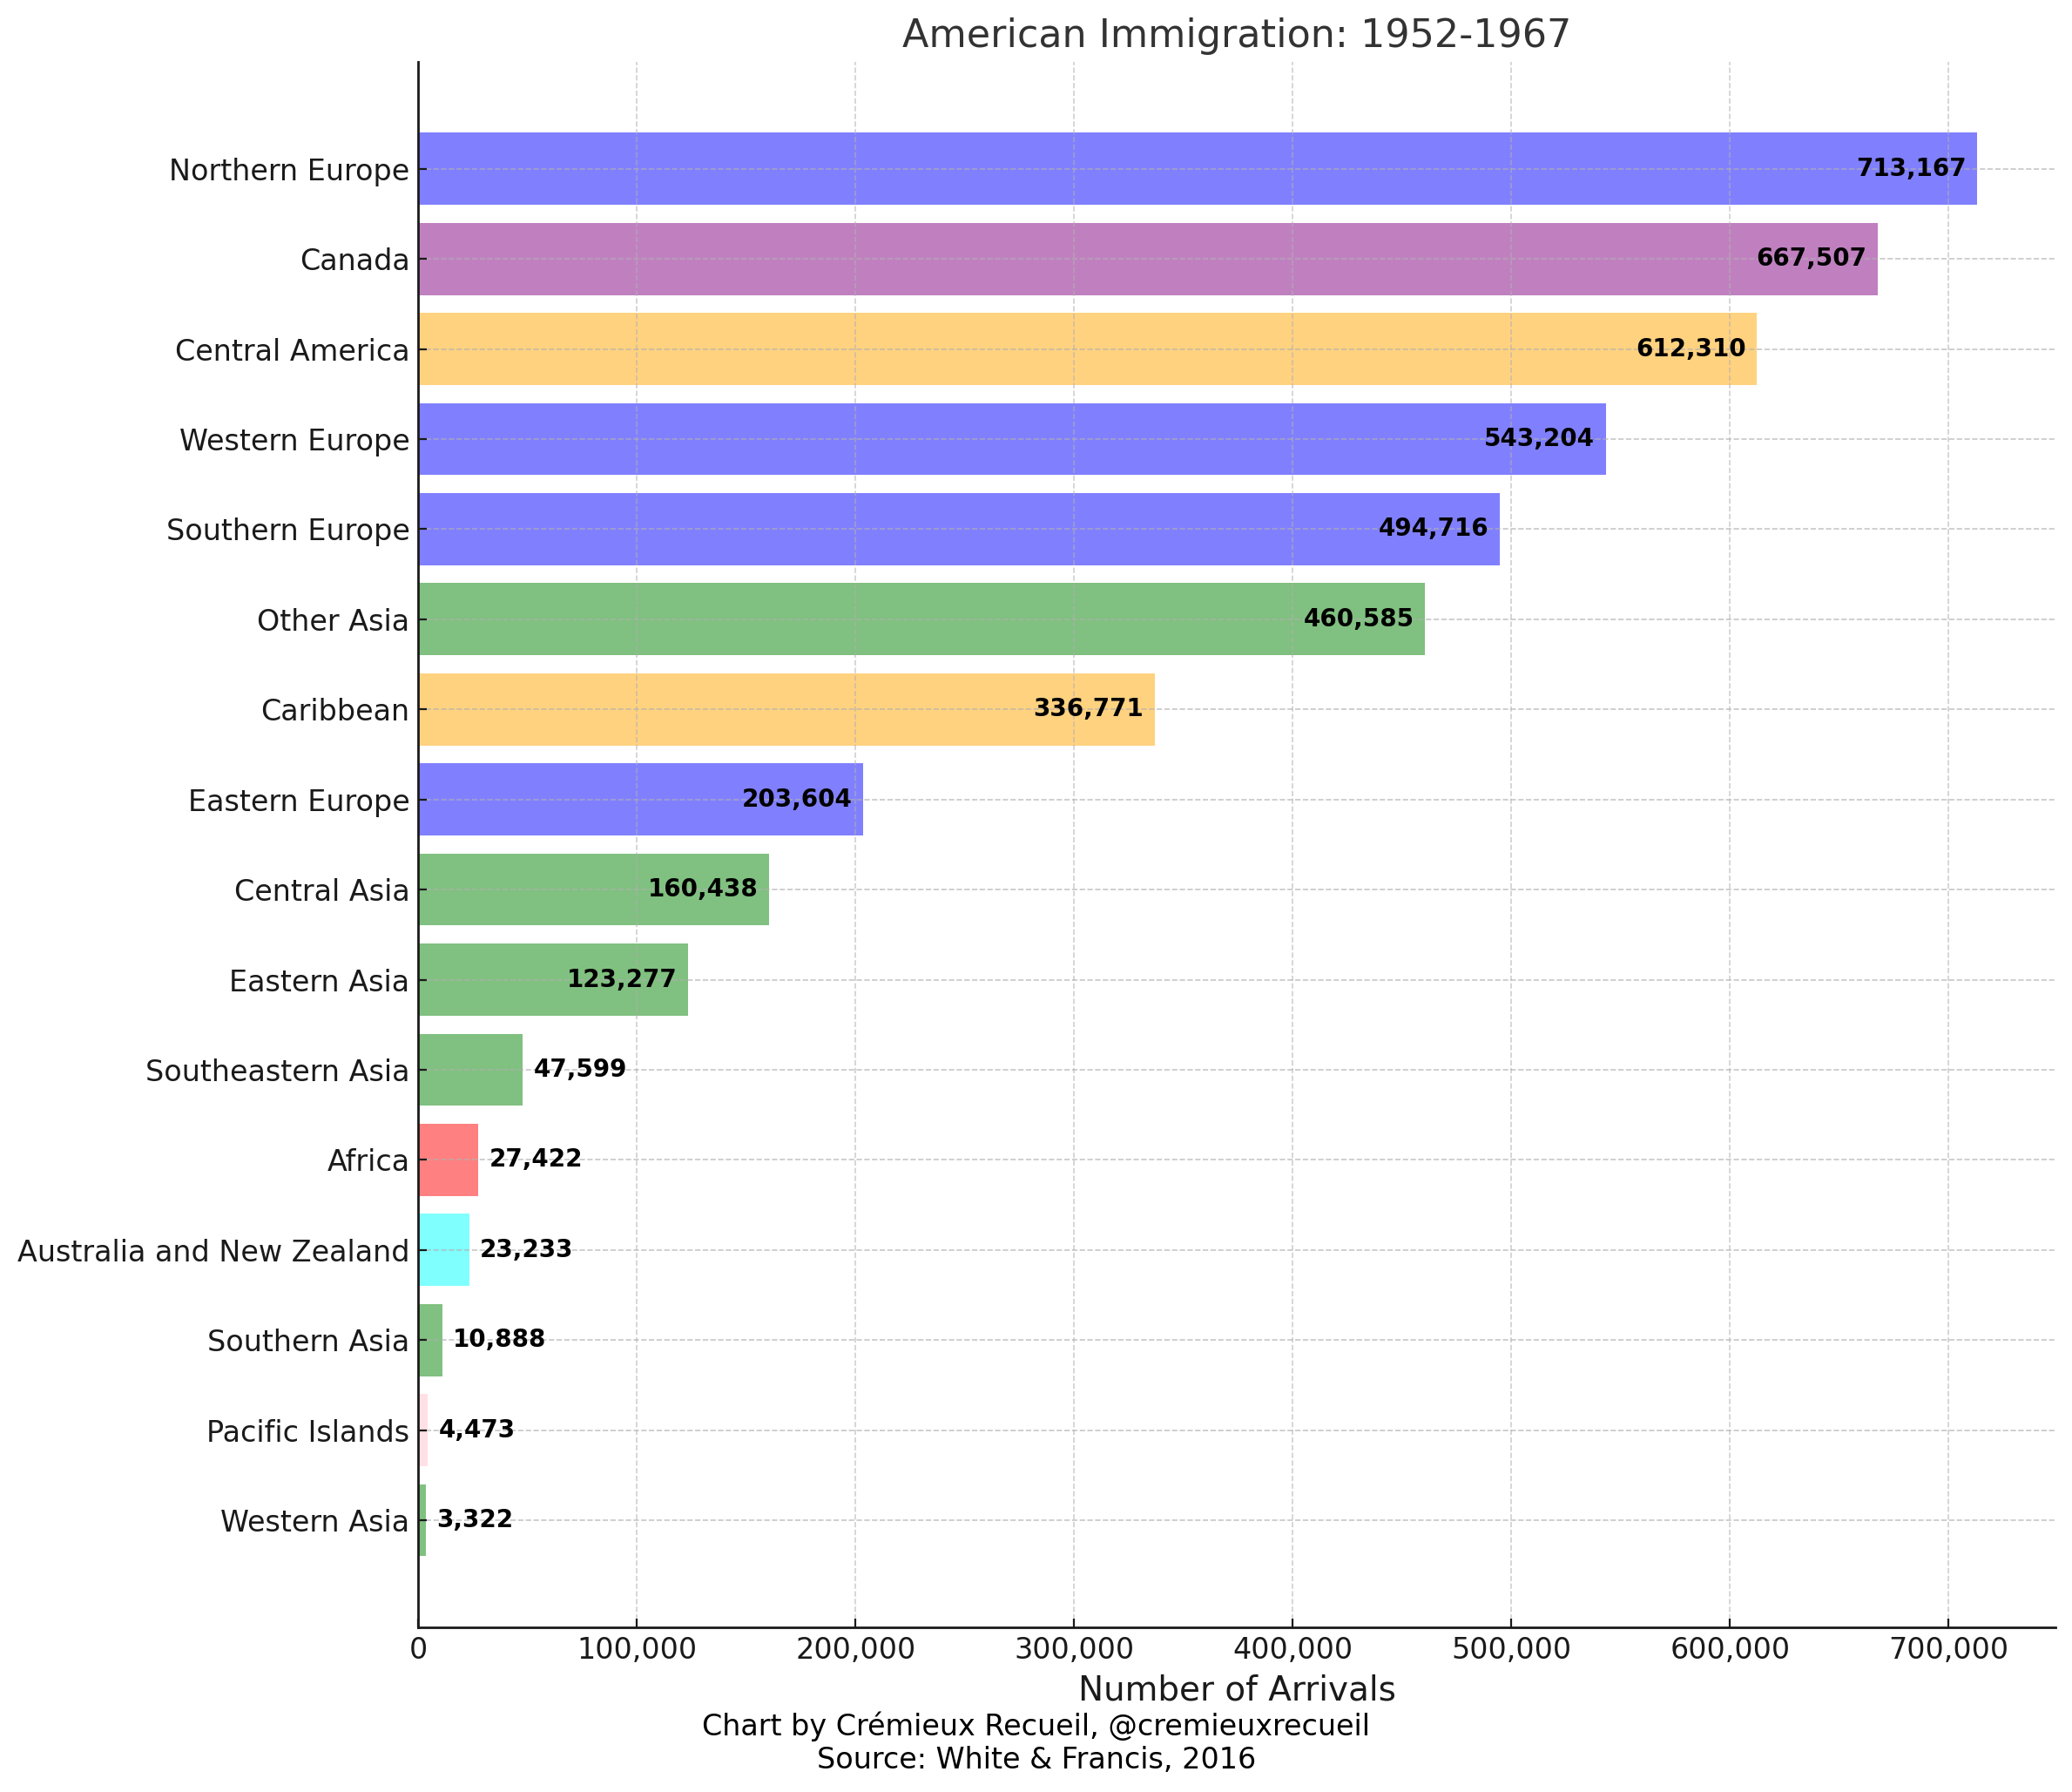
This era was short, but it marked a considerable shift, and it portended what would come: America’s views on immigration were moving towards greater acceptance, and the compositional shifts towards Central American and Caribbean migration, as well as immigration from parts of the world that previously saw virtually zero immigration to America, is significant. The reason this era is so short is also obvious: it was the last stand of the quota system.
Modern America: 1968-2013
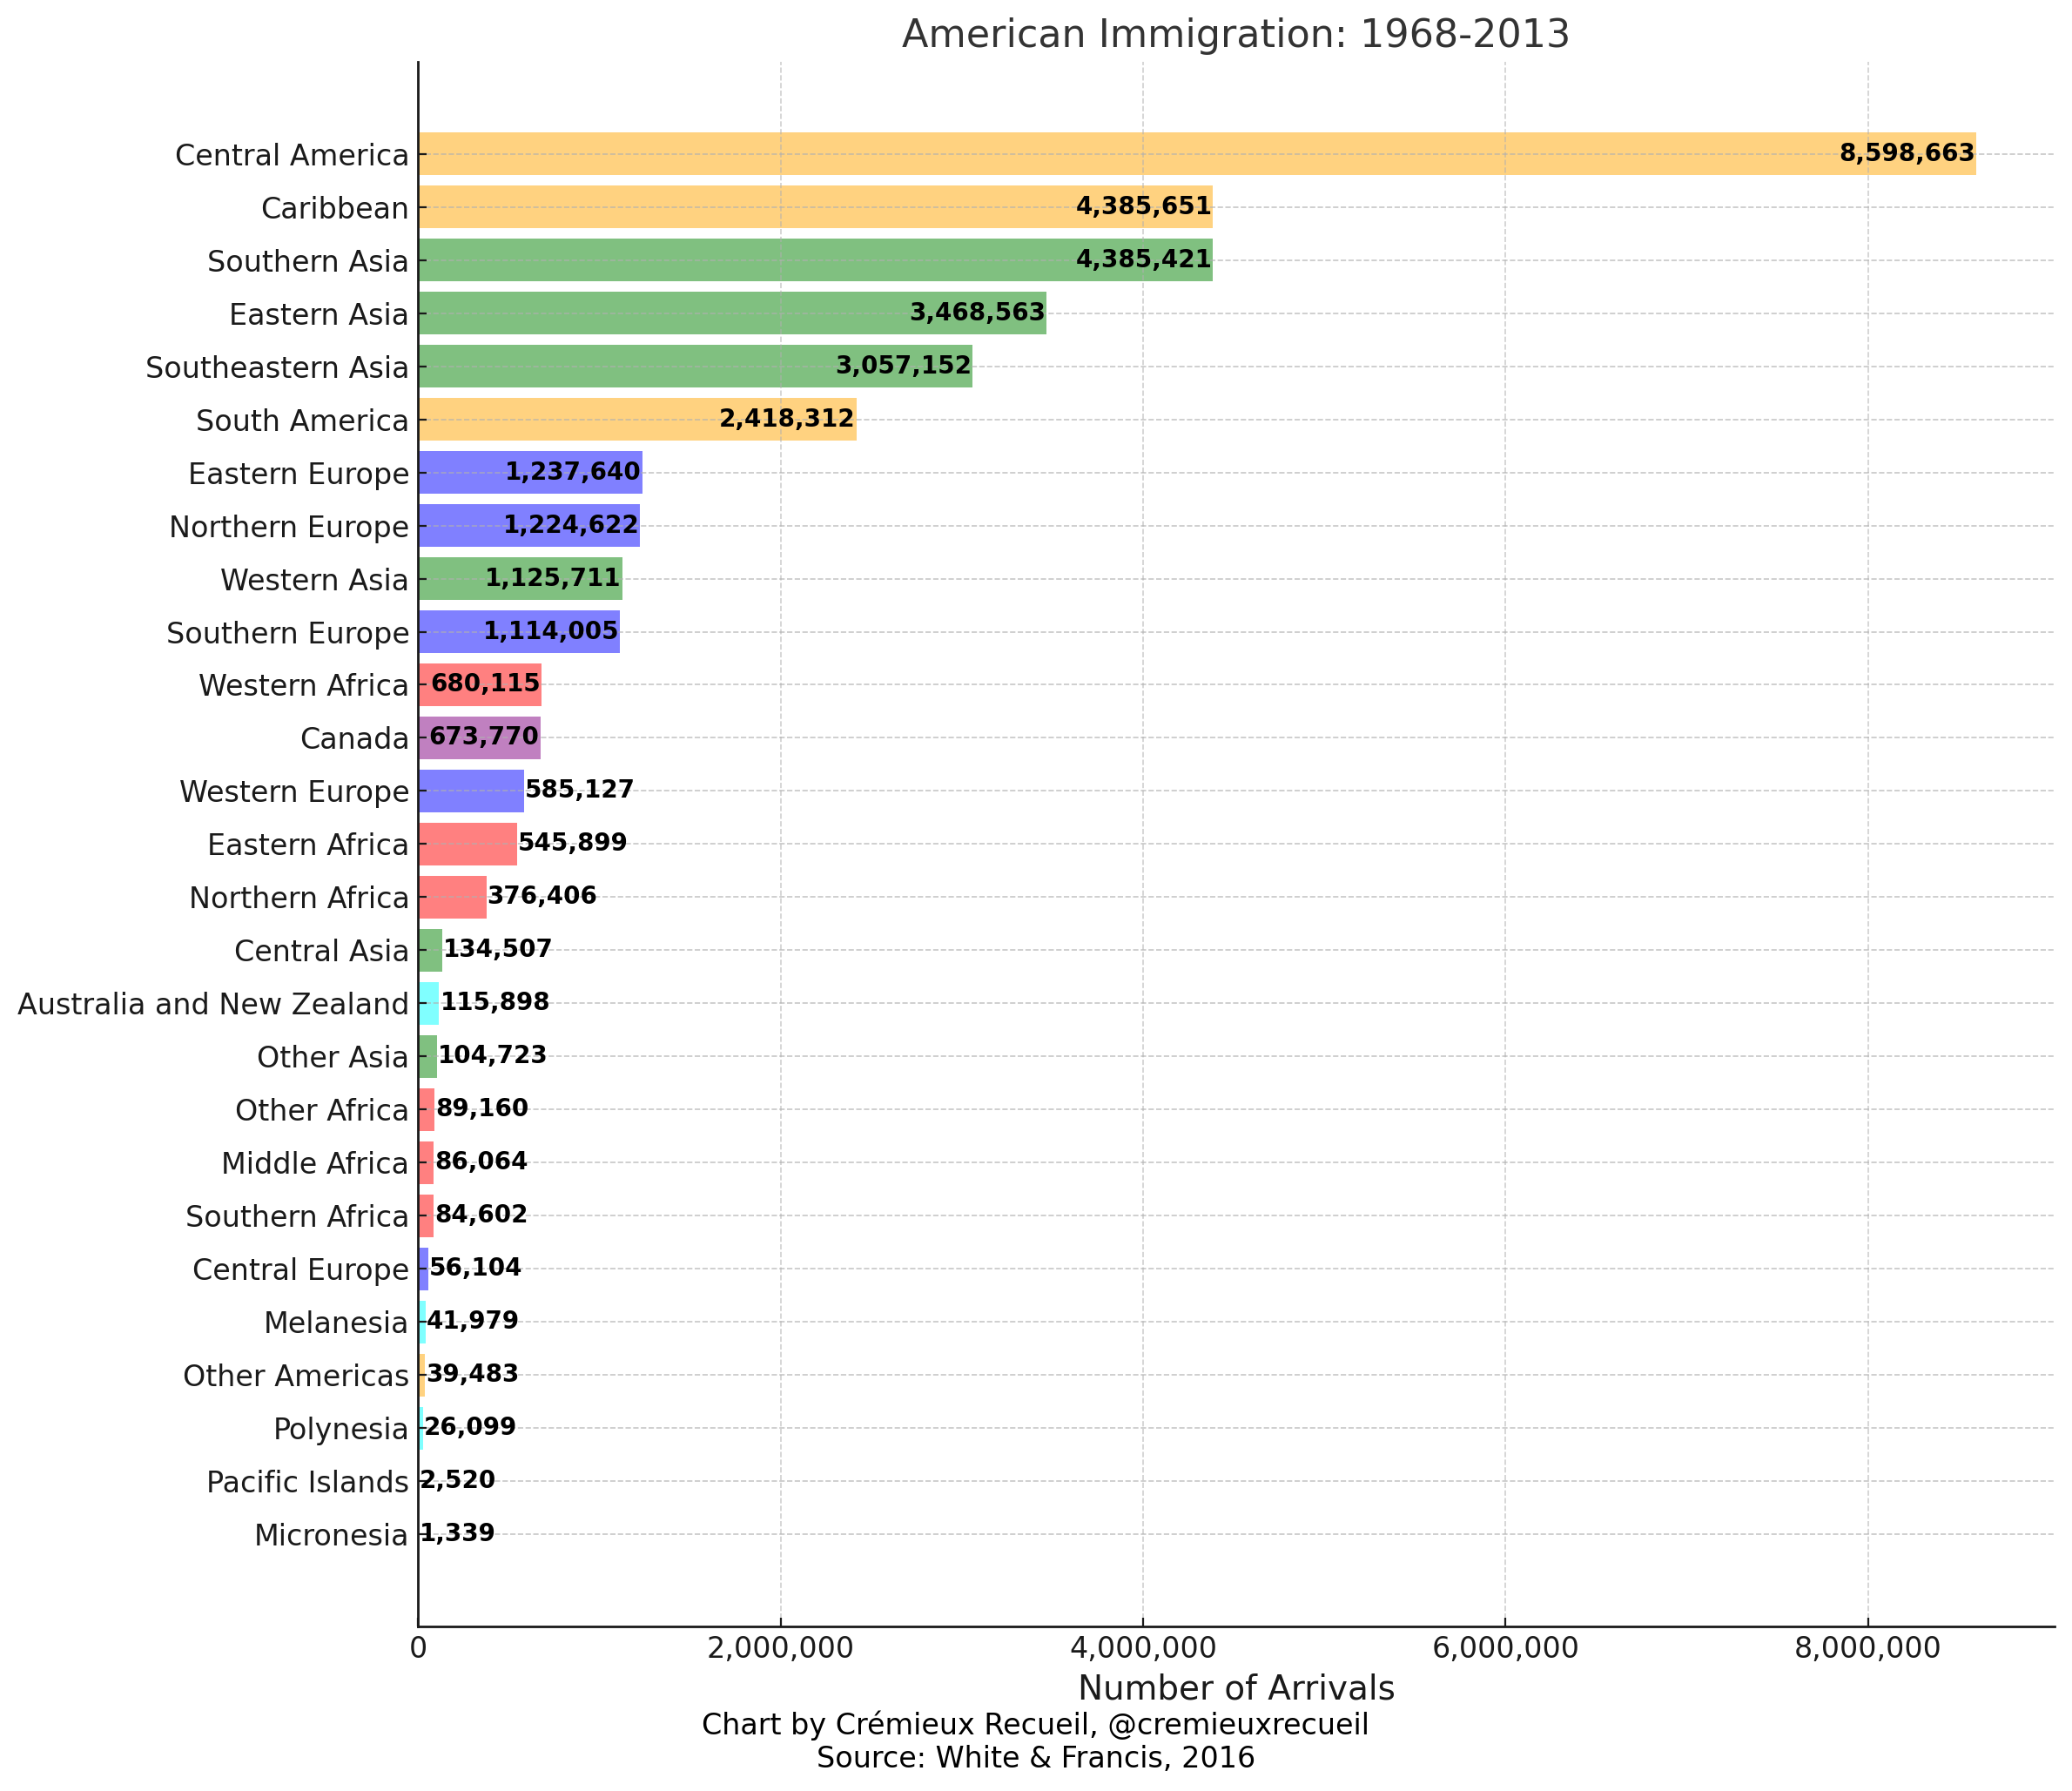
The 1965 Immigration and Nationality Act, more commonly known as the Hart-Celler Act, went into effect in 1968, abolishing the quota system that defined U.S. immigration policy from 1920 to then. This act promoted family reunification, filling open spots in the labor market, and bringing in refugees and asylees. America’s primary source countries were altered substantially, from its European origins, to the modern-day components of its compositional change: a European preference was exchanged for an Asian one; Latin America and the Caribbean and Africa as well, all saw major increases in immigration that were, for the first time, not almost-entirely from colonials.
Overall, the Hart-Celler act, coupled with its 1978 revision, the 1980 Refugee Act, the Immigration Reform and Control Act of 1986 (i.e., the Simpson-Mazzoli Act), various amnesties, and the Immigration Act of 1990, redefined America’s immigration and, thus, America as a whole. This era saw 34,667,604 immigrants come to the U.S.
Digging into America’s policy in this period, we see, for instance, that Hart-Celler limited immigrant arrivals to 290,000 per year, split between 120,000 for the Western Hemisphere and 170,000 for the Eastern one. In 1978, this was changed to remove hemispheric preferences, leading to a compositional shift. The 1980 Refugee Act came shortly after this and removed the refugee preference category while raising their annual ceiling to 270,000.
Simpson-Mazzoli amended Hart-Celler in a significant way, by providing amnesty to undocumented immigrants. The number here is enormous, at 2.7 million people in a very short period. The Immigration and Nationality Act of 1990 increased the number of allowed immigrant arrivals to 700,000 in 1992-94 and 675,000 after that, while expanding family-based immigration visas and creating five employment-based visa categories grouped by occupation, plus a diversity visa program to admit adults from countries that were historically underrepresented in the U.S. In 1994, Section 245(i) amnesty became available, and it effectively (but not literally) constituted amnesty for around 580,000 illegal immigrants, and this was expanded in 1997.
The Nicaraguan Adjustment and Central American Relief Act constituted an amnesty for nearly a million Central American immigrants and the Haitian Refugee Immigration Fairness Act of 1998 acted as one for around an eighth of a million Haitian illegal immigrants. The Late Amnesty of 2000 may provide up to around 400,000 illegal immigrants with amnesty pending resolution of their various court cases, and the LIFE Act Amnesty of 2000 might have provided it for another 900,000 more. Additionally, the Armed Forces Naturalization Act of 1968, the Armed Forces Immigration Adjustment Act of 1991, the 2000 Hmong Veterans’ Naturalization Act, the 2000 Bring Them Home Alive Act, the Indochina Migration and Refugee Assistance Act of 1975, the 1982 Amerasian Immigration Act, and the 1989 Immigration Nursing Relief Act all increased immigrant inflows from historically atypical sources, for largely atypical reasons.
All-in-all, if 1921-51 was the heyday for immigration restriction legislation, 1968-2013 was clearly the Golden Era for immigration laxness, with little exception. One of those exceptions, however, is pretty notable: the Patriot Act of 2001. This act’s effects on immigration are usually not why people discuss it. When it’s brought up, people almost always refer to its effects on America’s security state, but it also made representatives of terror groups or groups endorsing terror groups, and people who wanted to undermine American antiterror activities, ineligible for citizenship, in addition to making those who have prominently endorsed terrorism and those who have been previously associated with terror organizations ineligible to naturalize.
Overall, in this era, America changed from its historical desire to stay the American nation it was born as, to becoming a country whose definition we’ll only be able to understand in the coming decades.
Summarizing America’s Immigration
I didn’t describe anything after 2013, because comprehensive summaries beyond that year are not available, but a lot has happened since then, and, indeed, America’s demographic change from Anglo-Saxon nation-state to something else we do not yet know has recently accelerated. In future decades, we’ll be able to pinpoint the inflection point, but for now, it’s probably best to leave that to other people. For this post’s purpose, here’s the broad summary of America’s entire recorded immigration history:

When America began collecting immigration statistics properly after the implementation of the Steerage Act, it had fewer then ten million inhabitants. Over the course of the next nearly-two hundred years, it would bring nearly eighty million people to its shores. Since America reached 316 million people in 2013, if this post tells you anything, it should be that births7 matter: the demographic groups that immigrated in the past have a major advantage in numbers today precisely because they had many generations—when fertility was even higher—to give birth and multiply. Nowadays, things have changed, and immigration has become comparatively important. With the numbers on the table, this becomes easy to understand.
The Dark Number
Before ending this post, there’s one thing that must be said: we don’t really know the modern American population. The reason for this is that there are many illegal immigrants, and no credible statistics about their number. Numerous methods for estimating how many there are have been proposed, but none of them are actually good.
The most common method is particularly awful; in fact, it’s basically a joke. This method is the residual method, and it involves estimating the number of unauthorized immigrants from survey estimates of total foreign born minus estimated lawful immigrant numbers, which are estimated through taking survey results and adjusting them for various constants and with various projections that have, in some cases, not been updated in decades. This is the most common method because there’s practically no official willingness to just ask people if they’re illegal, and even if there was, people would lie when surveyed.
The number of illegal immigrants in the U.S. could be as low as 1 million people—which is dubiously low—or as many as 40 million—which might be a major stretch, or might not be, for all we know. The number is certainly significantly non-zero, at least in the millions, and it will likely result in millions of citizens through legal births and family visas in the forthcoming decades.
America’s Future
The America of the future will be less White than it is today. It will be more Asian, more Hispanic, and if mortality improvements among African Americans and immigration from Africa and the Caribbean continue, then it will be more Black as well. This is the most-likely path indicated by the statistics on America’s immigration history.
As always, the pot keeps turning and the cauldron keeps growing.
Because slaves were in the U.S. at its founding, it’s fair to call them members of the founding stock in some sense, even though they were not technically among its founders. Because founding stock formally refers to people who belonged to the groups the founders did, I reserve that term for its proper usage, not to include slaves. However, it is worth noting that most slaves have ancestry from members of the country’s founding stock. Though I have defined the term and how I will use it for this piece, people can quibble about its usage all they like. Quoting Huntington: “Americans commonly refer to those who produced independence and the Constitution in the 1770s and 1780s as the Founding Fathers. Before there could be Founding Fathers, however, there were founding settlers. America did not begin in 1775, 1776, or 1787. It began with the first settler communities of 1607, 1620, and 1630. What happened in the 1770s and 1780s was rooted in and a product of the Anglo-American Protestant society and culture that had developed over the intervening one and a half centuries…. The term ‘immigrant’ came into the English language in the America of the 1780s to distinguish arrivals from the founding settlers.” (p. 40).
Race included splits like “Slavic” and “Mediterranean”.
This refers to implementation.
Note that, in this era, there were an additional fifteen “North American” immigrants not shown on the chart. There were also six North American immigrants missing in 1952-67, and 8,066 missing in 1968-2013. The reason they are not shown is because Canada was the only North American country shown besides Mexico, which was grouped with Latin America and the Caribbean for cultural-historical reasons.
There is an unambiguous effect of border walls on illegal immigrant numbers. Consider the cases of Hungary

Notably, Allen, de Castro Dobbin & Morten (2019) showed that border fence construction harmed high-skilled workers in the U.S., with only marginal benefits to low-skill workers, amounting to just $0.28 per year. The net economic costs of illegal immigration are so low as to generally be statistically insignificant, even with decent power for relatively small effects, so, though immigration restriction may make it more selective, making the case for doing this intentionally is probably going to need more than economic justification.
And being annexed, in the case of some groups.