
What's in a (Black) Name?
People select names; names don't select people.

You do not need to look far to find ample evidence that people believe the poor achievement of African Americans is attributable to discrimination.
One of the more common ways economists have used to show this is the audit study. Audit studies involve answering help-wanted ads for open positions with fake resumes. The resumes are manipulated so that the effects of applicant characteristics like education, experience, age, and race can be better understood.
In one of the more popular audit studies, Bertrand & Mullainathan1 tested whether resumes from applicants with names that sounded like they were held by White people (“White names”) ended up receiving more callbacks for interviews than resumes from applicants whose names sounded like they were held by Black people (“Black names”). What they found probably won’t surprise you:

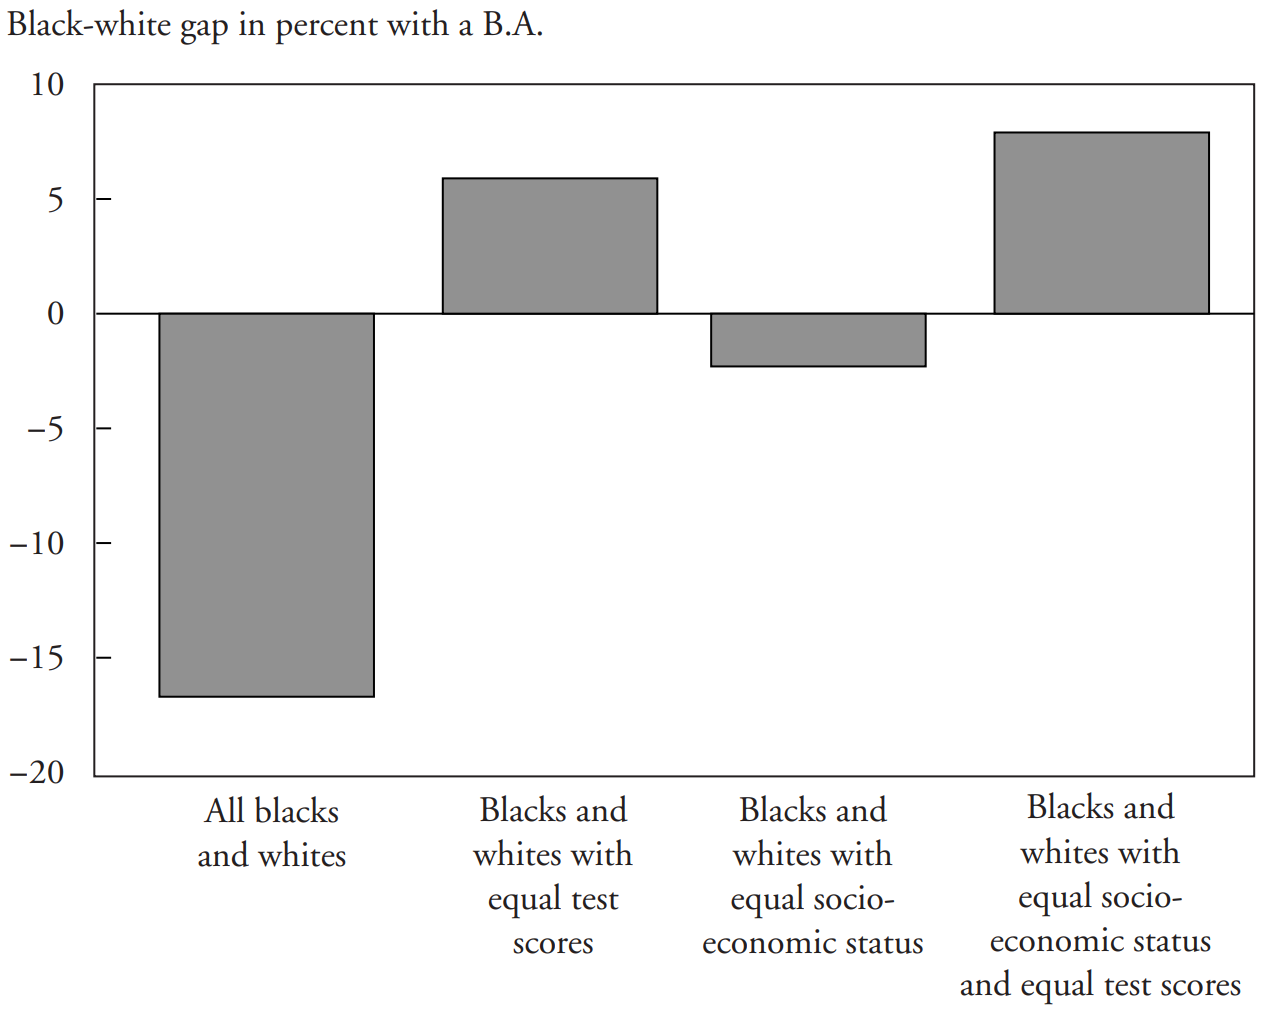
Resumes with White names received 50% more callbacks for interviews. Other research has taken this even further. Before looking at that research, consider the fact that the Black-White gap in socioeconomic mobility is usually eliminated or reduced to a pittance when controlling for test scores, or better yet, for general intelligence. Here’s one example using the NLSY’s AFQT:
Gaps in other areas, like STEM persistence, are also reduced or eliminated when ability is accounted for. The same is true for college graduation in general:
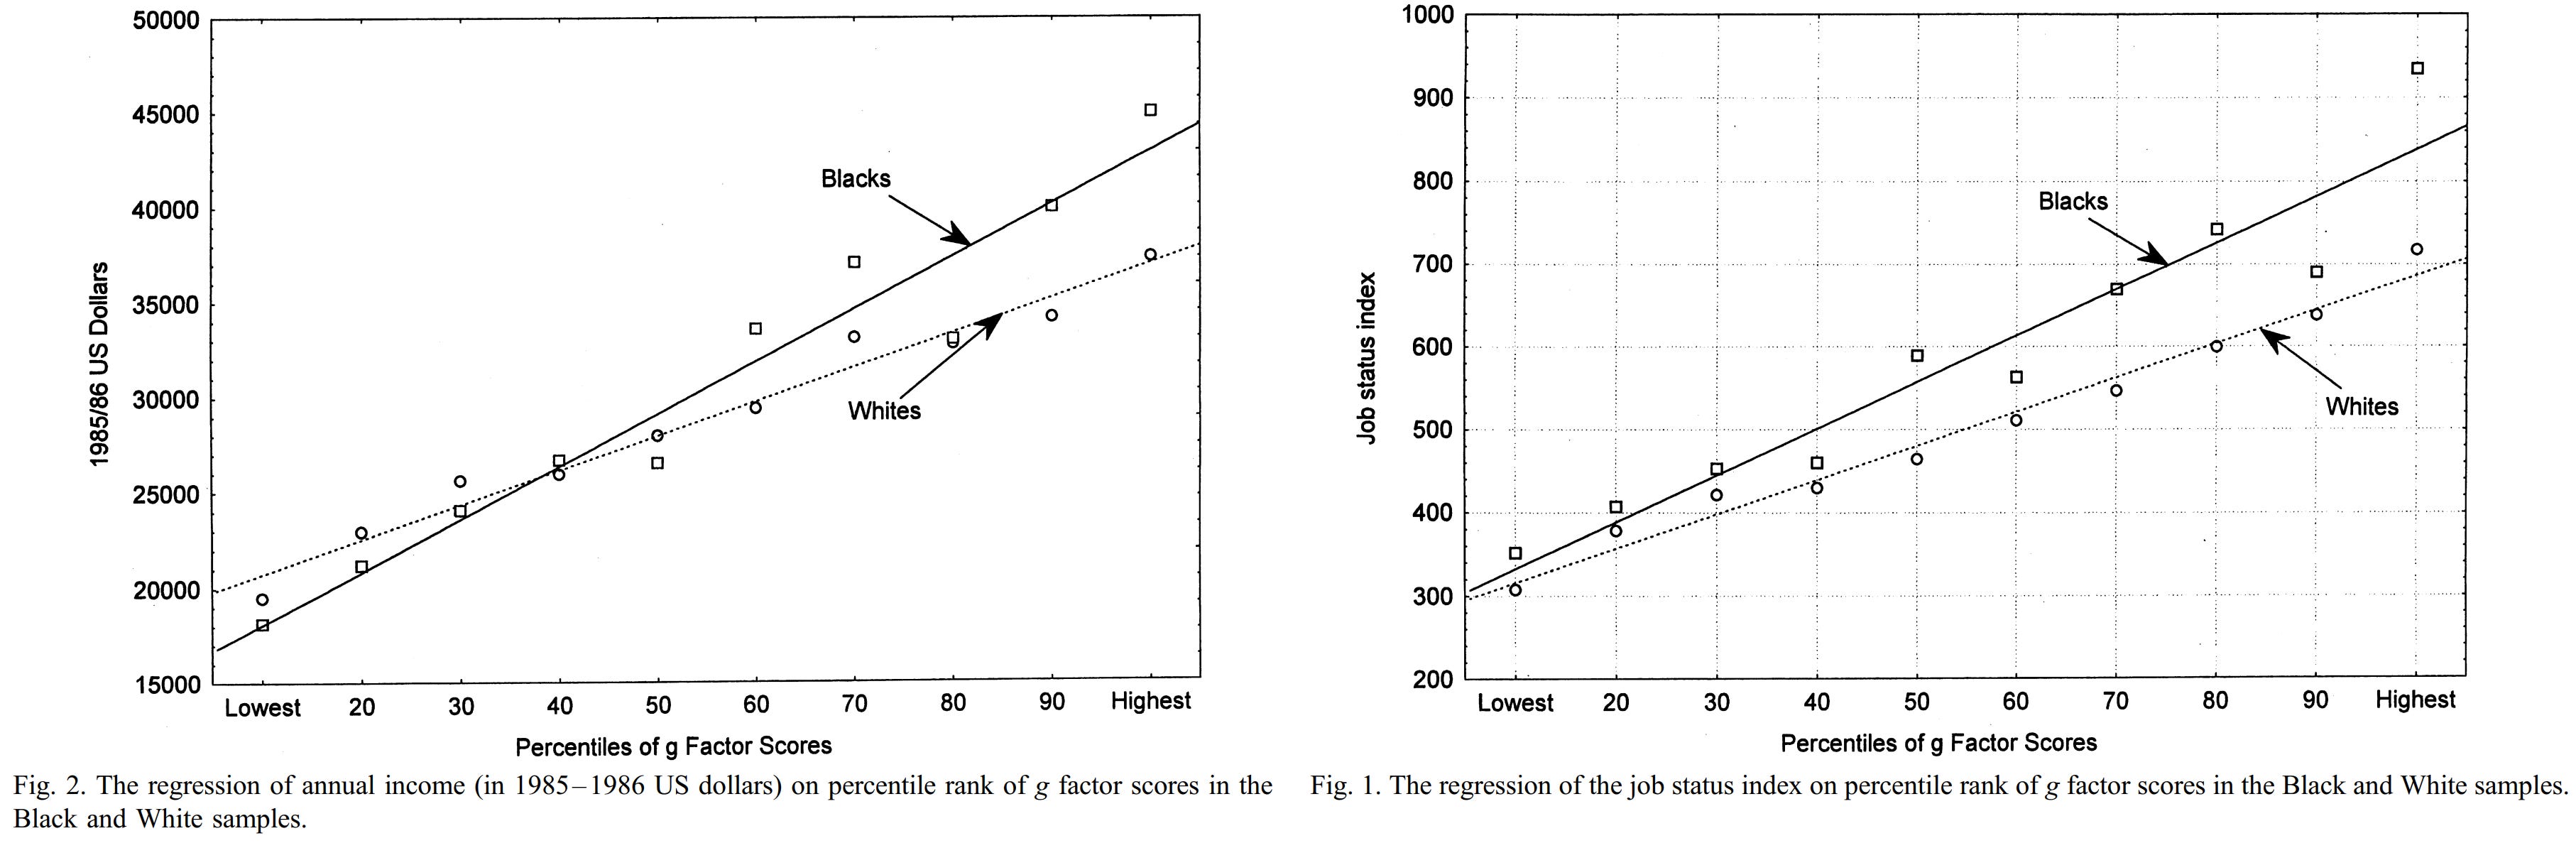
And this also holds true when talking about income and occupation scores.
If you’ve read The Bell Curve, you’ll be familiar with many more examples. If you’ve read some of the better-informed replies to that book, you’ll also be familiar with many examples of this simple fact: test scores, or whatever they measure, matter. You can call it “preparedness”, “literacy”, “numeracy”, “academic achievement”, “school skills”, “intelligence”, or whatever other euphemism you wish, but regardless, what they measure is commonly measured by many tests and it’s important because it is an antecedent of various important outcomes. To repeat: controlling for it often largely or completely eliminates racial differences in those outcomes.2
So let’s ask a question that’s reminiscent of traditional audit studies: what if the approximately 1 d Black-White gap in test scores driving differences in socioeconomic status is caused by discrimination? Economist David Figlio suggested just that in a 2005 paper.
Name-Based Discrimination: An Empirical Test
Figlio’s paper used a rich dataset gathered between 1994-95 and 2000-01 that included test scores, gifted classifications, and transcripts for 55,046 children in 24,298 families with two or more children in a large Florida school district. Figlio decomposed student’s names into sounds, letter orders, and punctuation and regressed combinations of those characteristics against maternal high school dropout status to index the extent to which names were indicative of low socioeconomic status. He noted that names high in low socioeconomic status attributes were particularly likely to include the prefixes “lo-”, “ta-”, and “qua-”, the suffixes “-isha” and “-ious”, apostrophes, and exceptional length and low-frequency consonants. If a student’s name had one of those prefixes, suffixes, an apostrophe, and it was worth more than 20 points in Scrabble, it was a low socioeconomic status name.
This strategy actually worked very well to find names that differentiated both class and race. When three or more attributes were in a person’s name, 55% of their mothers were high school dropouts, 90% were born into poverty, 6% had married parents when they were born, 52% were born to teenage mothers, and 98% were Black. Names that were given primarily to Black people and names that were “deviant” spellings of common names also showed a high correspondence with poverty and race. When one sibling had a low socioeconomic status name, the other sibling was much more likely to have that name too, but this increase in the probability of a similarly low-status name was only observed among Blacks.
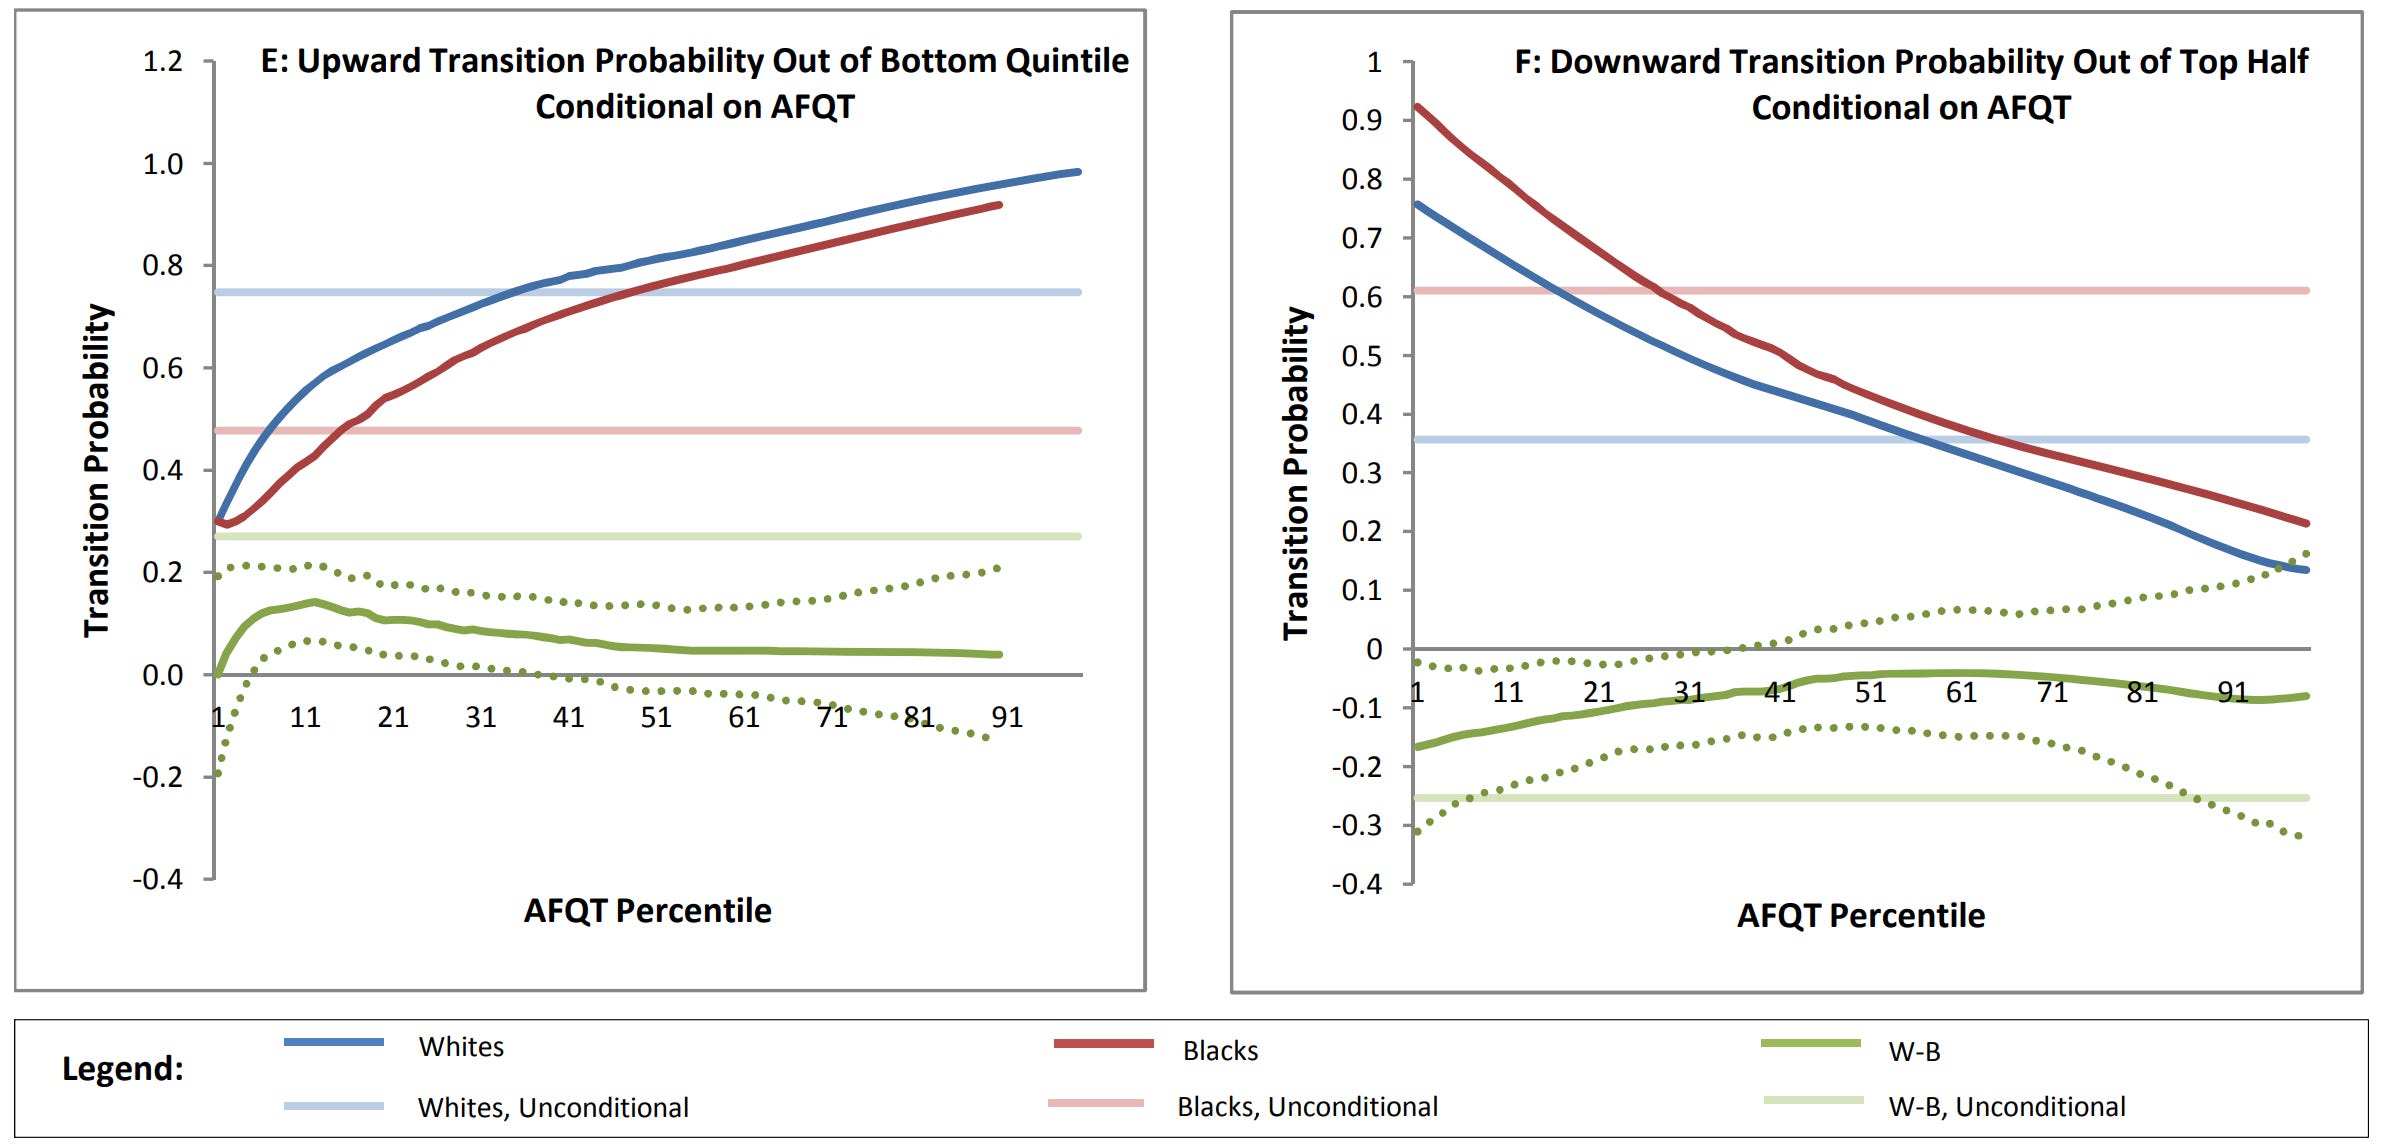
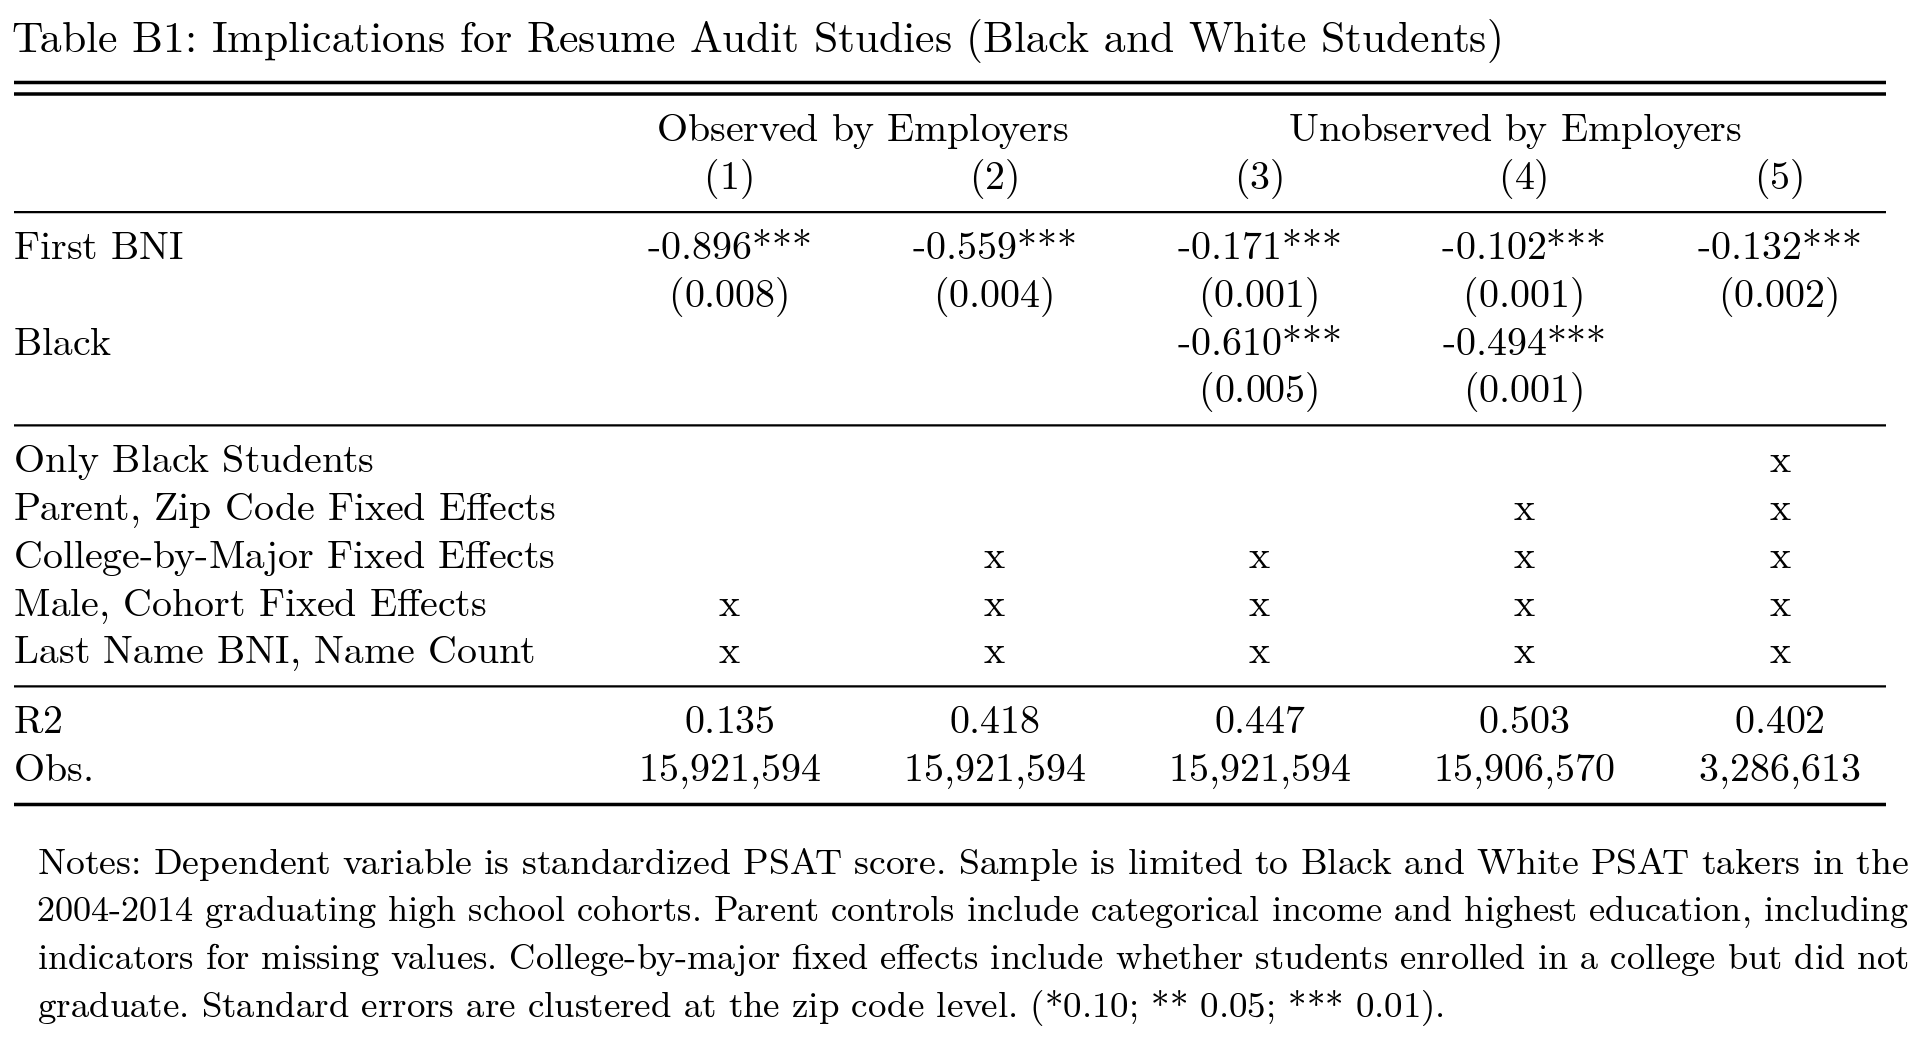
Onto the tests. To assess whether having a Black or low socioeconomic status name affected people’s outcomes, Figlio used sibling name differences to see what impact those had on people’s test scores. Let’s look at the first table. Highlighted results are significant.
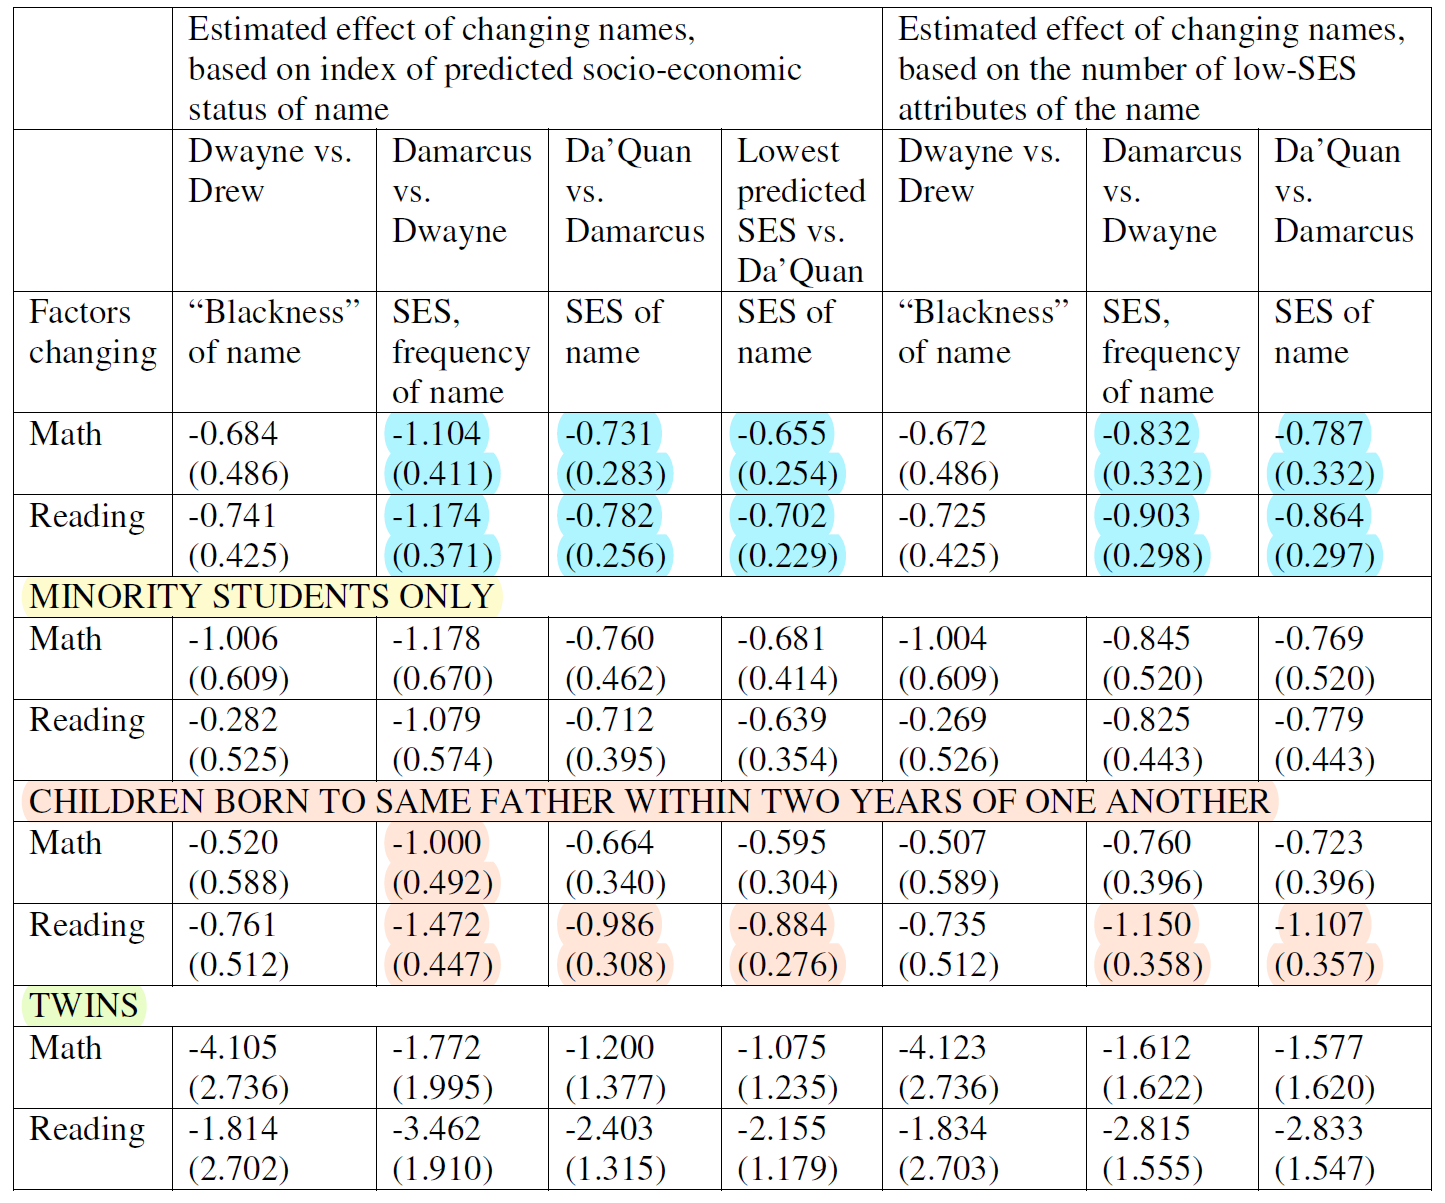
The blue highlighted results are noncentral for inference since they incorporate White students. There were no significant results for the “Minority Students Only” category, although they were all not significantly different from the blue category’s results or those in the next category. The next category includes the results that mean something because they’re not confounded by issues that can arise due to the genetic confounding that can come with the use of half-siblings and their improper treatment as siblings.3 Six out of fourteen of those test results were significant, but they were definitionally all very dependent tests. If we use the Bonferroni correction, we’re left with five. That’s pretty good!
The final set of results was from twins and they could have been the most reassuring, but they left a lot to be desired. In Figlio’s data, he knew someone was a twin because they were born on the same date as a sibling, but he did not know the zygosity, so these results are hard to interpret. Many of the estimates are extreme, which suggests that this subset was small and the estimates were unstable, but it might have also suggested a huge degree of variance constraint on the outcome affecting the reliability of the estimate. Because we never received summary statistics, there’s not much we can say about this. None of the results were significant anyway, so it’s hard to say it mattered.
Interpretation-wise, the scale is in percentile points, so it appears that having a low-status name is associated with roughly 1 percentile rank lower mathematics and reading scores. Onto the next table.
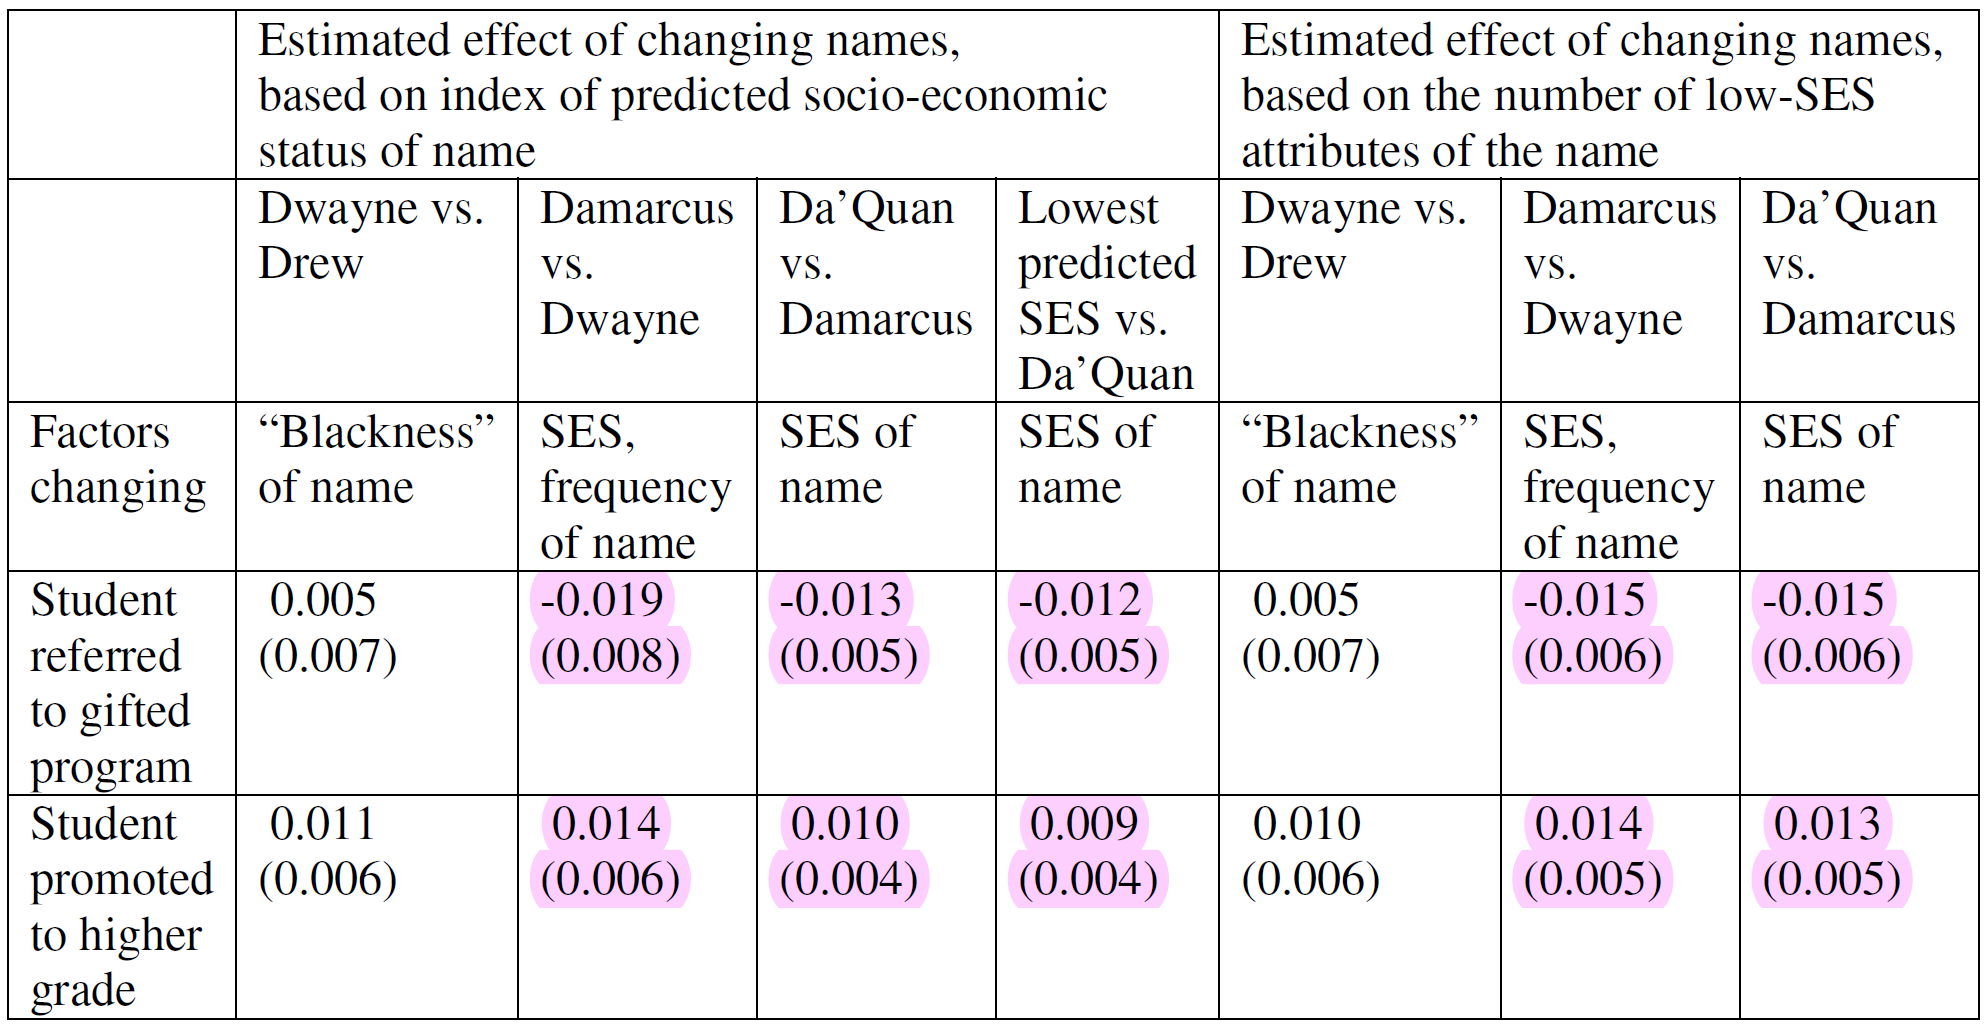
It seems that lower-status names are less likely to be referred to gifted programs and more likely to see students promoted to higher grades. These effects do not survive correction for multiple comparisons, so this table is entirely null and should probably be disregarded. The final table assessed whether there was an interaction by the fraction of Black teachers in a school.
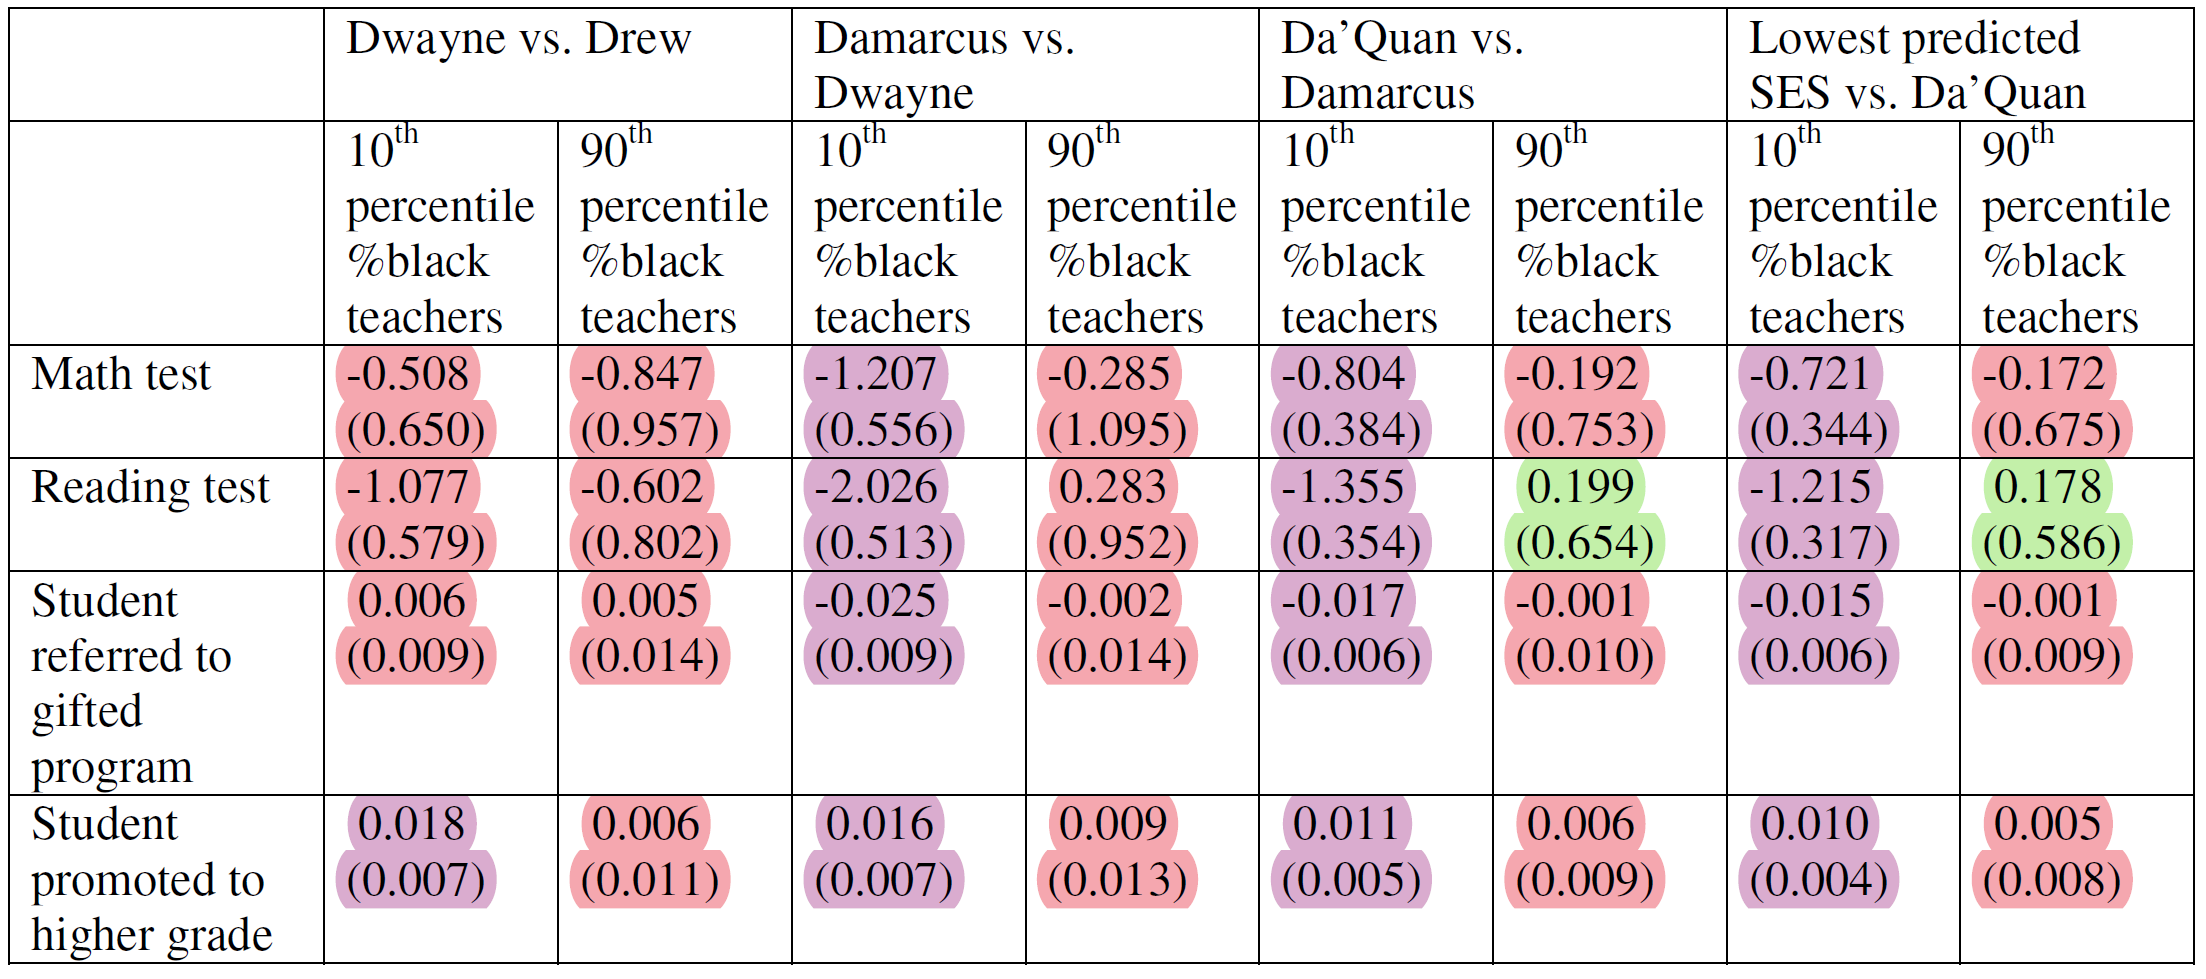
A violet highlight indicates a significant result, and when there’s a red next to it, that means the 90-10 interaction was not significant. Green, on the other hand, indicated a significant interaction. It may be notable that in both cases that happened, the 90th percentile results were not significant, suggesting a Black name never became beneficial.
Three effects survived correction for multiple comparisons: columns 4, 6, and 8 in row 2. In all cases, the interaction effects did not survive correction. This table did not provide any information that wasn’t provided in the first table, and we did not know which specification it was based on, so it wasn’t useful anyway.
There’s something disappointing about this study that has to be mentioned: it was p-hacked.
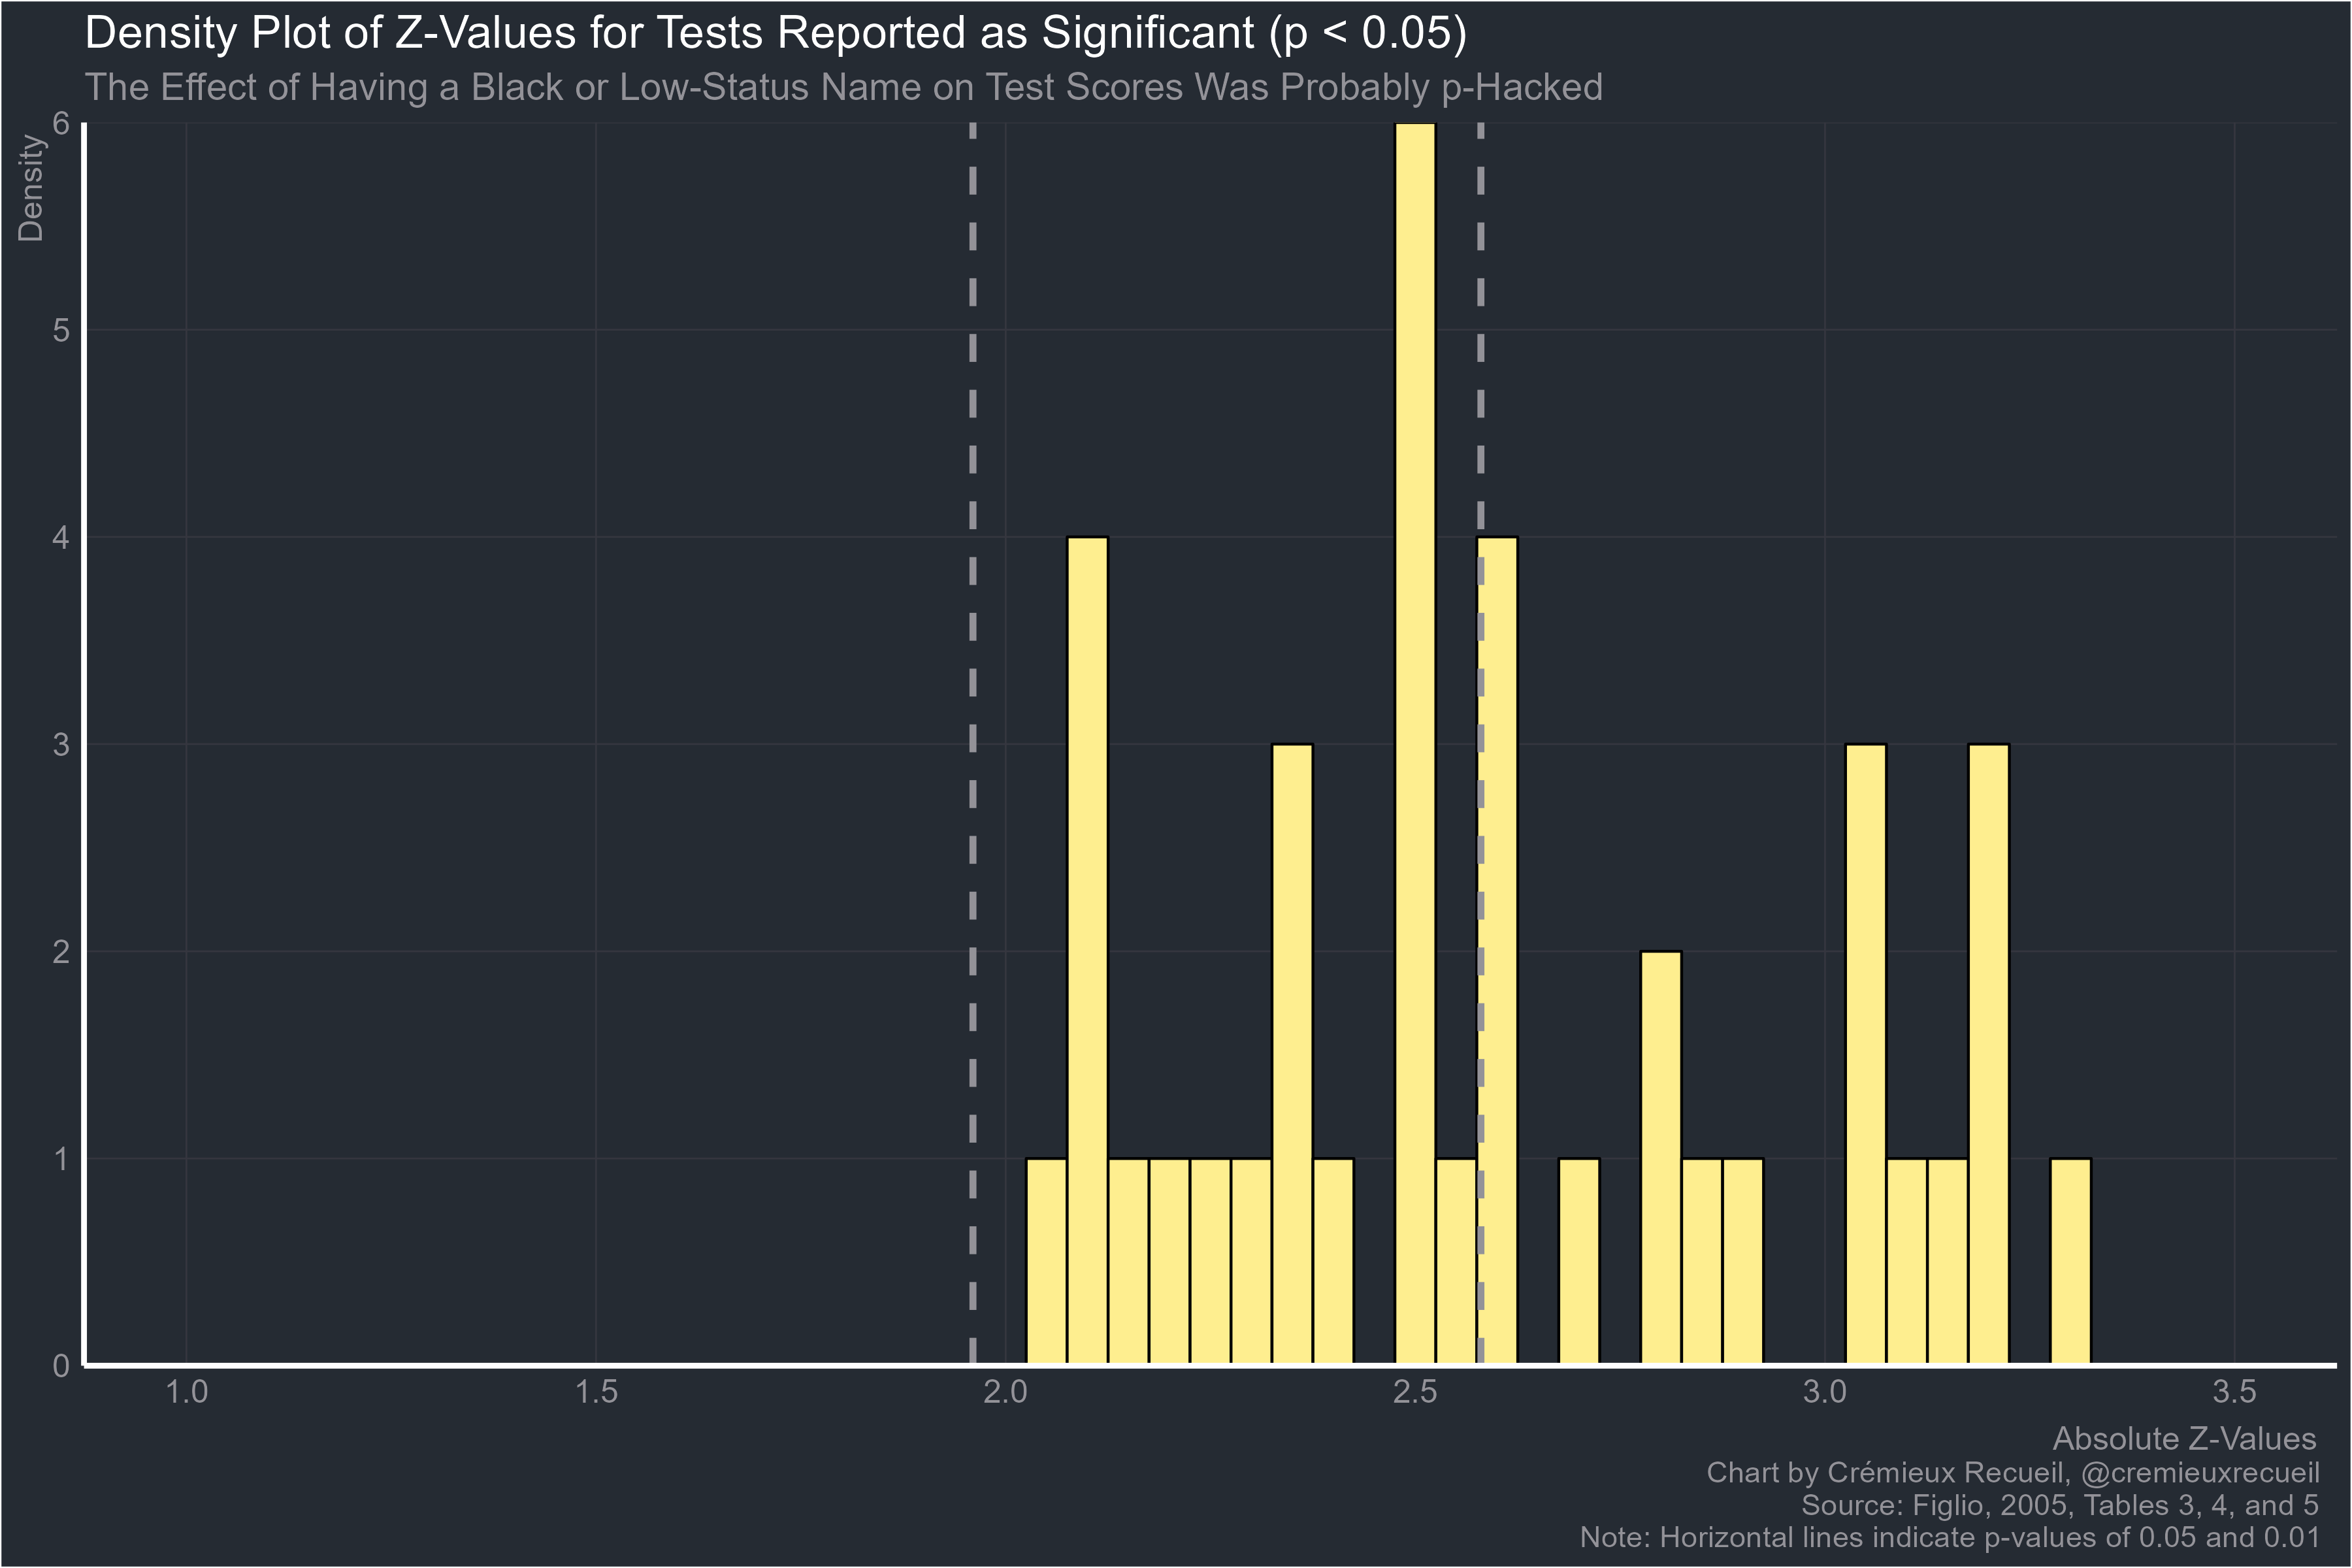
The p-hacking in this study was so extreme that 51.22% of the results that were reported as significant had p-values that were between 0.05 and 0.01. This should not happen.
So we have a problem because the study is not trustworthy. There’s another problem lurking here too: the lack of granularity in the analysis. With the effect size being interpreted as the change from one to another name that’s common enough in the dataset, the method actually seems to have very low power to detect modest effects on test scores. Because there needs to be sufficient variation in naming within families and most of the sample was White, this study appeared to have a large sample, but it actually had one that wasn’t large enough to detect very much at all.4
A Better Test of Name-Based Discrimination
But we are in luck! A new study has come out and it has overcome many of the flaws in Figlio’s earlier work. From the top, here are the advantages of this new study of the effect of Black names on student’s test scores, college enrollment, and degree attainment:
The sample size is enormous. The total sample, which was gathered between 2004 and 2014, includes almost sixteen million children, of whom more than three million are Black. Among the Black sample, there were over 700,000 siblings.
The sample is nationally-representative. Unlike earlier studies such as Fryer & Levitt’s or Figlio’s, the sample used in this study involves a sample of students spread across the entire United States instead of particular parts of California or Florida.
Siblings were adequately linked to limit concerns about half-siblings. In Figlio’s study, sibling links were generated through maternal social security numbers. In this study, links were generated based on home addresses, high schools, and surname sharing. The use of surname sharing and coresidence reduces but does not eliminate the risk of bias being introduced through the conflation of half- and full-siblings.
Fryer & Levitt’s continuous measure of whether a name is Black was used. This is more granular than Figlio’s measure and the results were continuously-scaled, making them easier to interpret. This measure was also explicitly racial rather than racialized due to its nature as a socioeconomic status indicator and thus possibly only a local proxy for race.
The outcomes were more common and thus easier to interpret. Everyone understands PSAT and SAT scores and of course they understand college enrollment and degree attainment. There’s no need to worry about what a 1 percentile rank change entails in more commonplace terms.
The code for the analysis was provided. Thanks to this wonderful addition, we can be reasonably assured there was no p-hacking. However, we cannot be totally assured because the data requires requesting access and though the odds are very low, the authors could have uploaded fake code.
The analytic example was apparently not selected in a compromising way. We’re reassured about representativeness with this study because of the provided summary statistics.5 We’re also reassured about power for the same reasons.
Results were provided for siblings and non-siblings. The ability to explicitly contrast estimates means we can observe the possibility of selection into Black names.
It looks like we’re set: this is a large dataset analyzed adequately. Let’s move on to the results:
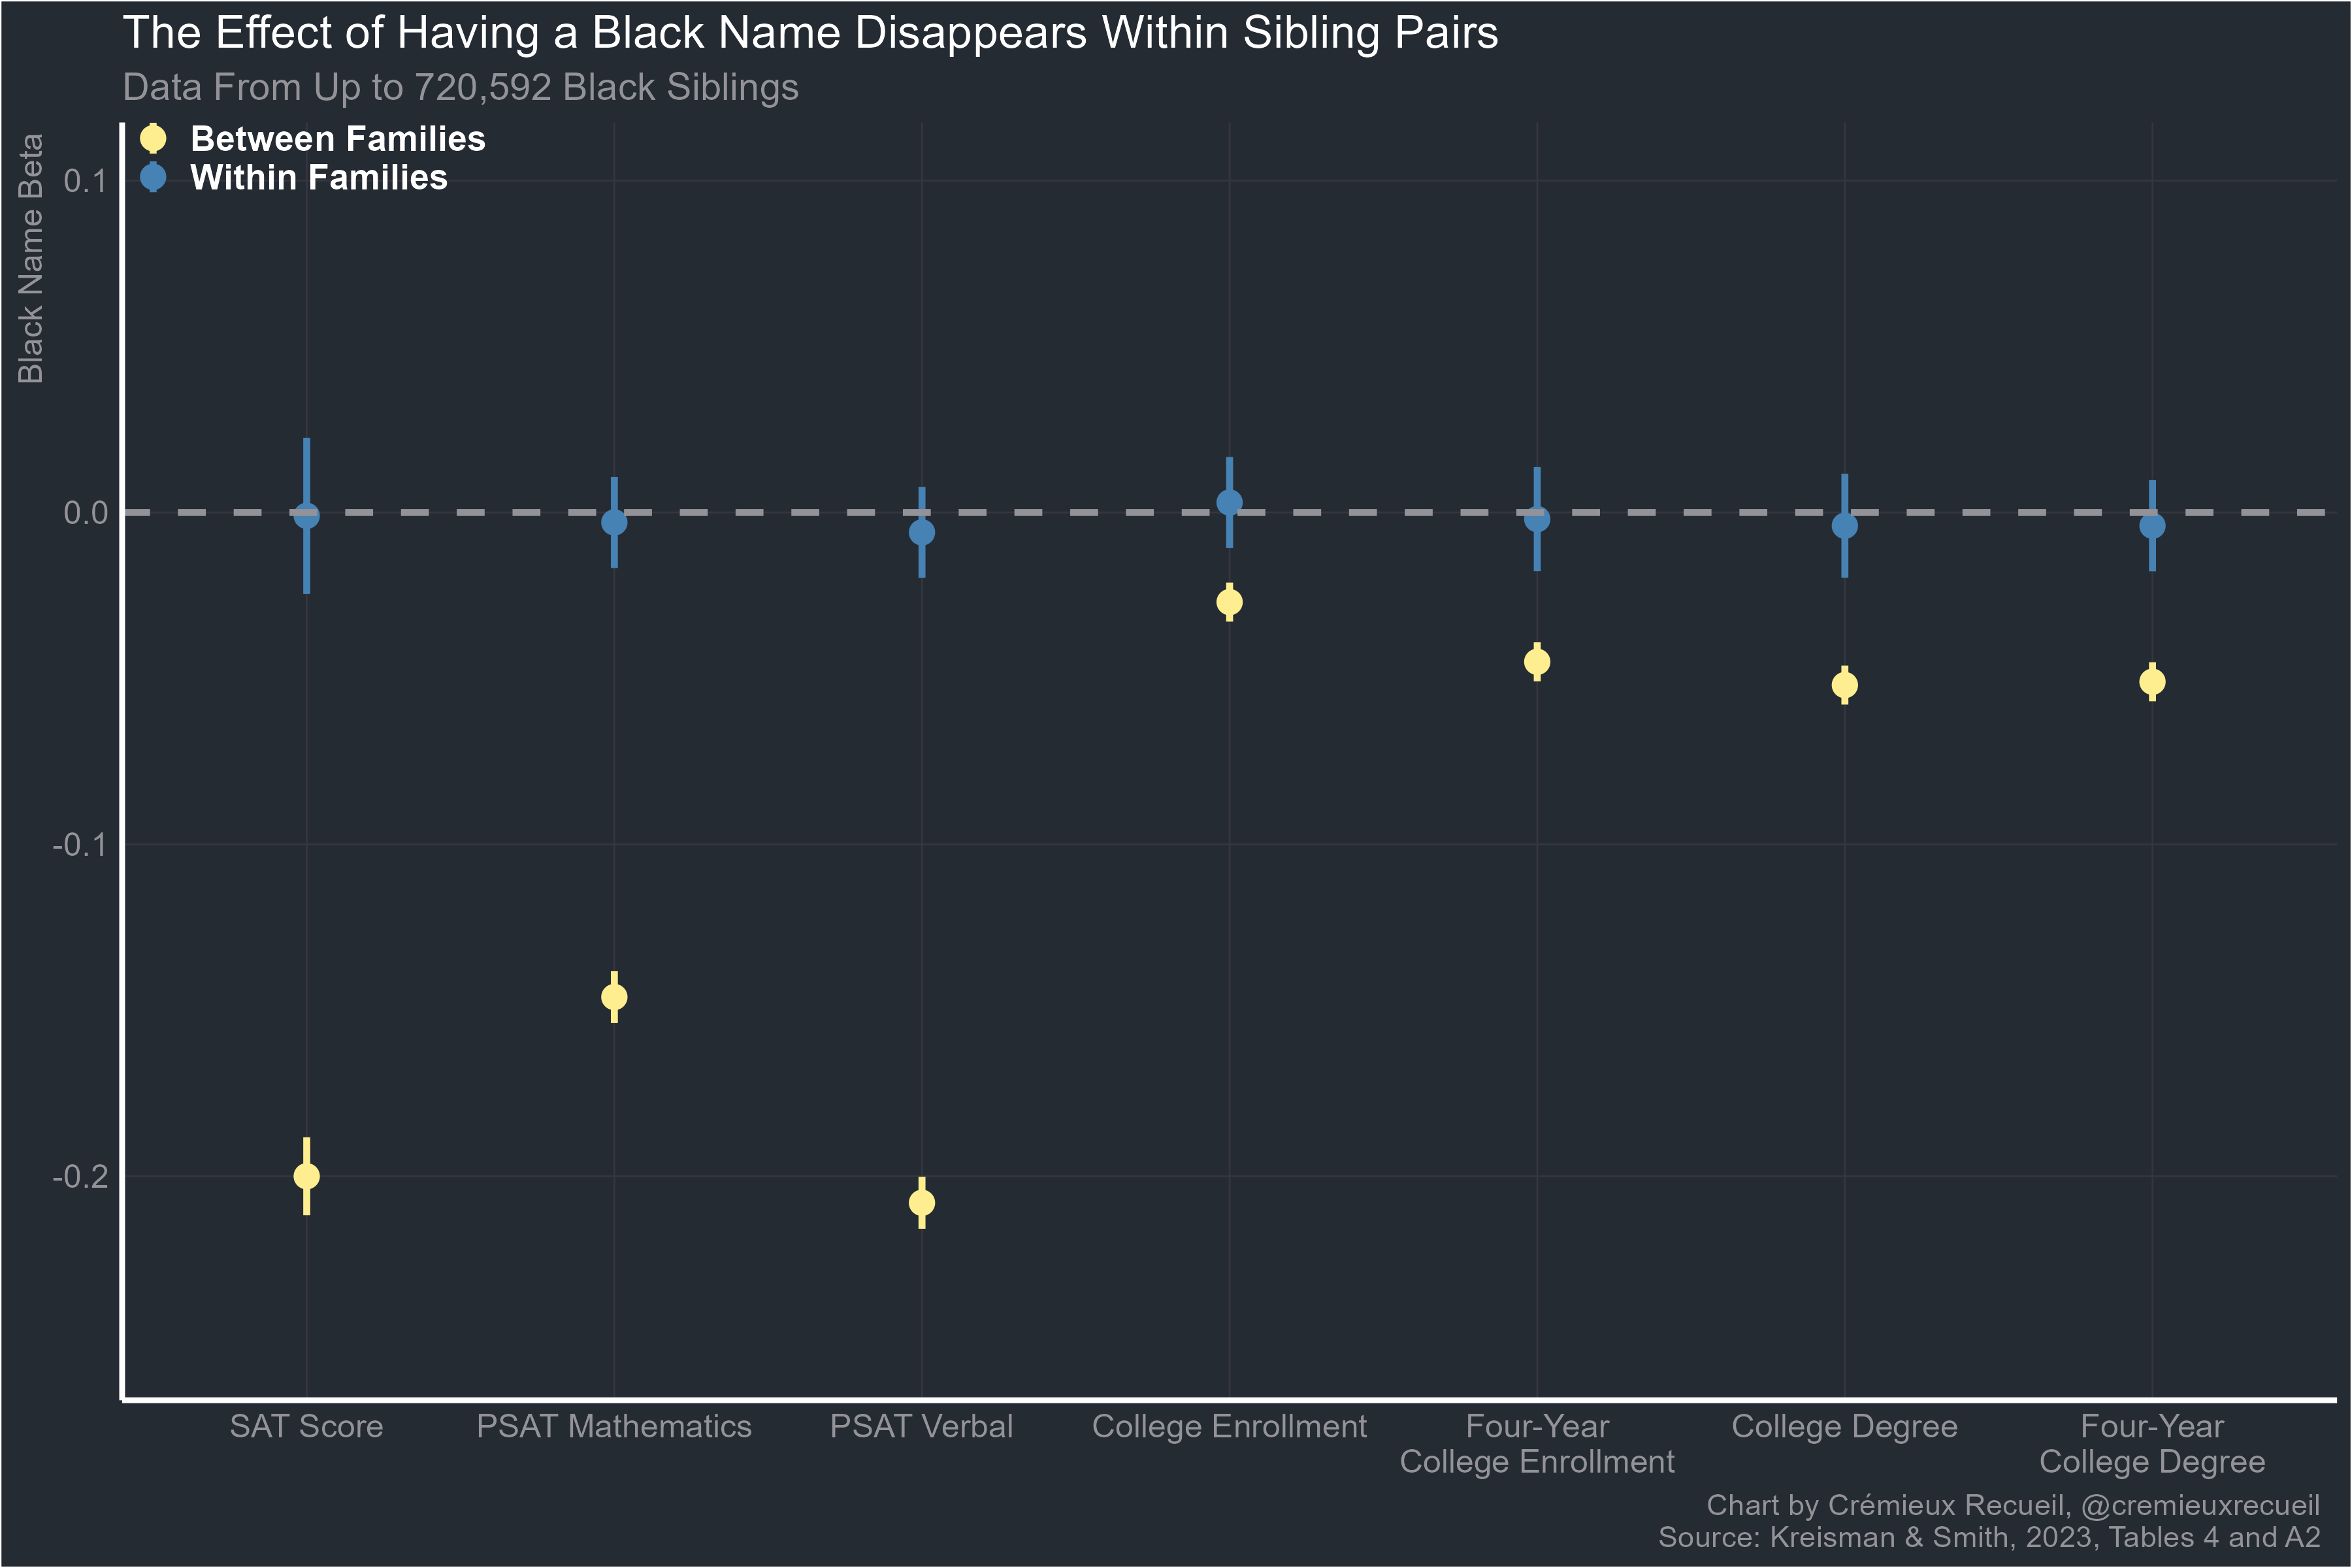
From left to right, the number of observations of Black sibling pairs was 434,580, 720,592 for both PSAT outcomes, and 444,786 for the rest. Using the full sample of Black students for a total population estimate produces estimated effects on PSAT, SAT, and PSAT subtest scores that are identical, except in the case of SAT scores where the full-sample coefficient was -0.220, which is slightly larger than the -0.200 from the regression across the sibling sample. A full-scale PSAT score estimate was also available, with the result being coefficients of -0.189 (0.002) for the full sample, -0.190 (0.004) for the between-families sibling sample, and 0.005 (0.007) for the within-families sibling sample.
Between families, the negative effect of having a Black name is clearly visible. A 1 SD more Black name is associated with a 0.2 SD lower SAT score. Contextualizing this shows that is a very large effect. Consider that the first-name Blackness for Black students is 0.72 with an SD of 0.29. For White students, first-name Blackness was 0.28 with an SD of 0.20. Simply changing Black student’s names to ones that are in line with the current White distribution would, if we took the cross-sectional effect to be fully causal, reduce the Black-White SAT gap by 26.16%. Fully one-quarter of the Black-White gap could be attributed to the effect of Black people having names that are targets of discrimination.
But within families, there is no negative effect of having a Black name. Instead, the result is a precisely-estimated null effect. Individuals with Black names do not have lower SAT or PSAT scores than people with less Black names. In fact, they’re not even less likely to go to or complete college. Having a Black name is not an impairment even though the naïve estimate suggests it would be.
Because in the vast majority of cases, children do not select their own names, the relationship between Black names and poor outcomes is attributable to the parents. Parents who give their children more Black names may provide them with worse environments or have worse genes that they transmit to their children. It’s probable that both are involved. Either way, individuals with Blacker names may be less intelligent, but not because they have a Black name.
Problems for Audit Studies
These findings link back to audit studies in a very unfortunate way. The implication of selection into Black names is that when an audit study manipulates names, it doesn’t just change the perceived race of applicants, it may also change the perceived qualifications. Now that we have this study, we actually have estimates of the size and robustness of that effect.
When employers observe a Black name, they observe a potential employee who is much less intelligent than a person with a less Black name. Knowing the details of a person’s education doesn’t get rid of this phenomenon. The majority of this effect is simply because of the racial difference and not the signal provided by the name itself. However, even after controlling for race, a signal remains from the name, and it does not disappear controlling for parental background or when the analysis is isolated to Black students. In other words, everything else the same, if you receive a resume from $White_name and $Black_name, you’ll tend towards a more qualified hire if you go with the resume from $White_name.
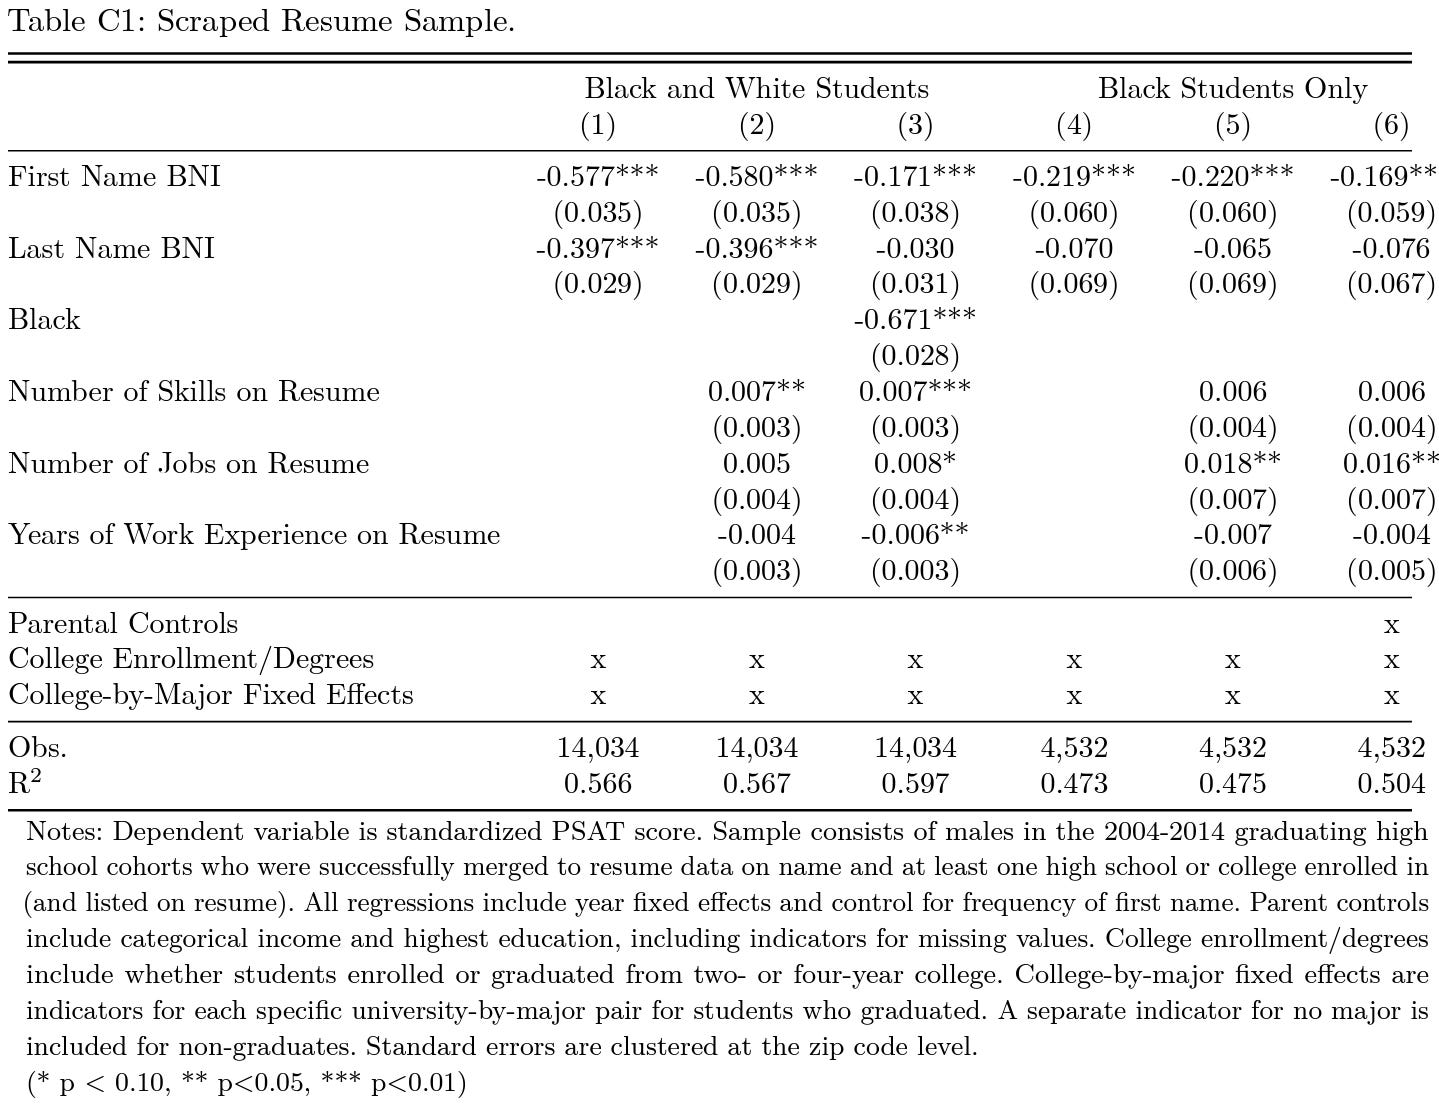
In their effort to speedrun causing a meltdown for economists, the authors of the study even went so far as to scrape people’s resumes to see if a person’s listed skills, previous jobs, years of work experience, educational details, and parental controls could overwhelm the harmful signal from a Black name. Unfortunately, they did not.
Audit studies are necessarily concerned with observables. The intent when they’re used is to suggest to employers that applicants are otherwise equal. But as this shows, the things they manipulate to suggest bias are actually capable of suggesting differences in ability. What audit study advocates may interpret as taste-based discrimination could be statistical discrimination. That doesn’t make it right or moral, or even legal, but it does make it understandable and it does limit the design.
This concern has not gone unmentioned in the audit study literature, but it has gone underaddressed.
Method 1: Make Discrimination Targets Better Than Beneficiaries
One common way that people attempt to address unobservable problems is to manipulate resume characteristics so that applicants from the groups believed to be targeted by discrimination appear to be more qualified than applicants from favored groups. As the above table shows, you may have to do quite a bit to actually achieve the desired result by simply manipulating resume characteristics. In fact, race (or other group) indicators could modify how other characteristics are viewed by employers, with good reason.
Consider education, one of the most commonly manipulated quality signals on people’s resumes.
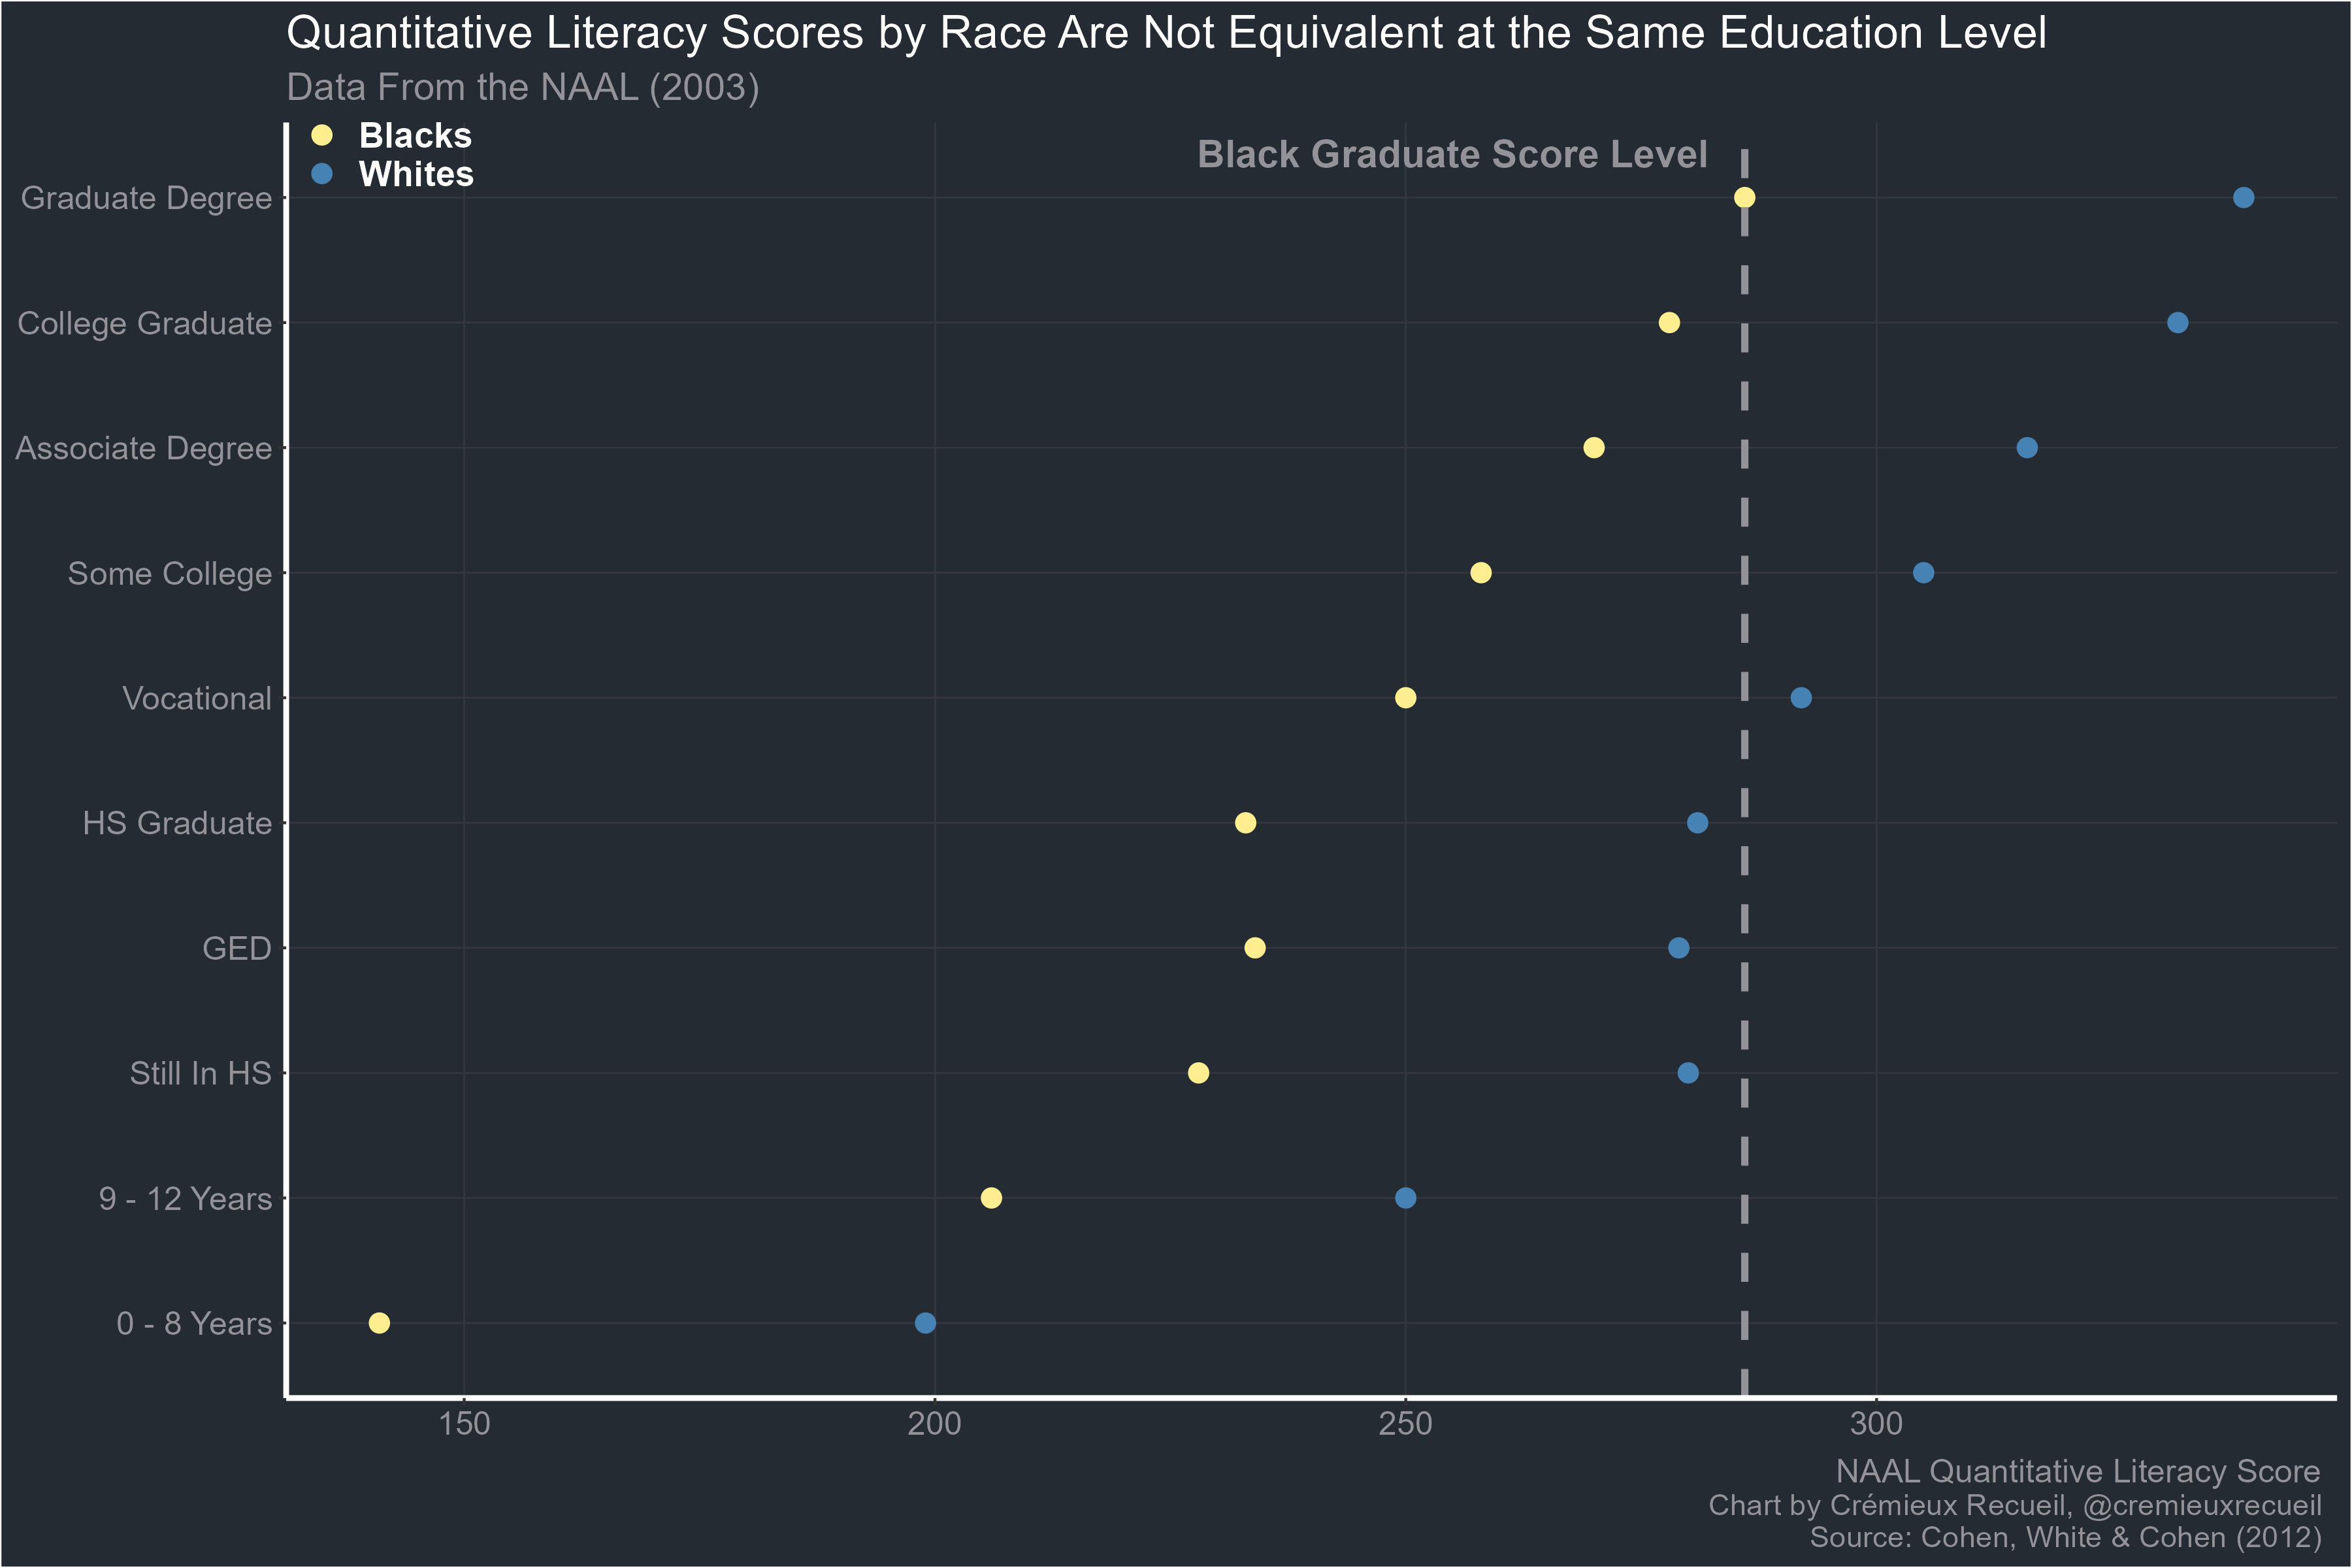
As the graph shows, when they’re equally educated, the average quantitative literacy scores for Blacks and Whites still differ by a large amount. Blacks with graduate degrees score on par with Whites who are only high school graduates. There are many more examples of this replicating, and it replicates across parental education level and within occupations too. It is a natural consequence of classification with thresholds and regression to the mean. It cannot be avoided unless groups have very different skill variances.6
Accordingly, this method will not do because it is not possible to produce differences in resumes that prove an applicant from a particular group is more qualified. Employers are obviously not blind to moderation effects, but the researchers conducting audit studies sometimes act like they are. The conclusion they seem to miss is obvious: it is not enough to manipulate resume characteristics to attempt to achieve a particular balance between favored and disfavored groups as a means of showing evidence for taste-based discrimination. This strategy cannot work because discerning statistical from taste-based discrimination requires a better understanding of what signals actually say and how they’re interpreted. Manipulating education or prior experience up or down quantitatively changes how applicants are viewed by an unknown amount, leaving the method uninformative.
However, inference is still possible in two ways.
The first is to send out applications to different employers offering comparable and/or radically-different positions. With sufficient data for particular or many employers in a particular time, you can develop a reliable-enough prior on perceptions of different characteristics and the extent to which they’re modified by group information you provide to employers. You can also use names with known perceptions to augment the power of this effort by using names and indicators of group membership that are perceived in dramatically different ways, possibly reducing required sample sizes. [It has come to my attention that this may not work, as discrimination in audit studies may be qualitative. This is shown in the post-publication notes at the bottom.]
Once you have the data, it can be leveraged to inform firm-specific discrimination estimates and decompositions thereof in subsequent sampling. Do this across enough firms and you can obtain economy-wide, industry-wide, region-wide, etc. estimates of the extents of taste-based and statistical discrimination. You simply need fine-tuning.
The effort involved in a “big data” approach to audit studies would be immense but worthwhile. I have not been very descriptive here because it’s a big empirical hyperparameter tuning exercise and those should not be unfamiliar to practitioners.
The second method is to check whether there are discriminatory employer allowances for underqualified employees. If a job listing says that a given level of education, number of years of experience, or some other seemingly hard requirement is needed and submitted resumes meeting, exceeding, or failing to meet the qualifications are sent out and favored groups still end up with callbacks despite failing to meet qualifications while disfavored groups end up with a lower rate despite meeting or exceeding them, there’s meaningful evidence for discrimination. The callback rates over, at, and below job offering-implied thresholds can be compared for inference.
But this method requires a powerful assumption that needs to be justified empirically: that employers perceive members of different groups as equally likely to lie on their resumes. Information that’s tailored to job offerings may appear suspicious, and if it comes from members of generally lower-performing groups who should be less likely to meet the qualifications, perhaps all the more so. An easy way to improve inference with this method if the assumption of equal perceived lying rates cannot be validated in general or specifically is to exploit differences in the selectivity of job requirements because a member of a low-performing group should be less suspicious in a job that is less selective. Something like this has been done for caste-based discrimination.
Both this and the previous method are going to require sending out a lot of applications, and to end up well-powered, they’ll probably need far more than typical existing audit studies.
Method 2: Going Blind to See More Clearly
Another strategy that can be used to improve the identification of taste-based versus statistical discrimination is pretty expensive, and involves group self-comparisons. The way this works is simple. All you have to do is compare callback rates for resumes when their recipients are blind to group characteristics versus when they’re able to see them. When this is done, it can show that certain groups are favored or disfavored on the bases of their identities. For example, here’s a 2017 blind audit of the Australian Public Service:

Blinding led to inconsistently significantly better ratings for women and minorities. In this scenario, we can be reasonably certain that the result is driven by bias because the sign of the effect is contrary to the direction we should expect unobservable applicant quality to run in. That’s one way audit studies can be saved: by invoking a strongly-supported theory. But since the object of most audit studies is assessing bias against groups that underperform, this is usually not possible. But that doesn’t matter to the meta-point, which is that that when blinding is over, group information can be rationally used to modify the values of other criteria on a person’s resume. The example of education, where there’s still a racial skill gap at all levels of it is quite apt.
There is actually evidence that partial blinding can change how applicant characteristics are perceived. Consider Ban the Box policies. Per Jennifer Doleac’s well-informed 2019 Congressional testimony, these policies, which ban employers from asking about applicant criminal histories, may induce statistical discrimination against groups that are disproportionately likely to have criminal histories even though the absolute probability of having contact with the criminal justice system is small for individuals in those groups. This leads to innocents being caught in the crossfire, and the policies may not help people with criminal histories at all.
I was convinced until recently that pre-post blinding comparisons could be coupled with between-group comparisons to estimate a structural model that could bound the estimated impacts of taste-based and statistical discrimination, respectively. I now freely admit I was wrong. I’ve actually known several reasons why this isn’t possible for some time, but I hadn’t bothered to sit down and put it all together until now.
After seeing how unobservable confounding related to audit-manipulated characteristics remains even conditional on numerous covariates on and off of resumes, and how the characteristics used in audit manipulations can affect the values of applicant characteristics for employers, I now know that such a model cannot be estimated because of the presence of too many unknown and inestimable values, including moderation effects. This is non-trivial, because the size and directions of these effects can be economically meaningful so there is real reason to worry. This goes back to the need for the big data approach if you want to get anything done.
Method 3: Audit Studies As An Instrument
There are many post hoc means to validate typical audit studies and their inferences, for example, one could observe that firms that appear to discriminate more are more likely to go out of business (uncontrolled p = 0.024, controlled p = 0.046), or that Sweden and France show more discrimination in their audit studies than the U.S. (unadjusted p’s of 0.024 and 0.011).
These findings cannot be used to cleanly support the taste-based discrimination interpretation of audit studies for the theoretical reason that even statistical discrimination may be harmful or could vary for compositional reasons between regions. For example, I’ve noted that there are differences in ability across U.S. regions that seem to be fashioned by complex historical processes. This isn’t an original observation; many have noted this and Arthur Jensen once dubbed the neglect of it the Klineberg fallacy (p. 60). Because the effects arrived at in these validation attempts are generally marginal and publication bias is a known problem in this field, they tend to be uninformative. Let’s not forget: marginal findings will almost certainly not survive large, preregistered replication.
These one-off post hoc justifications of audit study interpretations don’t close the inferential gap. Due to the incentives there are to publish findings that go in the “correct” direction, publication bias will always be hard to correct and will also limit the ability to build more complex theories on audit study literatures. You cannot build a theoretical castle over an empirical swamp. This was the problem with a recent audit study meta-meta-analysis published in Science. Liberally correcting for publication bias eliminated the evidence for the proposed theory. That was all it took, both in general, for studies on either side of an effect size of zero, in proposed moderator subgroups, etc. The finding was not robust and the article did not mention publication bias at all, so it was irresponsible to publish it in its present state.
Reforming audit study literatures is likely going to require serious attention to power analyses, preregistration, analysis planning, increasing code and data availability, and just generally doing what the credibility revolution demands. If this does not happen, then extensive theory-building is a practical impossibility. You cannot have credible tests of anything more than simple, intuition-based theoretical predictions if your predictions have no empirical basis to be made. If the pattern of publication makes literatures biased in a particular direction, the theories that can be built on them will probably reflect what’s been published even if it’s wrong. That’s true for two reasons: the findings permit only so many results within reason, and the people who produce the results will probably be the ones working on the theories.
As a result, using theoretically-expected findings as verifications of the literature’s methods through their results may be little more than spurious.
Does It Matter?
Return to the first part of this post, where I noted that skills or whatever euphemism you want to use for them definitely matter. How could this be true if the results of audit studies also showcase economically meaningful levels of discrimination?
Let’s just take for granted that they do. If people with the same skill levels end up in the same places regardless of the discrimination affecting one or the other group, what that suggests might be that there’s something akin to an iterated game going on. In each period, matched people in both groups play a round and have a chance of moving on, but in the favored group, let’s say they have a 50% greater chance of moving on. If they end up longitudinally reaching the same outcomes and following the same trajectories for the outcome, it suggests that the members of the other group are playing the games more often in less time per play in a compensatory manner.
Agree with the toy model or don’t, the result is there and it suggests audit studies may not be picking up on something meaningful, or the conclusions based on them might be overblown.
Does Discrimination Affect Skills?
The thing driving racial gaps in measured skills is general intelligence. This is known as Spearman’s hypothesis. To test this hypothesis adequately requires testing for psychometric bias. When bias is absent, this omits the possibility of the influences on scoring in different groups being different causes or influences that function differently. Papers on the subject frequently note this. For example, consider what Kush et al. had to say:
Our results… challenge proponents of the cultural relativism view of the nature of intelligence (Helms, 1992, 1997; Ogbu, 1994). This position posits that intelligence is culturally determined and that what constitutes intelligence for one subgroup (e.g., male vs. female; Black vs. White vs. Hispanic) might be something quite different from what constitutes intelligence for another subgroup. Frisby (1999) characterized this ideological position as the belief that “Lower-scoring American minority groups are exotic, having cultural traits and background experiences that are so unusual as to lay waste to traditional interpretations of cognitive abilities and its measurement with traditional instruments…” (p. 199). Helms (1992), for example, maintained that most g-related tasks are European-centered, emphasizing (among other things) “action orientation” and “competition”. “African-centered” values, in contrast, emphasize “spirituality,” “harmony,” "and “social time.” Similarly, Ogbu (1994) contended that research examining ethnic differences in IQ tests must recognize a distinction between voluntary or immigrant minorities and involuntary or nonimmigrant minorities. Ogbu posits that voluntary and involuntary minorities develop different cognitive frames of reference toward many things, including IQ test performance, depending on whether they or their ancestors freely chose to come to their new country or whether they were forced to immigrate.
Our finding of invariant latent intellectual traits between Black and White children directly challenges this position. This study provides empirical data that contradict unsubstantiated and speculative hypotheses typified by Helm’s (1997) suggestion of the possible differential impact socioeconomic status, culture, and race may have on measures of intellectual performance. She argues that racial bias may exist on Wechsler subtests such as Comprehension, where “Exposure to racism may mean that different social rules are operative (e.g., banks may not lend money to Blacks)” (p. 522 or that being timed on subtests such as Arithmetic or Digit Symbol might reflect a type of cultural bias. In this regard we agree with Frisby’s (1999) assertion that best practice advances in the assessment of culturally, racially, and ethnically diverse children will only occur when “indiscriminate talk” (i.e., the voicing of every opinion without regard to the critical evaluation or the relative worth of these opinions) begins to be challenged. Despite our frustration at the pace at which the test-fairness debate is evolving (and often not evolving), it is important to remember that ultimately psychology as a science must be supported by thoughtful, empirically replicated research rather than politically motivated advocacy positions.
All of that back in 2001! Many more studies came out since, showing, for example, that concepts like stereotype threat, what seems to be linguistic bias in comparisons between natives and immigrants, test-retest effects, and more are all capturable by testing for bias. Unfortunately, other work has shown that bias testing is in a state of dire disregard.
Discrimination is another one of the things that, after we find a lack of bias, is no longer up for consideration. The only way it could be would be for the discrimination felt by disfavored groups to operate similarly in favored groups.7 This is a somewhat absurd idea and so I’m not going to humor it. The main point is that we already knew name-based discrimination didn’t impact test scores. This latest study merely reiterates that point and reassures us that when making causal claims about what drives gaps in socioeconomic outcomes we know can be driven by skills, we aren’t just looking at effects of discrimination because there’s no room for a path from discrimination to skills.
Wrapping Up
Studies on the effects of names are very interesting, whether they’re about the effects of names on skill development or hiring outcomes. We should have more of them, but the field can’t be allowed to stagnate: it has to methodologically advance and involve gathering much more data to enable the more complex methodologies required to generate inferences that are cleanly interpretable.
Using a co-sibling control for causal inference regarding name effects on skills produced a set of results that was revealing on multiple dimensions. Firstly, it showcased a powerful example of selection, but it was selection through someone else’s actions. Secondly, it showed that other study designs are robustly harmed by that same selection. Third, it produced a result that was consistent with other methods from different fields. And finally, it provided something upsetting: an instance where researchers get to care about the lack of a causal effect, but the real world demands caring about selection. Employers operate on signals, which are what you get to see in cross-sectional data, even if the signals are only the results of causes and not the causes themselves. They can’t exploit causality for good hiring; all they’ve got is signaling.
Post-Publication Notes
Berkeley economics professor Chris Walters wrote a thread in response to this in which I believe he misunderstood some parts of this post, but he nevertheless pointed out something very interesting. He’s since deleted the thread, but you can see the remnants of discussion here.
In the thread, he linked a fascinating paper: a big data entry into the audit study literature! Unfortunately, it was explicitly not concerned with attempting to parse statistical versus taste-based discrimination, and it seems the authors don’t have much interest in that anyway. Instead, they seem to think that noting that discrimination is statistical justifies it. The implication seems to be that attempting to parse statistical from taste-based isn’t itself justifiable.
This line of reasoning seems highly impractical. History tells us taste-based discrimination can be crushed by market forces. Consider World War II. At the time, the population of the U.S. was still very racist, but nevertheless, the labor shortages that resulted from the war still led to relatively improved wages, homeownership rates, home values, and educations for Blacks. They might have also had social effects: individuals in counties with higher White casualty rates from the war, where the labor shortages were thus more severe, had more interracial friendships and were less supportive of continued segregation.
Taste-based discrimination is seemingly highly malleable, and it’s certainly the case that racial attitudes have improved over time. Very few people would now admit to actively discriminating by race and very few people probably do discriminate by race. This matters: in so far as statistical discrimination and taste-based discrimination are independent and statistical discrimination is discrimination based on real job-relevant differences, the strategies to address them may differ.
An irrational exaggeration of apparent group differences due to taste-based discrimination, stereotyping, or some other means of augmenting perceptions may lead to discrimination that begins statistically and ends up being far larger than it should be were the statistical discrimination entirely rational and well-calibrated. What could be used to reduce the gap and make statistical discrimination more accurate? I’m not sure, but it seems logical that if taste-based discrimination is reduced, so too should an exaggerated statistical discrimination.
If taste-based discrimination is entirely eliminated, statistical discrimination could remain due to real gaps in skill. But fixing statistical discrimination should not entail removing discrimination on the basis of skill, because that implies a need to hire less-qualified employees. Completely removing statistical discrimination necessarily entails biasing hiring processes if there are real differences in skill between groups.
I know of two means to actually eliminate statistical discrimination, but both require awareness of the legitimacy of its causes. The first is to target skill gaps. This is an ongoing effort and has been a focus of public policy since at least the 1966 publication of the Coleman Report. It has not been successful. But there are areas where deficits are known and can be ameliorated quite easily, they’re just not in school, they’re in medicine.
Schizophrenia is associated with many negative outcomes: lower incomes, reduced educational attainment, a lower probability of cohabitation, a high risk of violent crime perpetration, and being Black. But effective treatment is available and longer-term depot medication is currently in trials and treatment with implantable drugs should be a priority given the issues with adherence and its known effects on the risk of violent crime perpetration. The cost-benefit ratio for treatment is actually very good (long post in preparation). Because of the racial differences in rates, which are known to be genetic in origin, subsidies and the acceleration of medication approval are no-brainer policies that enhance everyone’s safety while improving the lives of sufferers, their families, and their communities. Because they bear a disproportionate number of sufferers and they are a disproportionate number of sufferers, this directly helps Black people more.
The second method is to reform the application process. Enforcing blinding at all stages, from resume submission to interviewing would immediately eliminate bias in the pipeline. But we can go further, recall: zero statistical discrimination (i.e., all items weighted equally) coupled with differences in the values of resume items by group means the process will be biased. To go further, universalize intelligence testing.
As noted above, intelligence testing is unbiased. It is also very useful for predicting job performance, allowing employers to greatly improve selection on the cheap. Think of this part of the reform like how admissions departments used to use a school’s test score performance to better understand grades. A GPA of 4.0 with a school-average SAT of 1500 and an average GPA of 3.0 means someone is very smart and hard-working; a GPA of 4.0 from a school with an SAT of 1000 and an average GPA of 3.0 means they went to a bad school or took easy classes and they’re not actually that bright. The degree to which a 4.0 indicates hard work is thus reduced, and you can even use that information to reevaluate the worth of things like holding club positions. Having knowledge of an applicant’s intelligence makes it easier to understand the value of every other resume item.
Bringing back intelligence testing would enable interviewers to waste less time in the interview process, and it would be an unbiased means to assess potential employees while reducing errors in the hiring process. But this is a major legal hurdle and it repulses many people, so getting it going would probably be much harder than obtaining support for universal blinding, although that’s probably not easy either. C’est la vie.
The fascinating part of the paper has to do with the quantitative versus qualitative nature of discrimination. Quantitative discrimination means that the Blackness of the name matters; qualitative discrimination means that the Blackness of the name only matters in so far as the name is considered Black, and not in terms of whether it sounds more or less Black. Qualitative discrimination was supported.
If this holds up, it suggests that choosing, say, more Black names or those within a particular racial group that are associated with lower socioeconomic status may not be a means to produce greater levels of discrimination on the parts of employers. They may just see that a name is Black and not that it’s Black * SES. This means that leveraging that information to make a ‘big data strategy’ require less sampling through more extreme sampling may not work.
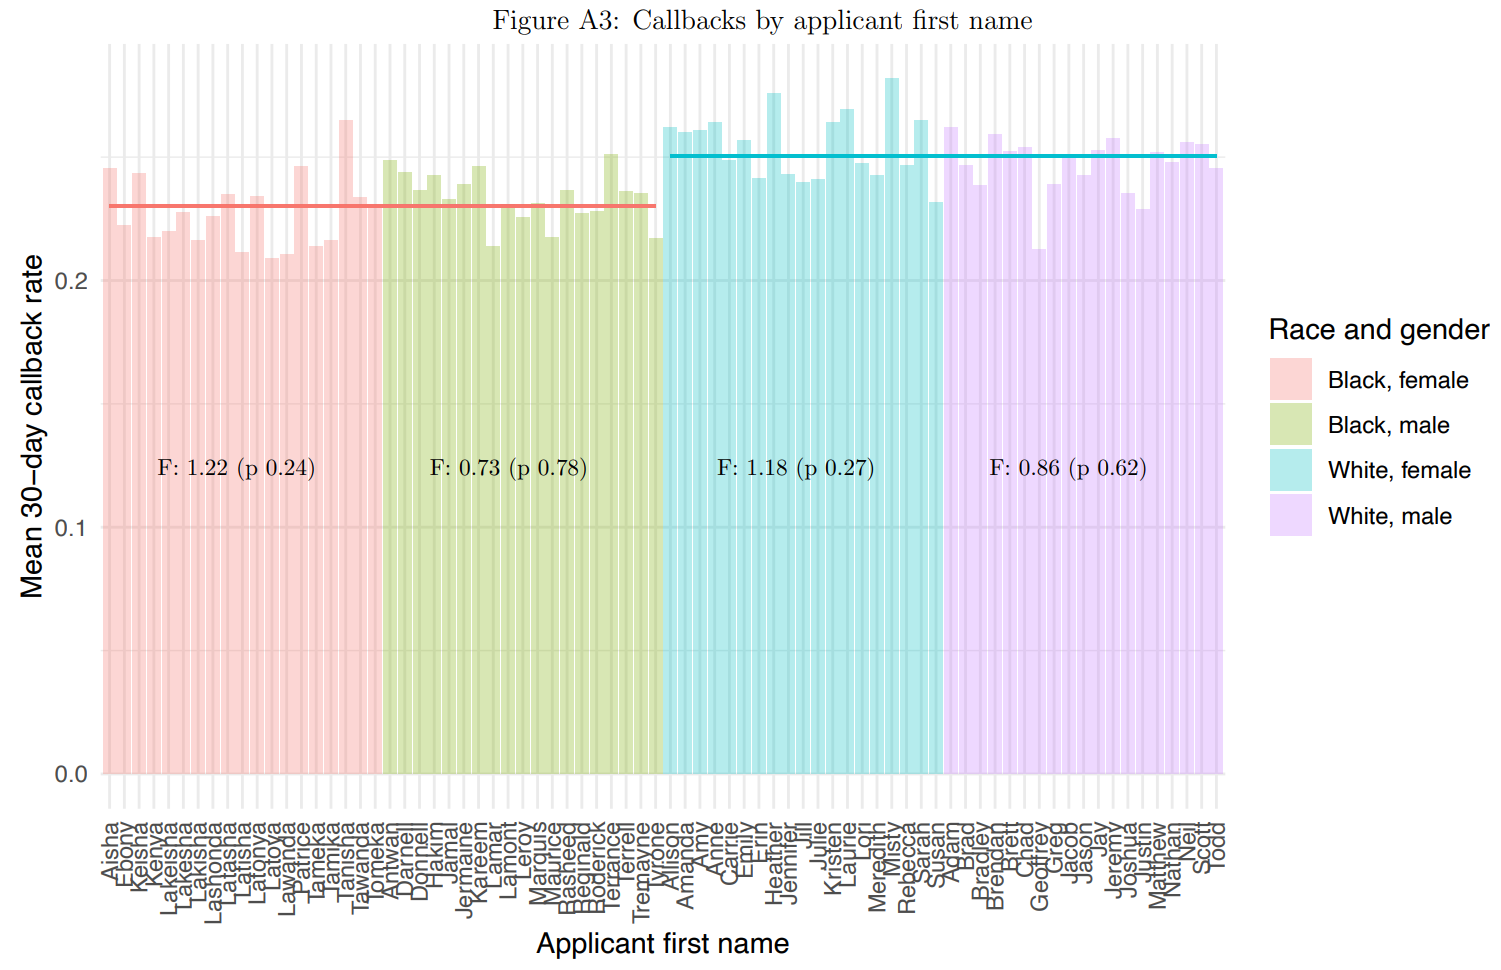
The other striking detail from that plot is the difference in callback rates. A staggering number of applications were sent out and the difference in callback rates ended up being much smaller than the one observed in work like Bertrand & Mullainathan’s It’s also smaller than the observed effects in meta-analyses.8 I guess this may as well go to show that one good study beats a publication bias-infected literature.9
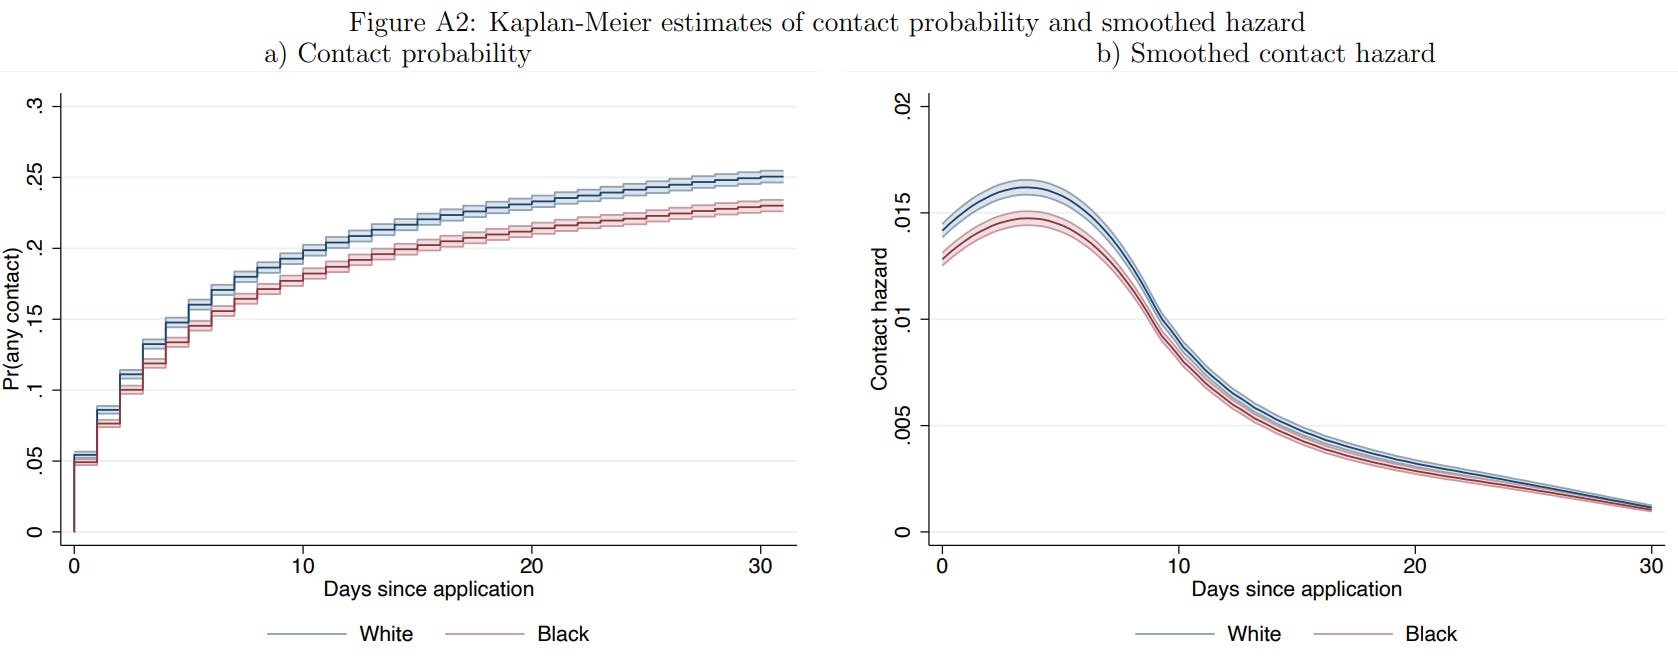
To put the minuteness of the difference into quantitative terms, consider Figure A2 from their paper. The 30-day callback probability for for Whites seemed to be 0.251 versus 0.230 for Blacks. This amounts to an odds ratio of (0.230/(1 - 0.230))/(0.251/(1-0.251)) = 1.122. That’s really not much! That’s like a Cohen’s d of 0.063 or a Pearson’s r of 0.032. It’s small. The best explanation for why outcomes may turn out equal at the same ability levels despite discrimination not affecting ability level and discrimination nevertheless existing may just be that the effect is so small that it’s easy to overcome. But we also don’t know whether this is statistical or taste-based, and if either of those is easier to overcome or more or less impactful.
I’d like to thank Chris Walters for pointing me to this interesting data and for giving me material to think about.
And because this is true longitudinally and the test score gaps are measurement invariant, we can be confident that this is not problematic.
This is more problematic for African than for White Americans because the former are much more likely to have half-siblings. This is usually due to pregnancies that are unplanned, that are disproportionately borne by mothers who are low in conscientiousness and do not pursue abortions they want, and it comes with extremely high rates of single motherhood.
If fathers play a role in naming, this can introduce a genetic confounder into the analysis. For example, if a mother names her child after the father, this could mean that the name is associated with the father’s traits. Or, if the father is involved in naming, this may introduce a correlation with his own traits in the same way. If a father is involved in naming and he’s a father who stays with a woman who already has a child, he might pick a name that contrasts with his child’s half-sibling and that child will obtain the name and the father’s staying-related traits. The same can occur for leaving-related traits and much else.
Because White families have relatively few half-siblings, the possibility of genetic confounders — or at least more limited controls for genetics — obtained through differences in paternity is less common and thus less concerning. But when it comes to samples in which sibling analyses are conducted in the United States and the target has something to do with poverty or race, this problem tends to rear its head time and again.
The other go-to study on this topic is Fryer & Levitt’s. This California-based study found that having a Black name was not associated with negative outcomes after controlling for the characteristics of mothers and fathers at the child’s birth. It was not concerned with test scores. Their most interesting point was when they speculated that an increase in the association between having a Black name and low socioeconomic status in the preceding two decades was a result of the rise of the Black Power movement and an outgrowth of increasing Black identity.
For the curious, the Black sample had 3,840,139 people and the White sample had 15,018,529. Their respective PSAT means and SDs were -0.70 (0.81) and 0.30 (0.91) and their SAT means and SDs were -0.75 (0.86) and 0.25 (0.90). These translate to Cohen’s d’s and Hedge’s g’s of 1.16/1.12 and 1.14/1.12. In the typical IQ metric, those are gaps of 16.8 to 17.4 points.
Which they do not in general but may in thresholded cases.
There are two other alternatives. The first is that a particular bias test has low power. If a reasonably-sized sample has low power, then that must mean that the proposed amount of bias is small and the biasing influence must be too. The second is that a particular influence is exclusive to a particular group and acts on all members homogeneously. This has been dubbed an “X-factor” or “Factor X” and it is unfalsifiable, making it a pseudoscientific alternative. It is hard to think of what one of these influences could be, as they have to fit a number of other constraints that make them unwieldy.
Quillian et al. (2017) recorded a Black-White OR of 1.36 for studies published between 1989 and 2015. They did not check for publication bias. Instead, they tried to perform a substantive check for it by contrasting published and unpublished estimates and studies where race was or was not a focus. These are not methods of estimating publication bias. If the former method were, then there wouldn’t have been publication bias for the unpublished studies in the money priming meta-analysis cited here, but there was. The suitability of the latter as a check is constrained by the number of available studies, so the method used to check was underpowered since it was applied to a small number of studies (k = 21). Downloading their replication files and rerunning their Black-White meta-analysis, I am able to mostly reproduce their result. The OR I arrived at was 1.37 instead of 1.36, so it’s presumably down to software, where I used The R package metafor and they did their meta-analysis in Stata. When I went to trim-and-fill, there was evidence for a large amount of bias: 10 studies were filled in, resulting in the effect being reduced to an OR of 1.25. For such a small effect, there was a major absence of nulls or negative estimates. But that’s what you get with publication bias, and their failure to check it with established methods whilst also dismissing its presence is not surprising.
Lippens, Vermeiren & Baert recorded a Black-White discrimination ratio (DR) of 0.6401 for 26 studies published between 2005 and 2020. Unlike Quillian et al., they did check for publication bias, and they opted to use a limit meta-analysis as their correction tool. This reduced the effect to a DR of 0.6845. This meta-analysis was not as biased, but it was more extreme. These DRs seem to be interpretable like RRs, so they correspond to 1.56/1.46.
Gaddis et al. recorded Black-White DRs across more contexts than just hiring. They recorded them based on correspondence audits for higher education, rental housing, medical, public services, and other. Throughout their study, odds and risks were conflated. Exponentiation their overall log RR form Figure S3.1., it came out to 1.15, but in hiring specifically, it was more extreme than in other cases at 1.28. They did not investigate publication bias. Their method for handling “small study bias” was to contrast random and fixed effects estimates, but this obviously does not correspond to checking publication bias. I coded up their Hiring results, treated them like ORs instead of RRs, and arrived at a meta-analytic estimate of exp(0.2467) = 1.28, and trim-and-fill suggested adding 11 studies on top of the existing 49. This reduced the OR to 1.19. Since their paper is still a preprint, it needs to be checked again to make sure the estimates are correct (no conflation of RRs and ORs), with checks for publication bias rather than a simple contrast between RE and FE estimates, and with their data and code provided.
Heath & Di Stasio performed a meta-analysis of audit studies in the United Kingdom between 1969 and 2017. They did check for publication bias with trim-and-fill and achieved unadjusted log RRs of 0.447 for West Indian/Black Caribbeans and 0.483 for Black Africans. With adjustment, these became 0.383 and 0.470, or RRs of 1.47 and 1.60, respectively. The number of estimates was 10 and 3, so there was no power to detect or adjust for publication bias. If this result is to be believed, it seems discrimination is much worse in Britain than in the U.S. Due to the data being as limited as it is, any conclusions, whether they’re about magnitudes or bias need to be held off until there’s more data.
Finally, Quillian et al. (2019) meta-analyzed 97 audit studies across Belgium, Canada, France, Germany, Britain, the Netherlands, Norway, Sweden, and the United States. Their aggregate White versus non-White log DRs were 0.35, 0.35, 0.62, 0.20, 0.43, 0.25, 0.29, 0.50, and 0.28, based on 6, 18, 28, 5, 32, 19, 4, 8, and 39 studies. Only the U.K. and U.S. had enough studies to plausibly check for publication bias, but nevertheless, the trim-and-fill results were 0.45, 0.34, 0.62, 0.19, 0.39, 0.29, 0.29, 0.50, and 0.23. For the U.S., that’s dropping from 1.32 to 1.26.
To compare these estimates to this much larger audit study is a bit difficult. There were differences among studies in how broad or narrow their definition of a callback or discrimination was, and how long their follow-up lengths were. To go into all of these differences here would be a waste of time, but studies like Lippens, Vermeiren & Baert’s showed that these sorts of methodological details make a bit of a difference, but those effects are not as large as the discrepancy between this large study and these meta-analyses.
A detail people often ask is how can we be sure one excellent study beats many smaller, more heterogeneous and generally-lower quality studies? Large, high-quality studies generally agree far more than lower-quality studies did and their agreement on more minor estimates is replicable. Take the previously-mentioned literature on money priming. The nulls generated in preregistered replications were replicably null, whereas the results of the published and unpublished non-preregistered literature were all over the place.
The process by which correction with larger and better data may happen seems analogous to Feynman’s example of Millikan’s oil drop experiment and the work that built on it.
Any sources on the growth of "black" names over time? It's interesting in that it seems like a cultural divergence that's increased in recent history. All the more interesting for being a class divergence as much as a race divergence.