Diversity Goals Imply Quality Trade-Offs
Meritocracy is superior to affirmative action.
Diversity goals compromise the operation of organizations and they contrast with the principle that the greatest rewards should go to those making the greatest contributions.
Does Diversity Accentuate Meritocracy?
There are those who believe diversity goals accentuate meritocracy. They contend that diversity, equity, and inclusion (DEI) initiatives help to discover talent from minoritized populations that have been historically marginalized, and whose talented members have, accordingly, been ignored in favor of less-talented persons from favored groups. This belief is, frankly, balderdash and the reality is that less-talented groups are obviously favored.
Consider the Black-White admissions gap at Harvard. SFFA v. Harvard revealed a lot of data and it showed conclusively that, under meritocracy based on academic qualifications, Black admissions would decline by nearly three-quarters.

The Harvard admissions department actually had to use a biased personal rating measure to justify their discriminatory behavior and to make their rejection rates look less suspicious, they encouraged lots of applicants from underperforming groups to apply just so they could reject them. Harvard isn’t alone, either. When schools are explicitly banned from practicing affirmative action, they get around it through practices like comprehensive reviews that allow them to continue discriminating on the basis of race, in favor of low-performing racial groups, through the use of proxies. Think about the reaction of the University of California to being banned from engaging in affirmative action:
The actions that Berkeley and UCLA admission offices took to collect and weight black-correlates in admissions after the ban suggest that they continued to value racial diversity and searched for ways to increase it. Contemporary quotes corroborate this assessment. UC administrators strongly opposed the ban: as the California political climate turned against affirmative action in 1995, the UC president, UC vice-presidents, and the chancellor of each UC campus united to “unanimously urge, in the strongest possible terms,” the continuation of affirmative action. Berkeley’s dean added “The need to diversify the legal profession is not a vague liberal ideal: it is an essential component of the administration of justice.” The day after voters approved the ban, the UC president announced that the question facing the university was “How do we establish new paths to diversity consistent with the law?” One year after the ban, Berkeley’s dean launched an audit of policies and procedures “to see whether we can achieve greater diversity” after “dire” admission results. UC administrators were not systematically replaced in the subsequent years; for example Berkeley’s dean and the UC president continued in their posts through 2000 and 2000, respectively. Christopher Edley, a vocal proponent of affirmative action and formal adviser to President Bill Clinton on the topic, has served as Berkeley’s dean since 2004. (Yagan, 2012, p. 22)
People more recently behind the scenes at Berkeley have confirmed engagement in these efforts. And why wouldn’t that have happened? When the affirmative action ban went into effect, they treated it like a pandemic had broken out.
Their efforts to avoid meritocracy paid off, at least a bit, and it’s been documented that the ban resulted in major reductions in Black admissions that Berkeley eventually reduced somewhat through those efforts.
States like Florida and Texas have also attempted to work around affirmative action bans through the use of top-20% and top-10% rules.1 After their implementation, both also saw schools begin to consider various non-academic factors that were obviously biased to use. Long and Tienda recounted that the bill creating Texas’ top-10% rule “explicitly named [criteria] for college admission [that] are… nontraditional factors that could be used as proxies for race/ethnicity in order to achieve institutional diversity.”
Universities and firms clearly want to racially discriminate, and they will go to extraordinary lengths to do so. But what happens to the beneficiaries?
Law is an area with excellent documentation of the effects of affirmative action on its beneficiaries. At present, two clearly incompetent women—Ketanji Brown Jackson and Sonia Sotomayor—sit on the Supreme Court. They may be the most notable contemporary beneficiaries of affirmative action, but they’re far from the only ones.
There’s a famous article entitled The River Runs Through Law School. In it, Lempert, Chambers and Adams made the positive case for affirmative action in law school admissions. These authors had access to data from the University of Michigan, and what they found suggested affirmative action might be hunky-dory.
They documented that their graduates of different races had very different LSAT scores, but comparable incomes after graduation. Moreover, the minority graduates went on to act in other ways like the White graduates: they did pro bono work, they mentored people, they gave time and money to their communities, etc. There was also a considerable amount of ethnic matching, such that if an alumni was Black, he was more likely to represent Blacks; if he was Latino, he was more likely to represent Latinos; if he was Asian, he was more likely to represent Asians, etc. In their data, the LSAT and grades even lacked predictive power for outcomes down the line.
Using academic quality alone, many of these minority admits wouldn’t have gotten in so, they alleged, this speaks to the importance of affirmative action.
What people don’t mention about this study is that it’s just conditioning on a collider. The paper could have said height doesn’t matter in basketball because it’s uncorrelated with performance in the NBA, but that would have made the issue obvious. The study also subset to graduates, ignoring dropouts, and the White group had a higher response rate than the other groups (61.9% vs 51.1% for Blacks, 51.5% for Latinos, 54.2% for Native Americans, 59.1% for Asians, and 51.4% for all minorities), meaning the sample that was ultimately used was likely to be less selective for Whites.
This study, popular though it may be, isn’t capable of telling us much.
If we want a clear picture of the differences in academic qualifications, we have it: there’s national-level data from around the same time via the Law School Admissions Council (LSAC). Rothstein and Yoon reported this and more data. Firstly, by scores, 89% of the lowest-scorers in the combined sample of Black and White law school applicants were Black. On the other end, 98.6% of the highest-scorers were White.2
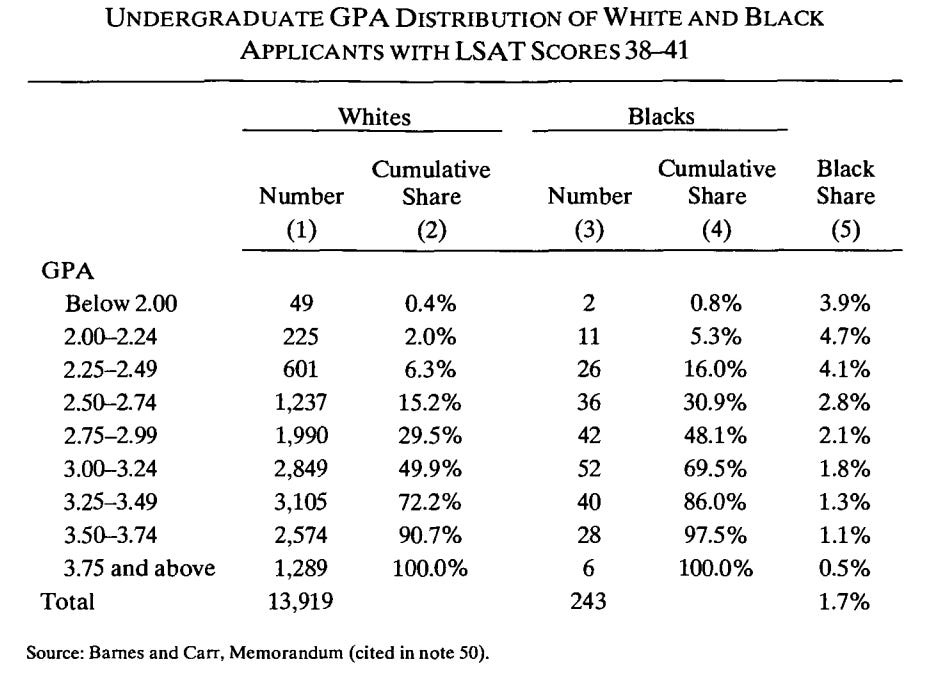
LSAT scores and GPAs are also correlated, but even with the same LSAT scores, White applicants tended to have higher GPAs than Black applicants:
Combining both LSAT scores and GPAs into a percentile score, the picture is vivid:
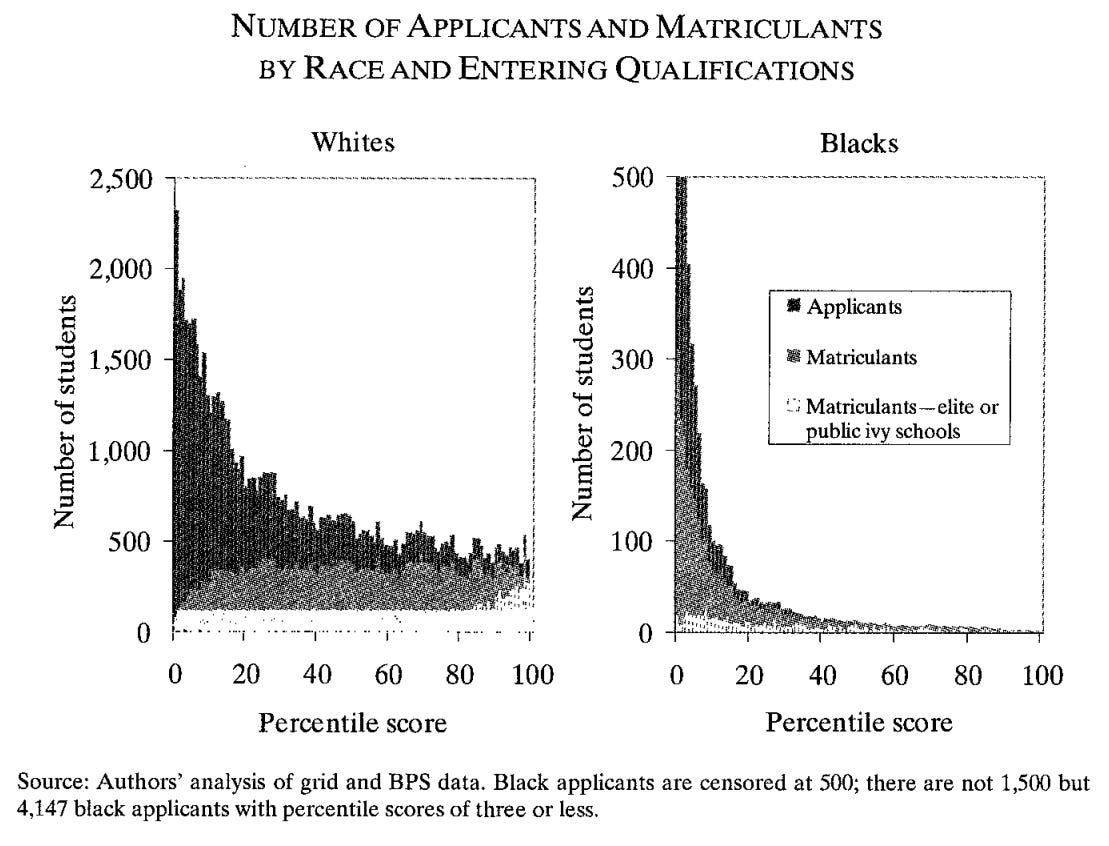
But this doesn’t make affirmative action problematic. After all, no one feels slighted when there are unqualified applicants, they care about unqualified matriculants. Here’s how those look:
Black matriculants are much less academically qualified than their White peers. It shows, too.
Within institution class ranks for Blacks were consistently lower at each level of academic qualification, reflecting a combination of being less qualified, measurement error meaning they should regress more from their attained academic percentiles, and that Blacks matriculated at more elite institutions than similarly-qualified White applicants.
The graduation rates of the two groups were similar across the range of academic qualifications, but this fact is somewhat misleading. Remember that the majority (almost 60%) of Black matriculants had academic qualifications in the bottom decile, so Blacks overall had substantially lower graduation rates than Whites.
Now here’s an outcome where measurement error in the academic percentile scores matters a lot again, and it’s also an instance where restriction of range matters in two directions. This outcome is initial bar passage rates. At the highest levels of initial performance, Blacks and Whites perform equally, but at the lowest levels—including most Black matriculants, and beyond which, an unrestricted score would probably show disproportionately more Blacks than Whites—there are major gaps.
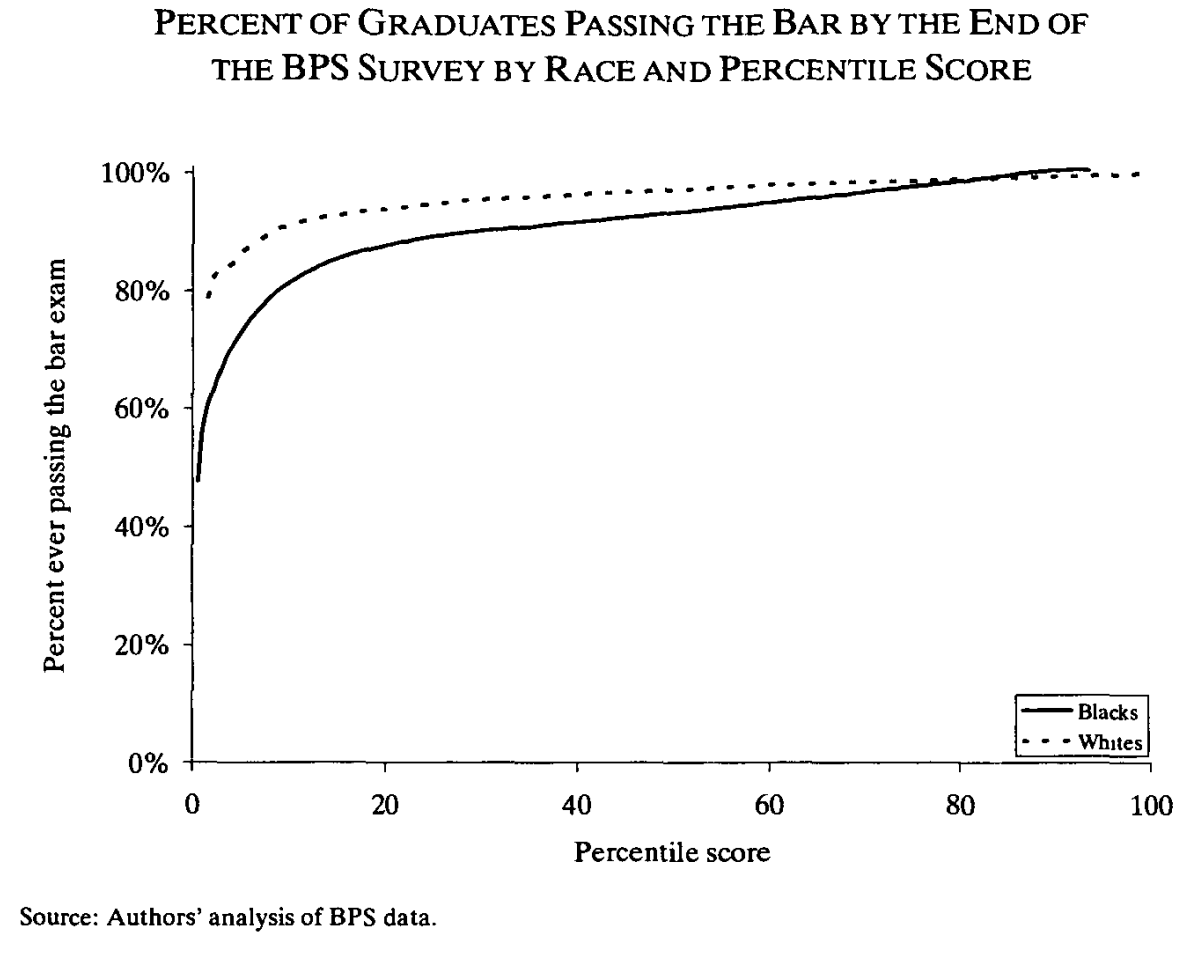
This immediately suggests that the affirmative action-assisted educations provided to Black matriculants were a waste. If they crowded out White matriculants, chances are they crowded out lawyers who could have passed instead of failed. Coupled with differences in graduation rates, the waste is even greater. But people can retake the bar twice a year. If we look at eventual bar passage rates, about half of the waste is eliminated:
But it’s hard to think of this as good. Relatively unintelligent lawyers won’t practice law well, so even if they make it, it’s a relative waste if they crowded out a more qualified candidate. Bar passage rates can go a long way to predicting the racial gaps in disbarments, probations, and complaints made against attorneys, so it’s also reasonably certain these eventual-passers are less qualified to do their jobs.
Being underqualified doesn’t mean Black matriculants aren’t well compensated though. Employers want diverse lawyers, but they also want them to be qualified, and remember, most of the Black lawyers are in the bottom decile of performance among lawyers. These two facts together mean that employers are competing for a small pool. That means Black lawyers have a lot of bargaining power and they get employed at good places.
In the 60ᵗʰ to 100ᵗʰ percentile of performance, Black lawyers were 33% more likely than White lawyers to end up with a good job after taking the bar, and they were 20% more likely to end up at a large law firm. The relationship between being Black and log annual salaries in the 0ᵗʰ to 10ᵗʰ percentiles was -0.025 (SE = 0.130); in the 60ᵗʰ to 100ᵗʰ, it was +0.155 (0.059). That’s a big initial boost, and it applies to Blacks from the 10ᵗʰ percentile on.3
Despite this big boost, Black lawyers earn less than White lawyers.4 Richard Sander presented data showing this difference in 1990 and 2000, within different age groups. Whereas for other jobs, gaps tend to be stable or diminish with age, earnings gaps between lawyers of different races grow by late middle age:
In later data, Sander also documented that, even within large corporate law firms, Blacks were less academically qualified, averaging considerably lower GPAs:
To explain this, Sander wrote:
There is no question that large firms pay a large premium to recruit law school graduates with high grades. Among large-firm associates, those with higher grades are more likely to prosper and be promoted. Minority associates hired with large preferences thus enter the big firms with lower credentials and at a great disadvantage. All of their subsequent experiences—more difficulty getting training and mentoring, fewer assignments, less responsibility, higher attrition—are consistent with worse performance.
Big law firms go out of their way to hire Black lawyers—diversity is in demand—but they recognize that Black lawyers underperform, so they don’t promote them, they don’t give them as many assignments, and they let them drift away from the firm, to be replaced by the next diverse, underqualified hire. Jee-Yeon Lehmann presented additional evidence of this in 2013:
I show that when affirmative action at hiring raises the hiring rates of blacks but leaves assignment standards to the promotion-track unchanged, this divergence in strategies can lead to lower promotion rates for blacks than had such a policy not been in place. Using data from the After the JD study… I find that compared to whites of similar credentials, blacks are more likely to be hired but are assigned to worse tasks and less likely to be a partner seven years after entering the bar, even conditional on observable correlates of productivity. These black and white differences in promotion rates can be explained by dissimilar task assignments received as associates.
A similar phenomenon is observed in Major League Baseball (MLB). As part of the MLB’s efforts to diversify its managers, they’ve promoted numerous minorities to being first-base coaches, but the more prestigious and strenuous third-base coaching positions have remained substantially more White. Because there’s more promotion from third-base coaching positions, this can explain part of why Whites are more likely to end up in higher-level management roles.5
Back to Sander. He wanted to make this case even more robust, so he requested the State Bar of California hand over the data. They said no, citing privacy concerns, so Sander sued for access. Unfortunately, the data remains hidden: Sander lost his court case and the extent of ability mismatch among lawyers that’s induced by affirmative action remains only so well documented. The evidence could be much stronger, but authorities hide the data, so we’re lucky to know what we do.
People and firms make valiant attempts to recruit diverse applicants, resulting in mismatched recruits and quite likely crowding out the more qualified. Authorities also attempt to stop data on this from getting out. But what if diversity is still good for firms?
To understand why this is an unserious suggestion, we have to remember that firms bid up the wages of diverse hires. They’re paying extra to get people who are less qualified, but then they don’t promote them to areas where they could theoretically make large differences for the firm. Instead, they’re there to save face and to meet their metrics. If they really wanted to either use or show off their diversity, they would, of course, make diverse hires their leadership rather than using them to fill grunt positions. But it’s not reasonable to suggest they’re foregoing money when they don’t do this. If interaction effects with diversity were real, firms would be foregoing money if they didn’t prioritize diverse recruitment to an extreme degree, but this is not what they do in any sense, or there wouldn’t be discrimination against Asians. Anyway, we have nothing but positive reasons to believe qualifications predict outcomes similarly for different demographic groups.6
Firms like McKinsey and academic research teams aplenty have published research suggesting that diversity is associated with corporate or scientific performance.7 But the common theme of their analyses is that they are not causally informative. Instead, they exploit the fact that, for example, high-performing firms can afford diverse boards; they can afford to take hits, and they succeed in spite of it, often by relegating diverse hires to reduced duties. They might also be able to bid for the best of the diverse hires out there. The same principal applies to research teams, in that the most prestigious institutions attract the most talent, regardless of background. If they diversify while doing so, it’s unsurprising we might see diversity and success being associated even without some diversity-by-achievement interaction effect.
It’s an empirically-unsupported joke of a suggestion to say that diversity actually pays off on its own or that it outweighs the cost of reduced hire quality when it’s prioritized over merit. Interaction effects are hard to support and main effects dominate.
There is no reason to believe that diversity will, in its own right, generate positive outcomes for those who are not being favored. They will often make the beneficiaries of discrimination individually better off, but there’s no good reason to think they’ll make society better off. Since they imply a quality tradeoff, diversity initiatives—which are inherently unfair, as they disadvantage members of higher-performing groups—are hard to justify on anything but abstracted fairness grounds.8 They’re like reparations.
Oh, and they do imply trade-offs in the quality of hires.9
Firms Must Fight Over Talented Minorities
Let’s do some simple simulations.
We’ll have three groups: non-Hispanic Blacks, Whites, and Asians. Whites will have a mean IQ of 100 with a standard deviation of 15, and Asians and Blacks will have the same variance with means of 85 for Blacks and 107 for Asians. To match empirical values estimated in 2022-23, we’ll give them standard deviations of 16 for Asians and 13 for Blacks. We’ll also assume normality, even though it is technically true that there are normality deviations at the lower end of the IQ distribution.10 Because these simulations are focused on the right tail, there’s no problem.
Let’s look at the cumulative distributions of IQ scores by group:
As you can see, 100% of Blacks are observed by a lower IQ level than are 100% of Whites or Asians. But to make things clearer, I think we should scale these numbers by population to see the cumulative number. For this, we'll assume America has a population of 331.9 million, of whom 13.6% are Black, 7% are Asian, and 61.6% White. That results in cumulative numbers of:
Since America has just over 200 million White people, there will be many at every commonly observed IQ level. It’s interesting, however, that there seem to be fewer Whites than Blacks below an IQ of 75.
Next, we need to stop summing and start seeing the numbers by level. Across the whole 50-150 IQ range just modeled, we see a lot of White people, but we can also clearly see the means for Whites and the effects of the ‘equal’ and ‘empirical’ variances on the other distributions:
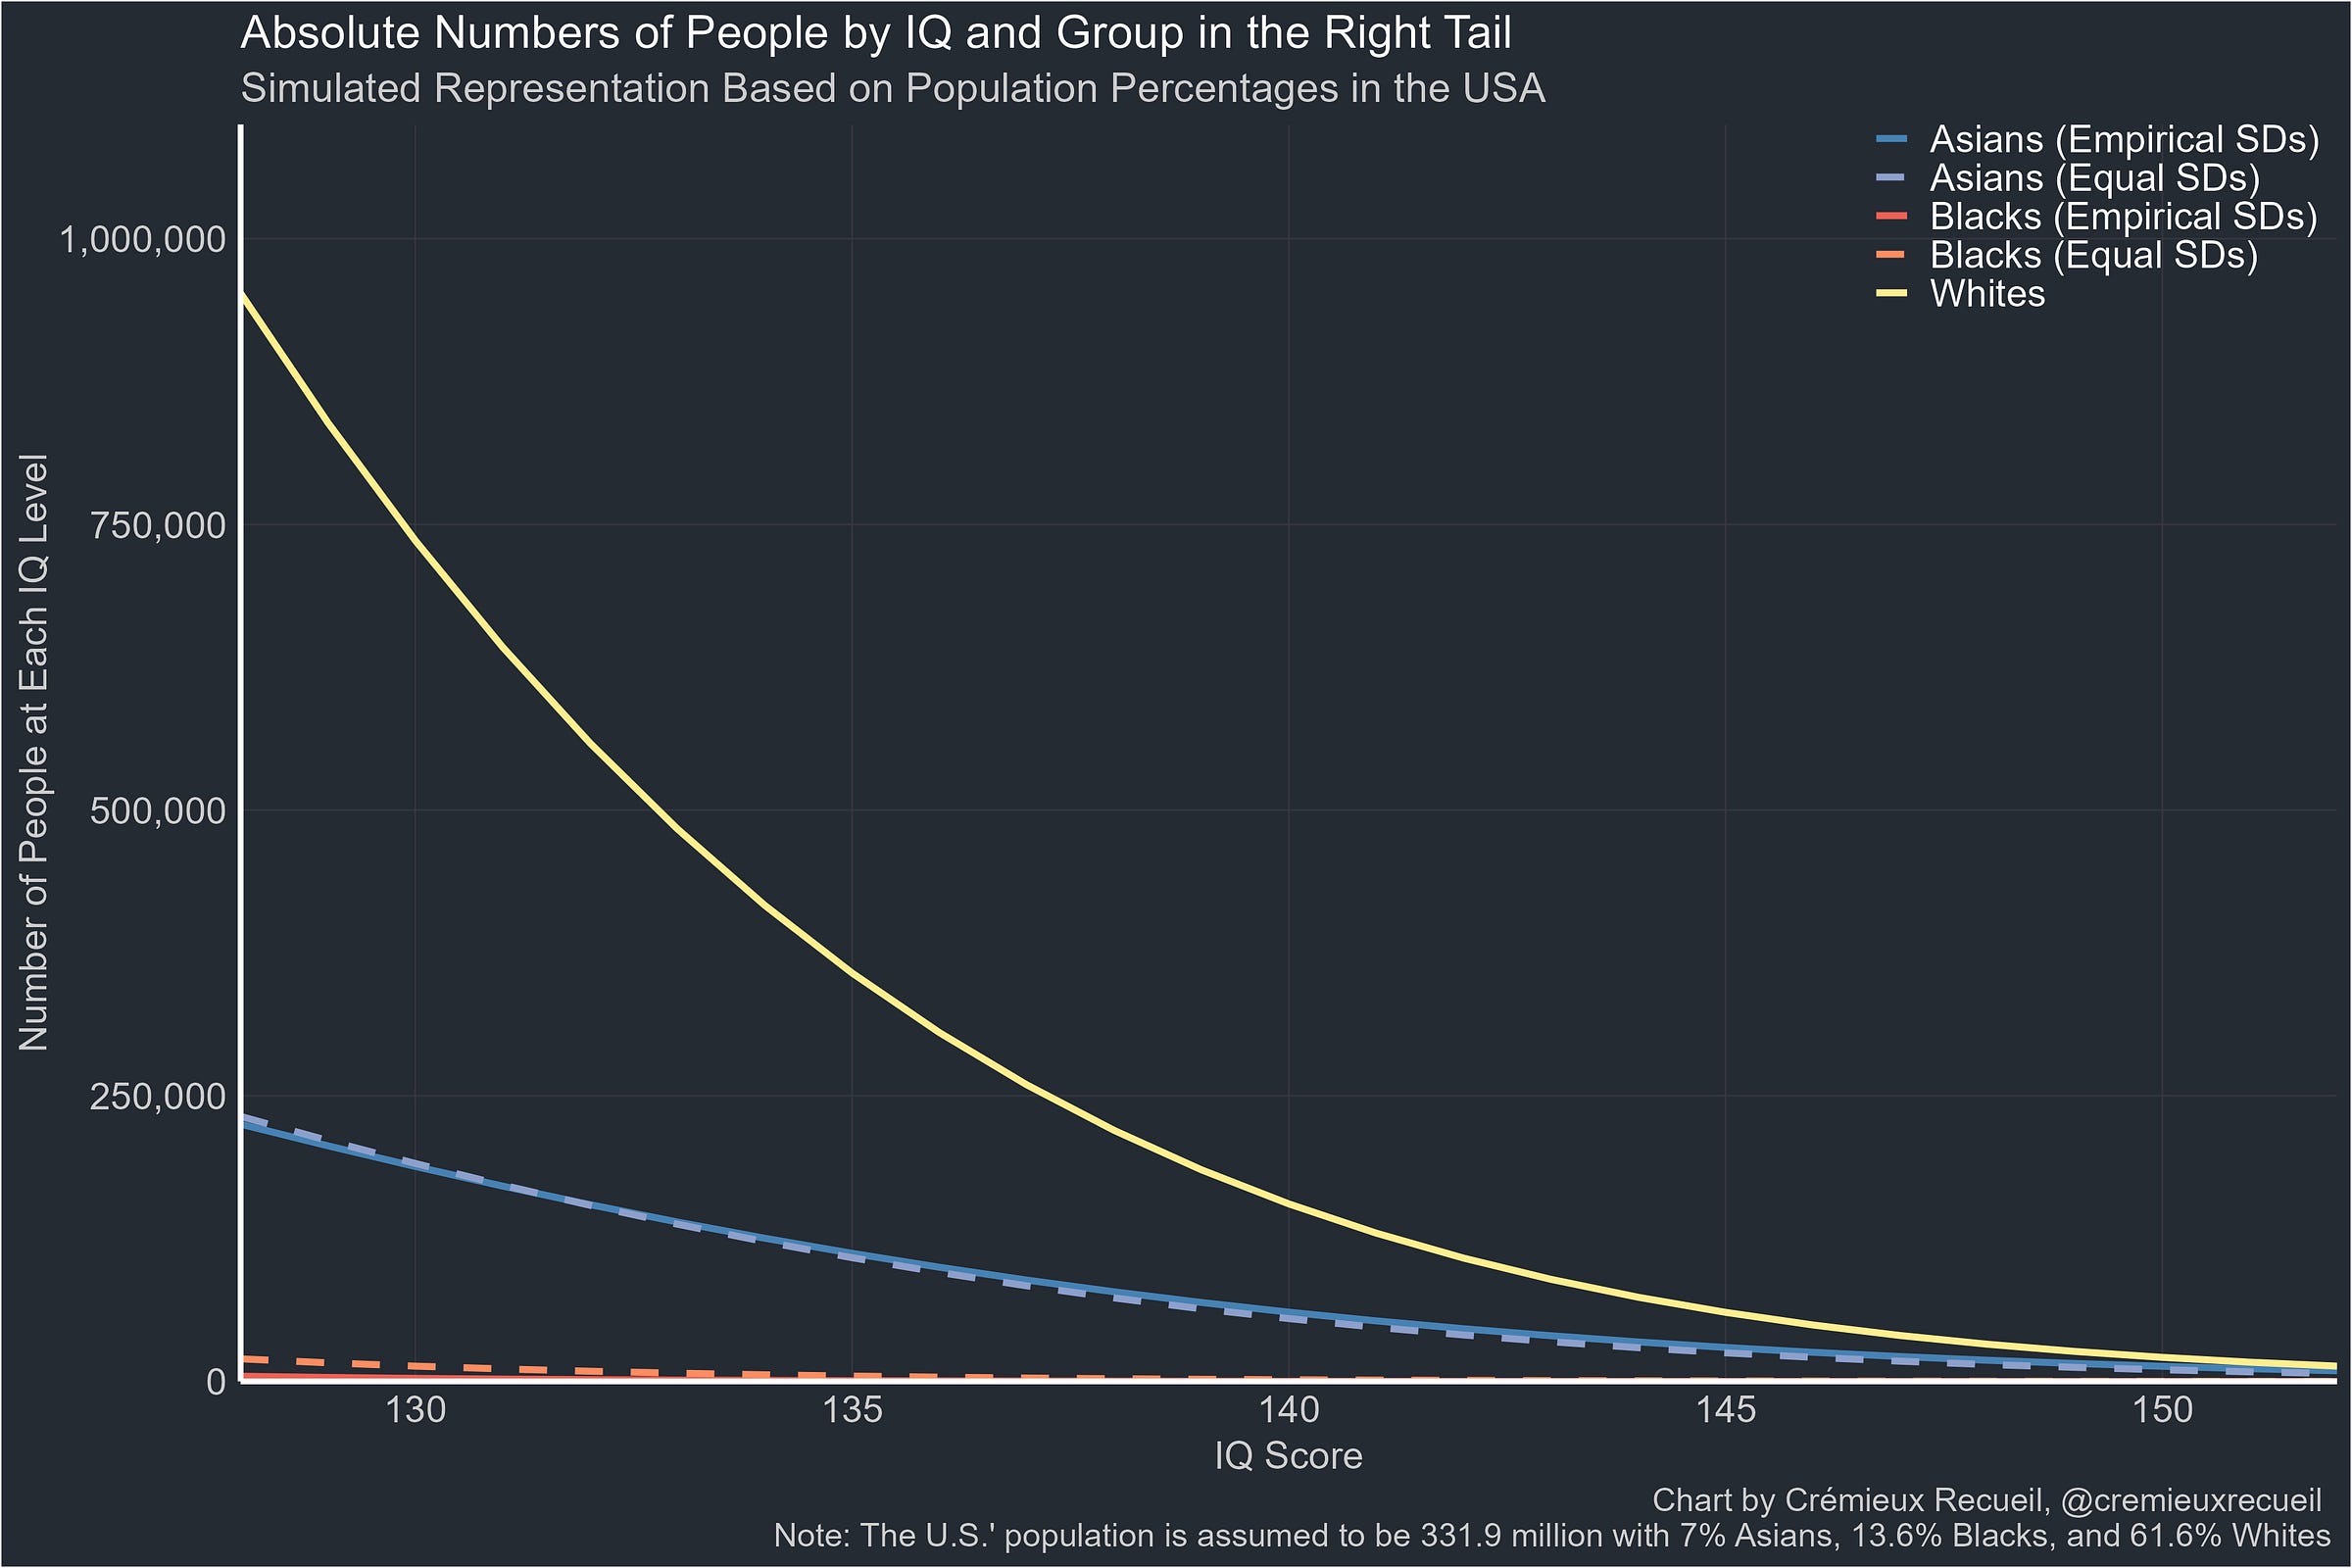
To get to the interesting part that has implications for the quality trade-off inherent in affirmative action initiatives11, we need to look at the right tail of the distribution, where the most talented people are:
The number of very smart people is very small, even in a country including some 331.9 million people. With the specified population size and group percentages, there are 4,651,274 Whites with IQs above 130.
With empirical values for Asians, there are 1,552,132 who have IQs above 130. That’s roughly a third as many people with IQs above 130 as in the White population despite there being almost nine times as many Whites. Small mean differences matter, but if we place the Asian mean at 107 and give them the White variance, the number with an IQ above 130 falls to 1,454,313, or about 100,000 fewer, showing us that small variance differences can have even more extreme effects.
With empirical values for Blacks, there are only 9,084 with IQs above 130. That means the Black population has <.2% of the people with IQs above 130 as in the White population, despite the Black population being 22% as large and almost twice as numerous as Asians. Even if we give this population the White variance and a mean of 85, things aren’t much better. In that scenario, there are only 60,933 Blacks with IQs above 130. That’s 1.3% of the White number and that’s being generous!
Those who want to recruit a highly-talented workforce that also meets modern diversity criteria will have to compete for the small number of gifted people from low-performing populations. That is why Black lawyers’ wages were bid up starting at the high-enough part of the ability distribution.
But we can simulate this more directly.
Diversity Isn’t Free
We can directly compare meritocracy and diversity goals through simulated selection.
For this simulation, we’ll use the empirical IQ means and standard deviations for Blacks, Whites, and Asians, and we’ll rescale the total population size to a population of 100,000 exclusively composed of these groups. So we’ll have
0.616/(0.616 + 0.07 + 0.136) = 74.94% Whites (100, 15)
0.07/0.822 = 8.52% Asians (107, 16)
0.136/0.822 = 16.55% Blacks (85, 13)
My seed for this is 1 for 1-3, 4 for 4, and 5 for 5. The scenarios I’ll simulate are as follows:
In Scenario 1, we will see the result of pure meritocracy: 1,000 people will be picked from the top down, by their tested IQs.
In Scenario 2, we will do the same, but institute representation goals, such that 74.94% of the sample must be White, 8.52% must be Asian, and 16.55% must be Black.
In Scenario 3, we will expand this to demand equal representation: 33.33% White, Asian, and Black.
In Scenario 4, we will ban IQ testing, and employers will instead have to rely on education, which is distributed on a scale from 0 to 20 years of education and which correlates with IQ at 0.50. The mean will be 15 years of education with a standard deviation of 3, no more than 10% of the population will have fewer than 12 years of education, and there are no negative values.
In Scenario 5, we will introduce desire for money. This is a variable that’s correlated at 0.33 with individual IQs, and it augments the odds of turning down an offer by 5% per point, where it runs from 0 to 10 with a mean of 5 and a standard deviation of 2.
In the order given, these scenarios are Pure Meritocracy, Population Representation preferences, Equal Representation preferences, Credentialism With Equal Representation preferences, and Credentialism With market Alternatives.
Across scenarios, we see that the highest IQs are obtained when there’s direct selection on IQ, and selection works better without group preferences.


