Age, Crime, and their Weakening Link
Puberty matters less than it used to.
Inquisitive Bird produced an extremely interesting chart. Take a look:
They depicted a curious difference in “peak criminality”1 between the sexes: in this Danish data covering the years 2010 through 2021, men were their most criminal at age 19, whereas women were their most criminal at age 16.2 That difference is similar to the one-to-four-year age gap in puberty onset.3
Inquisitive Bird’s chart was inspired by earlier data exclusively focused on homicides committed by men. The data was derived from three different locations between 1965 and 1992 and, at one point, it was covered by The Economist.4
The similarities between these original charts and the Danish data are undeniable in form, albeit with a staggeringly differing scale. I believe the similarities are enough that I can go ahead and say that Inquisitive Bird has performed a replication, and through including women, they’ve provided an extension: perhaps peak criminality is earlier for females than it is for males.
Can I replicate this extension?
The FBI’s Uniform Crime Report (UCR) contains extensive documentation regarding criminality in the United States for the years 1995 through 2019. UNdata provides a wealth of data gathered by the United Nations Statistics Division, including population statistics by age for most of the world. Together, these can be used to attempt a replication of Inquisitive Bird’s findings.
The FBI UCR data that provides the most direct replication is the numbers arrested for violent crimes by age and sex. Male data is contained in Table 39 and the corresponding female data is in Table 40 in each year. The data from the United Nations is more self-explanatory to obtain. To make it workable alongside the FBI data, however, it has to be aggregated. The reason for this is that the FBI bins different ages together. So for example, take the first year of data provided by the UCR, 1995.
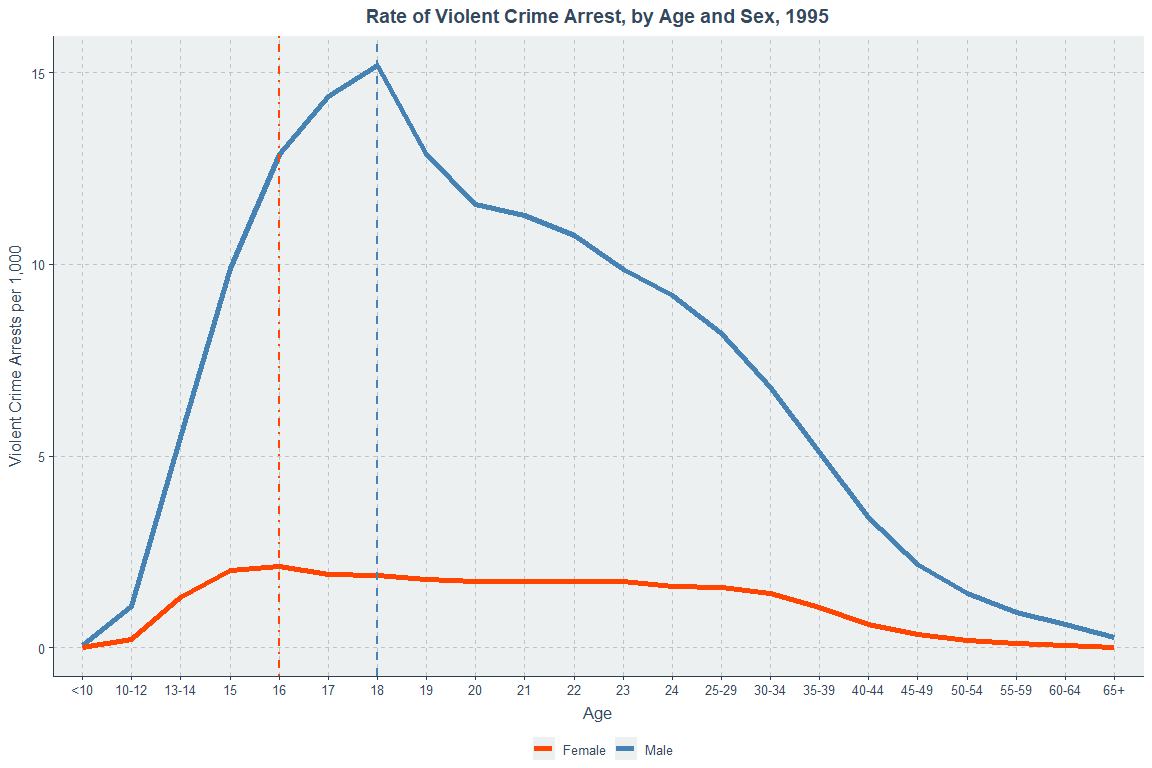
All ages below 10 are thrown together, 10-12 are one grouping, 13-14 another, and 15 through 24 have their own. There are two ways to treat this. Firstly, I could just treat these groupings as god-given, as a factor. Secondly, I could treat them numerically, taking the midpoint for some of these ranges and extrapolating accordingly. Doing that makes the chart something of an exact replication. See:
For the sake of completeness, I will present both forms of results, but this methodological issue needed to be noted.5 Here are the numeric age results:
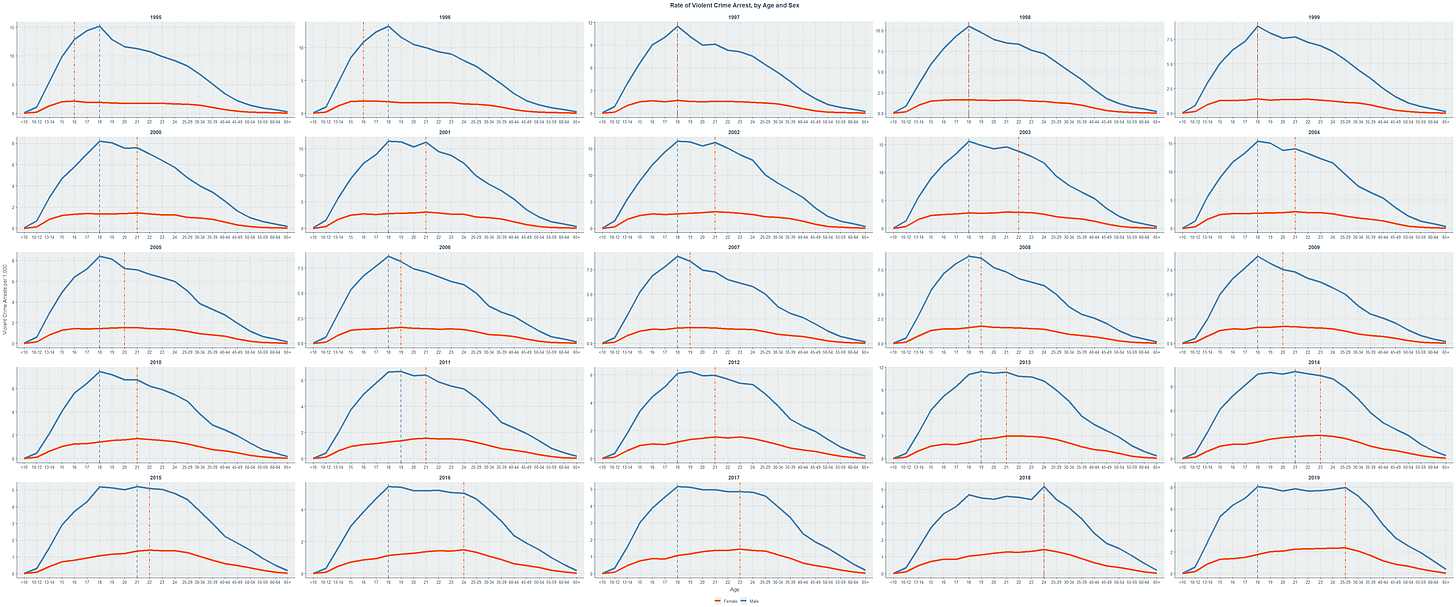
Visually, the results may be overwhelming.6 What really stood out to me was the replication of Inquisitive Bird's work only up until 1997, when men and women peaked at the same age. After that point, women always peaked later then men, or at least tied them. To make this clearer, look at the earliest year, 1995, and then look at the latest year, 2019.
Clearly something else worth noting also happened: the distribution has flattened and the peaks moved to older ages. For women, the shift to an 18-year-old peak happened in 1997 and then the typical peak moved to 21 come 2000, before moving to 23, 24, or even 27 in more recent years. Also importantly, men and women’s violent criminality rates are now closer.7
Before 2011, men always peaked at age 18, but since then, men have been slowly moving up too. Peak criminality is still occasionally 18 for boys, but the mean has tended up while men are also committing violent crimes at later ages at relatively higher levels than they were in the past.
No longer does violent criminality sharply decline past a man’s eighteenth birthday. Instead, aging out of irrational decision-making today fits a more graceful curve.
Where are the hardened young criminals?
A number of explanations for the reduced link spring to mind.
Perhaps the generalized decline in violence over the past few decades — which only recently reversed — occurred through incapacitation or incarceration of younger male adults. But women’s offending seems to have shifted faster, and in a way that’s consistent across years. Moreover, we can see this isn’t the case, since the apparent cause is older young males becoming relatively more violent.
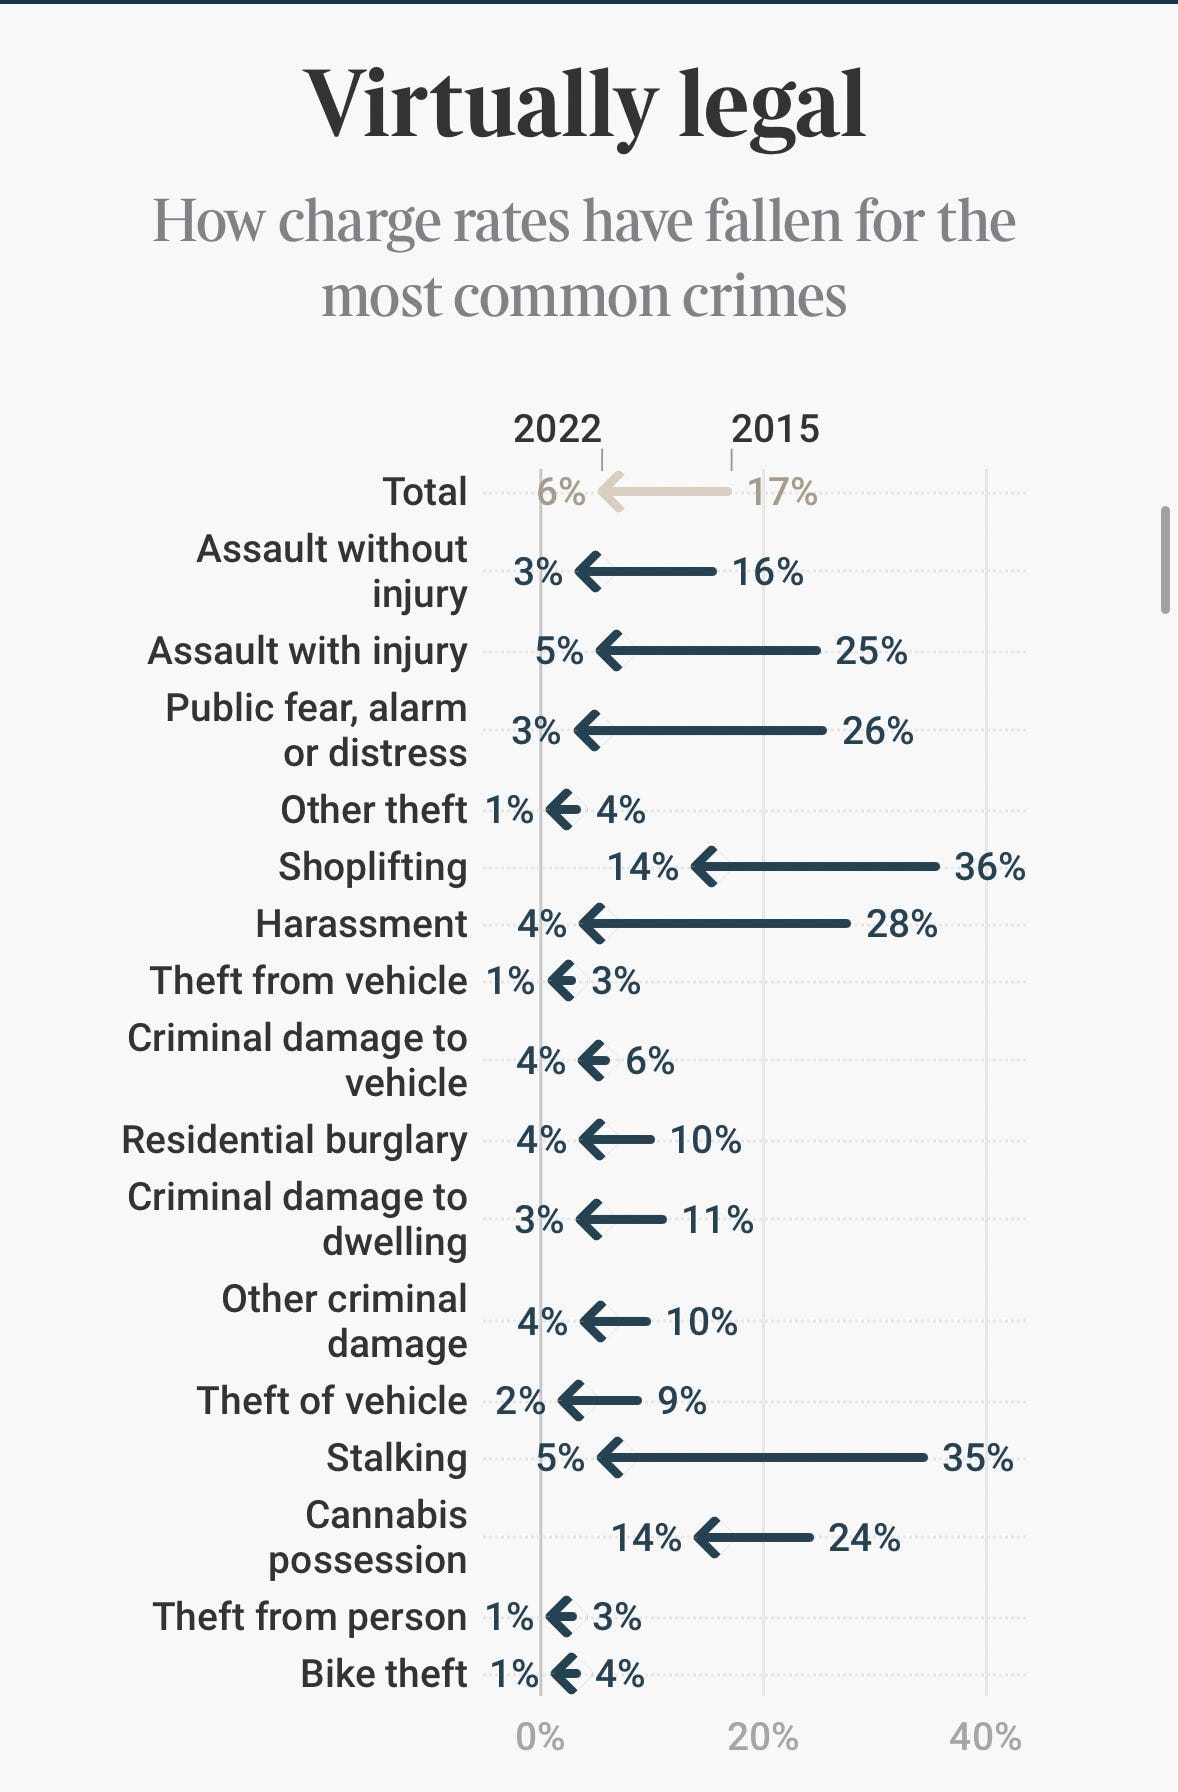
Another option is reduced charge rates at younger ages. In the U.K., there has been a recent, drastic reduction in charge rates for a variety of crimes. In total, between 2015 and 2022, there was a 65% reduction in charge rates. Take a look:
If this is a common trend for both Britain and America and the police are charging people less at younger ages in particular, that might yield the results we see. This could happen because in earlier years with higher charge rates, people would be arrested and incapacitated by virtue of being located in a jail cell rather than on the street, where they’re free to commit crimes. People would tend to be arrested at a sharp peak level of criminality, but, if that’s no longer the case, they might be arrested at later ages because they’re still out there committing crimes, the system just eventually gets fed up and charges them. This story might be true, but the data required to make it more than speculative isn’t available yet, and it doesn’t seem to comport with a generalized reduction in violence: if people are able to spread the violence out over more years due to a justice system failure, why is the level still falling?
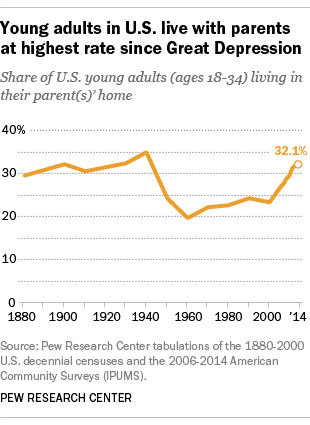
Maybe people are leaving the house less routinely at 18, and instead, at later ages. That might even help to explain reduced violence in general, and like a charge rate reduction it could help to explain the results for girls, too. There’s certainly something to this in the timeframe the UCR covered. Take Pew’s word for it:
Wait, this looks a lot like another graph:
These aren’t the closest graphs I’ve ever seen, and they even notably deviate despite a dip in the middle. Perhaps the dip for homicides is explained by Baby Boomer plenty, although intergenerational wealth comparisons don’t bear that out.8 The crack epidemic explains the peaking from the 1970s through 1990s much better. Maybe the similar, popularly-known U shape in the curve for inequality could explain things if it weren’t so overblown. Regardless, it certainly couldn’t explain the reduction in violent crime in the most recent years on that chart unless people simply got used to inequality or the beneficiaries of rising inequality acted in some way to fix things. It’s doubtful.
Whatever led to an age 18 peak for males is probably something that’s still there, but something else has grown in prominence and made 18 a much less pronounced time for violence. Instead, men now express that solitary year of violence across multiple years and women may have been a leading indicator of that change.
The real reason for this pattern, I suspect, lies in the reduced pace at which people enter adulthood.
iGen: the Loser Generation
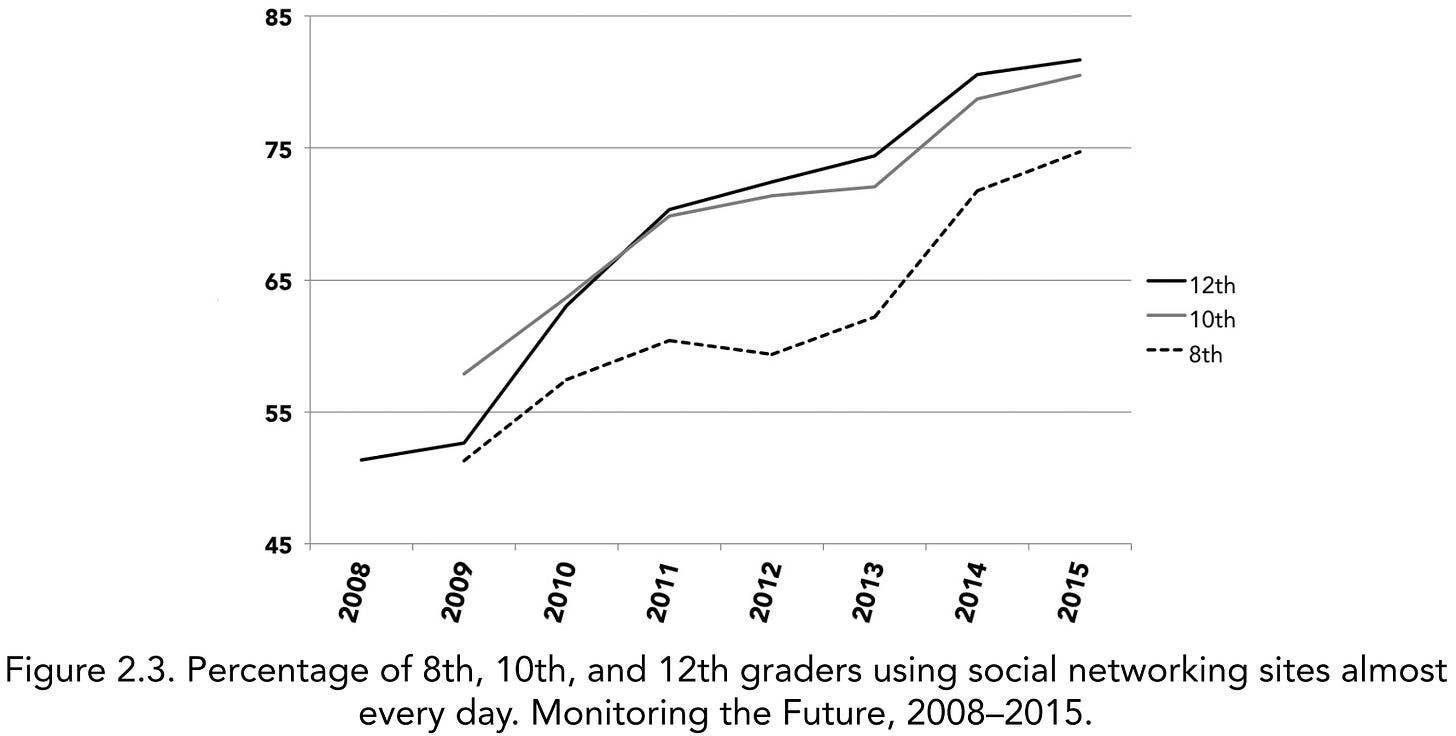
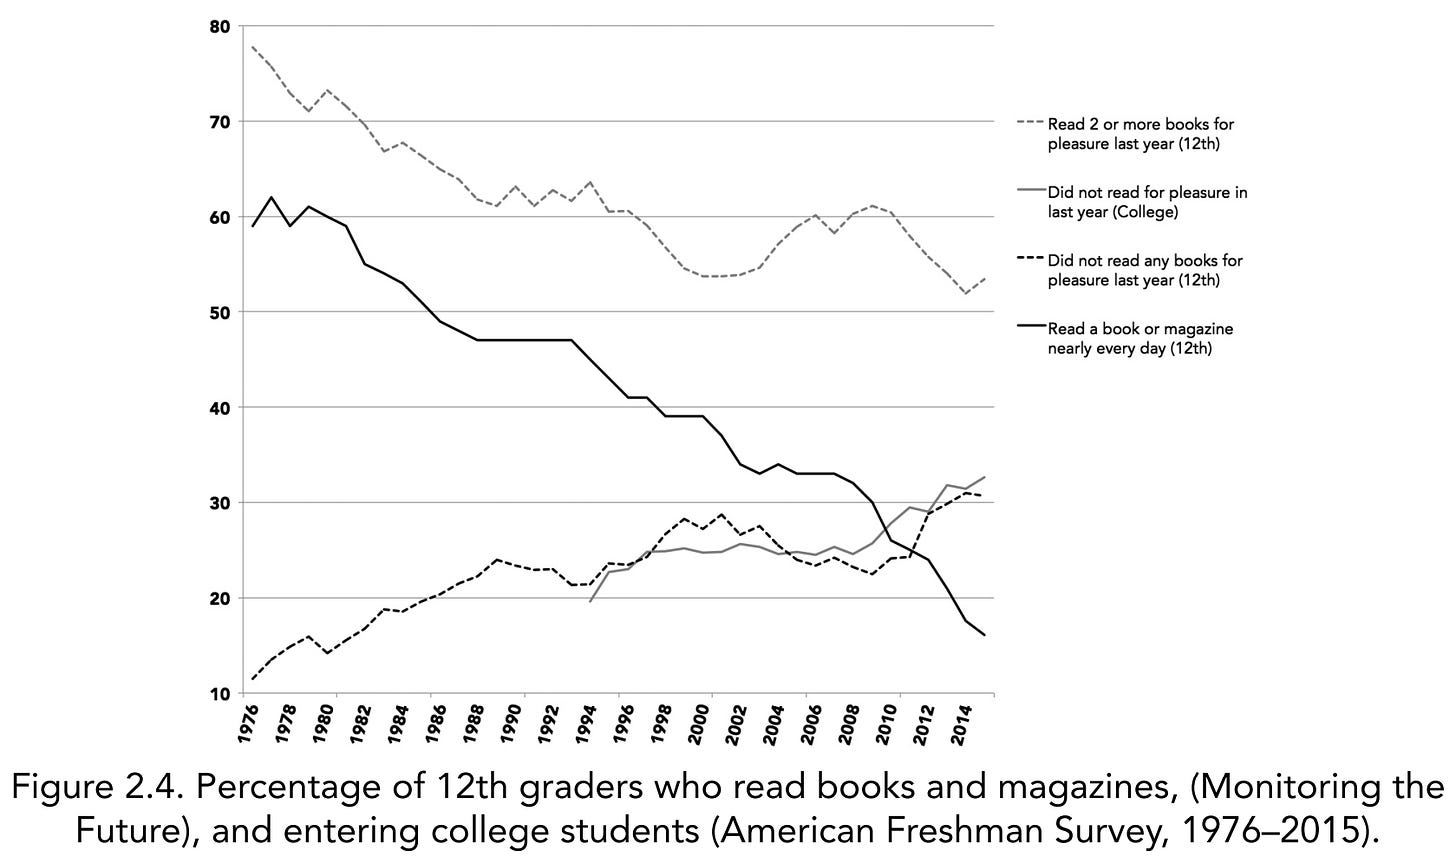
Jean Twenge’s book iGen: Why Today’s Super-Connected Kids Are Growing Up Less Rebellious, More Tolerant, Less Happy — and Completely Unprepared for Adulthood and What That Means for the Rest of Us has an incredibly long title. It also has a very interesting first chapter, entitled In No Hurry: Growing Up Slowly, in which the reduced life history speed of today’s kids is well-documented.9 Let’s look through the charts:
That’s a lot of charts, but they all show basically the same thing: the kids today are losers. They aren’t dating, driving, or holding jobs, and their parents know where they are all the time. They’re delaying entering adulthood, and many of these trends start too early to be explained by videogames, smartphones, and the internet except as trend maintaining factors. Maybe rising obesity and its concomitants like depression hold a lot of sway across these domains. But look at this chart:
The kids are still binge drinking pretty much the same amount today as they did in the 1970s when you look just a few years later. In this sense, the results might show something desirable: kids are staying away from things like drugs and sex, but adults are making the choice to engage with them.
What if kids are holding off on being violent as part of the generalized change in the age at which people reach true adulthood? What if even something so simple as a reduction in the binge drinking rate around age 18 coupled with relative rate constancy for later ages explains the violent crime observations via relatively reduced rates of drunken violent behavior?10
I think this may be on the money. By delaying adulthood in every way including in terms of becoming violent, the age-crime curve has flattened, and America may be the world’s bellwether.11
Or, as some criminologists put it, “Self-reported offending followed the well-established age-crime curve (ie, the mean [SD] variety of self-reported offending increased from 1.99 [2.82] at age 15 years to its peak of 4.24 [3.15] at age 18 years and 4.22 [3.02] at age 21 years and declined thereafter to 1.10 [1.59] at age 38 years).”
The conflation of violent crime and crime throughout this piece is is not without substance: most prisoners are there for violent crime perpetration. But to be sure, all of the results presented here substantially replicate using crime in general, if only because violent crime is so overrepresented. Without counting violent crime, the results still mostly replicate.
Girls begin puberty earlier than boys.
The same authors also provided another chart worth a look, although it isn’t directly relevant here. Note the scales in different areas.
I will be using the midpoints 5, 11, 13.5, 27, 32, 37, 42, 47, 52, 57, 62, and 80 years.
An additional limitation is that UNdata was incomplete for some years. For example, the years 2001 through 2004 binned ages rather than disambiguating all of them, so I imputed ages through the data from 2000 and 2005, staking each year further from the last and closer to the next to get their population numbers. For 2011 and 2013, data was missing, so 2011 was the average of 2010 and 2012, while 2013 didn’t come with 2014 either, so both 2013 and 2014 were based on interpolation from 2012 and 2015. One year also binned all ages beyond 85, but since I did the same due to the FBI’s binning, this didn’t matter. Finally, 2019 was missing data, and so was 2020, so data from 2018 and 2021 had to be used for interpolation.
This raises the possibility that the total mean change, which has been more dramatic for males, may simply induce a distribution more like the female one always has been. That is, flatter with respect to age, and less extreme in general. But the changes in peak ages make this more contestable.
Although Panel B in this paper may bring something to bear on the subject.
It is worth noting that the trend towards extended behavioral adolescence has occurred despite puberty occurring earlier and earlier.
Inquisitive Bird has supplied me with the Danish data for the years 2000 through 2021 and several aggregates therein to increase reliability. They do not replicate the American pattern in terms of peak age shifts by sex, but they do support a flattening age-crime curve, at least for males. They can be viewed here.








The lockdown generation