
An Autism Challenge
0% of the rise in autism diagnoses is due to autism becoming more common

Here’s my challenge to anyone who thinks the explanation for the so-called “autism epidemic” is anything but diagnostic drift: prove me wrong.
To do this, you’ll need to show that in a proper decomposition of the rise, the liability for autism in the general population has gone up, that there’s more autism than there used to be. This means going beyond mere diagnosis numbers. Do something like this:
Background
There are two reasons why the diagnosed rate of autism can increase:
Liability Shift: More kids are born autistic or more people become autistic.
Diagnostic Drift: The criteria used to diagnose become broader and/or more broadly applied.
There’s a lot that can go into these categories. You could see liability increasing due to things like increased assortative mating and advancing parental age, or, in theory, due to heretofore unprecedented things like environmental exposures. You could see diagnostic drift due to changes in incentives to diagnose, awareness of conditions, diagnostic substitution, and so on. But ultimately, these are the two categories.
With the right data in hand, we can assess how much of the rise in autism diagnoses can be attributed to either of these broad categories. We can do this if we know about symptom scores and the proportions getting diagnosed in the population. Diagnosis is a threshold on latent liability for autism:
An individual is diagnosed if:
Putting diagnosis on the probit scale gives a simple identity, where pₜ is the diagnosed proportion:
This identity says observed diagnosis equals a threshold minus the liability mean. Conceptually, we recover a cohort-level liability index based on symptom scores, place diagnoses on the probit (tail) scale, and, because
changes in zₜ must come from either μ_{L,t} moving—a liability shift—or changes in τₜ—diagnostic drift. We then construct a liability-only counterfactual that holds the threshold for diagnosis fixed over time and ask the question: How much of the observed rise in pₜ would occur if only μ_{L,t} changed? The rest is diagnostic drift.
This brings us to the desired quantity:
Setup
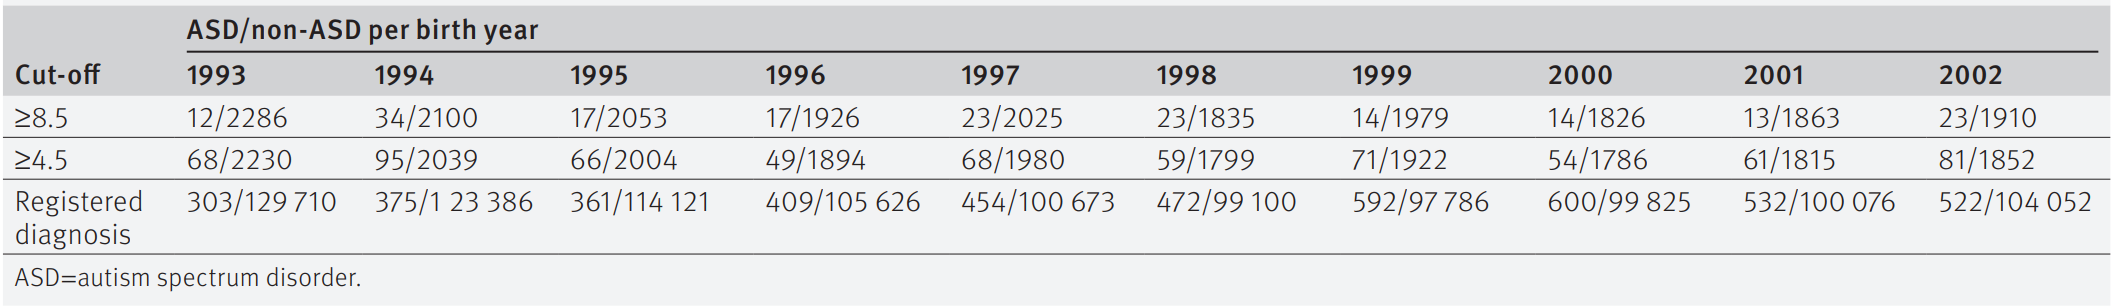
We have exactly the required data courtesy of Lundström et al.’s 2015 BMJ study of the prevalence of autism in Sweden between 1993 and 2002.
The first piece of data comes from Table 1. This table has the numbers of people in the population-representative Child and Adolescent Twin Study in Sweden (CATSS), alongside the numbers of them who have passed certain thresholds on the Autism-Tics, ADHD and other Comorbidities (A-TAC) inventory and numbers of people in the National Population Register (NPR) who had obtained an autism diagnosis.
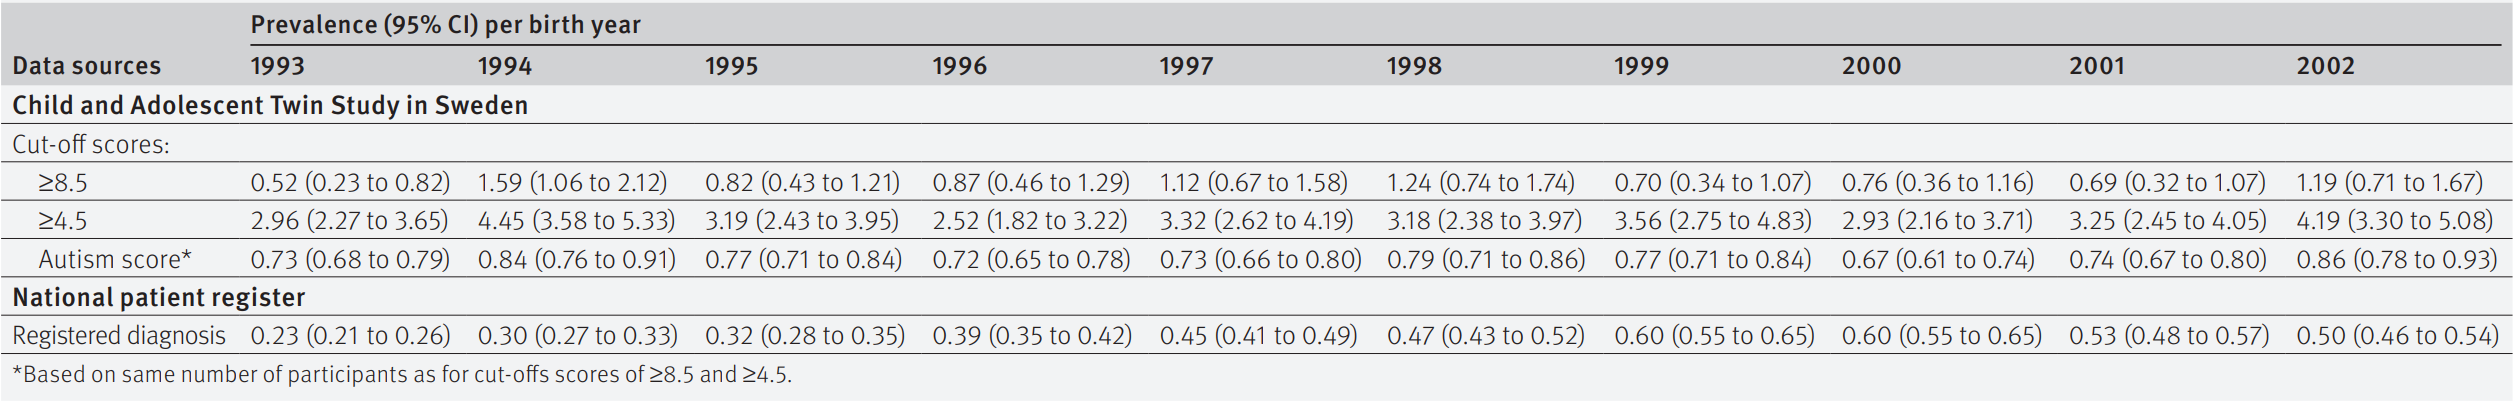
The second piece of data comes from Table 2. This table has the mean autism score and the prevalences for the cutoffs and registered diagnoses.
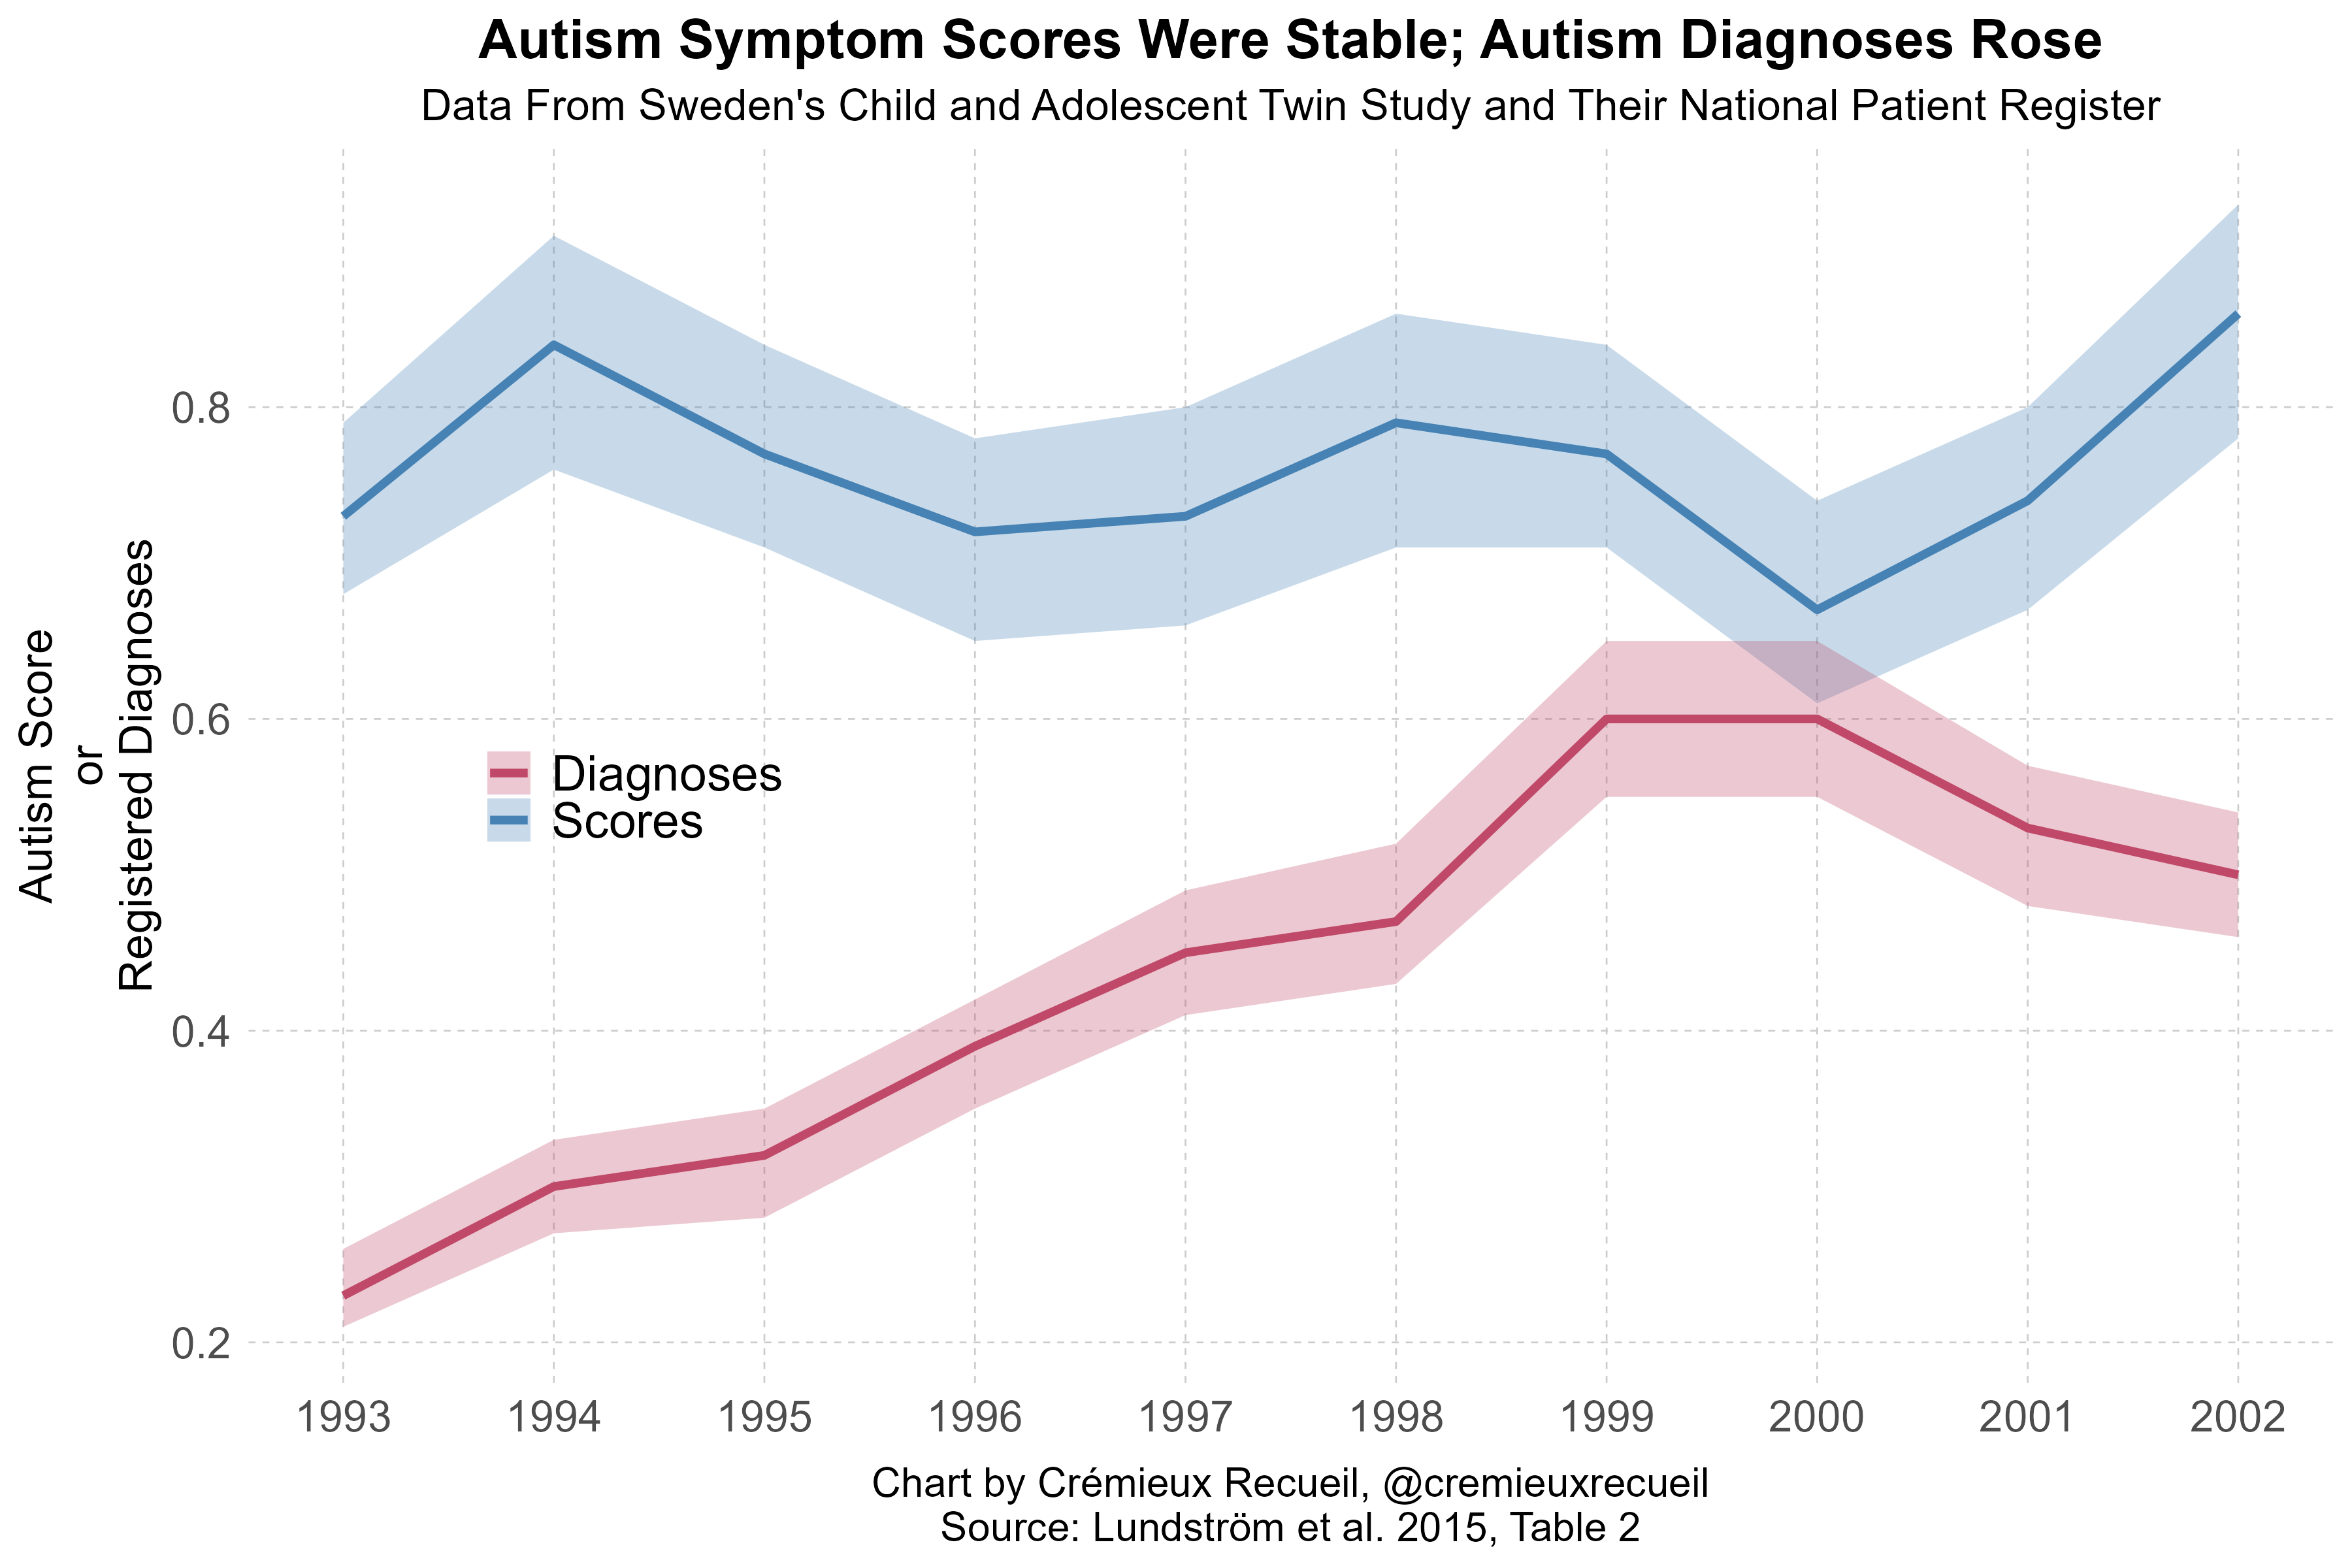
I’ve charted exactly this data elsewhere in an article where I explained the so-called “autism epidemic”, but in case you didn’t see that, here it is.
We have two tail counts from the CATSS dataset, the score mean and 95% CIs, and registered diagnostic prevalences from the NPR, we just need to handle the ascertainment issue where the sample’s last assessment year is 2009, so some of the kids included in it are too young to have been diagnosed at the same ages as those in earlier years. As the authors noted:
Parents of twins born during 1993-95 were interviewed when the twins were 12 years old, and those born during 2000-02 only had 7-9 years of follow-up in the national patient register. As a consequence there was a seeming decrease in the annual prevalence of autism spectrum disorder for those born in 2000-02. However, when only including those who had been registered with a diagnosis in the national patient register before the age of 7 years, and thus having had exactly the same length of follow-up, a monotonic increase from 0.07% (1993) to 0.43% (2002, P<0.001) was observed. [Emphasis mine.]
Several strategies all work fine enough in theory. We could leverage the age-7 diagnoses, scale diagnoses up linearly to age 12, cut off the analysis in 1997 for full age comparability or use 1999 for near-diagnostic comparability, or rescale based on autism data for the whole country, or we could compare across different cuts such as 1993-1996, 1996-1999, and 1999-2002. Each approach provides comparable results.
With our required data in hand, let the score take integer values
From Tables 1 and 2, compute proportions:
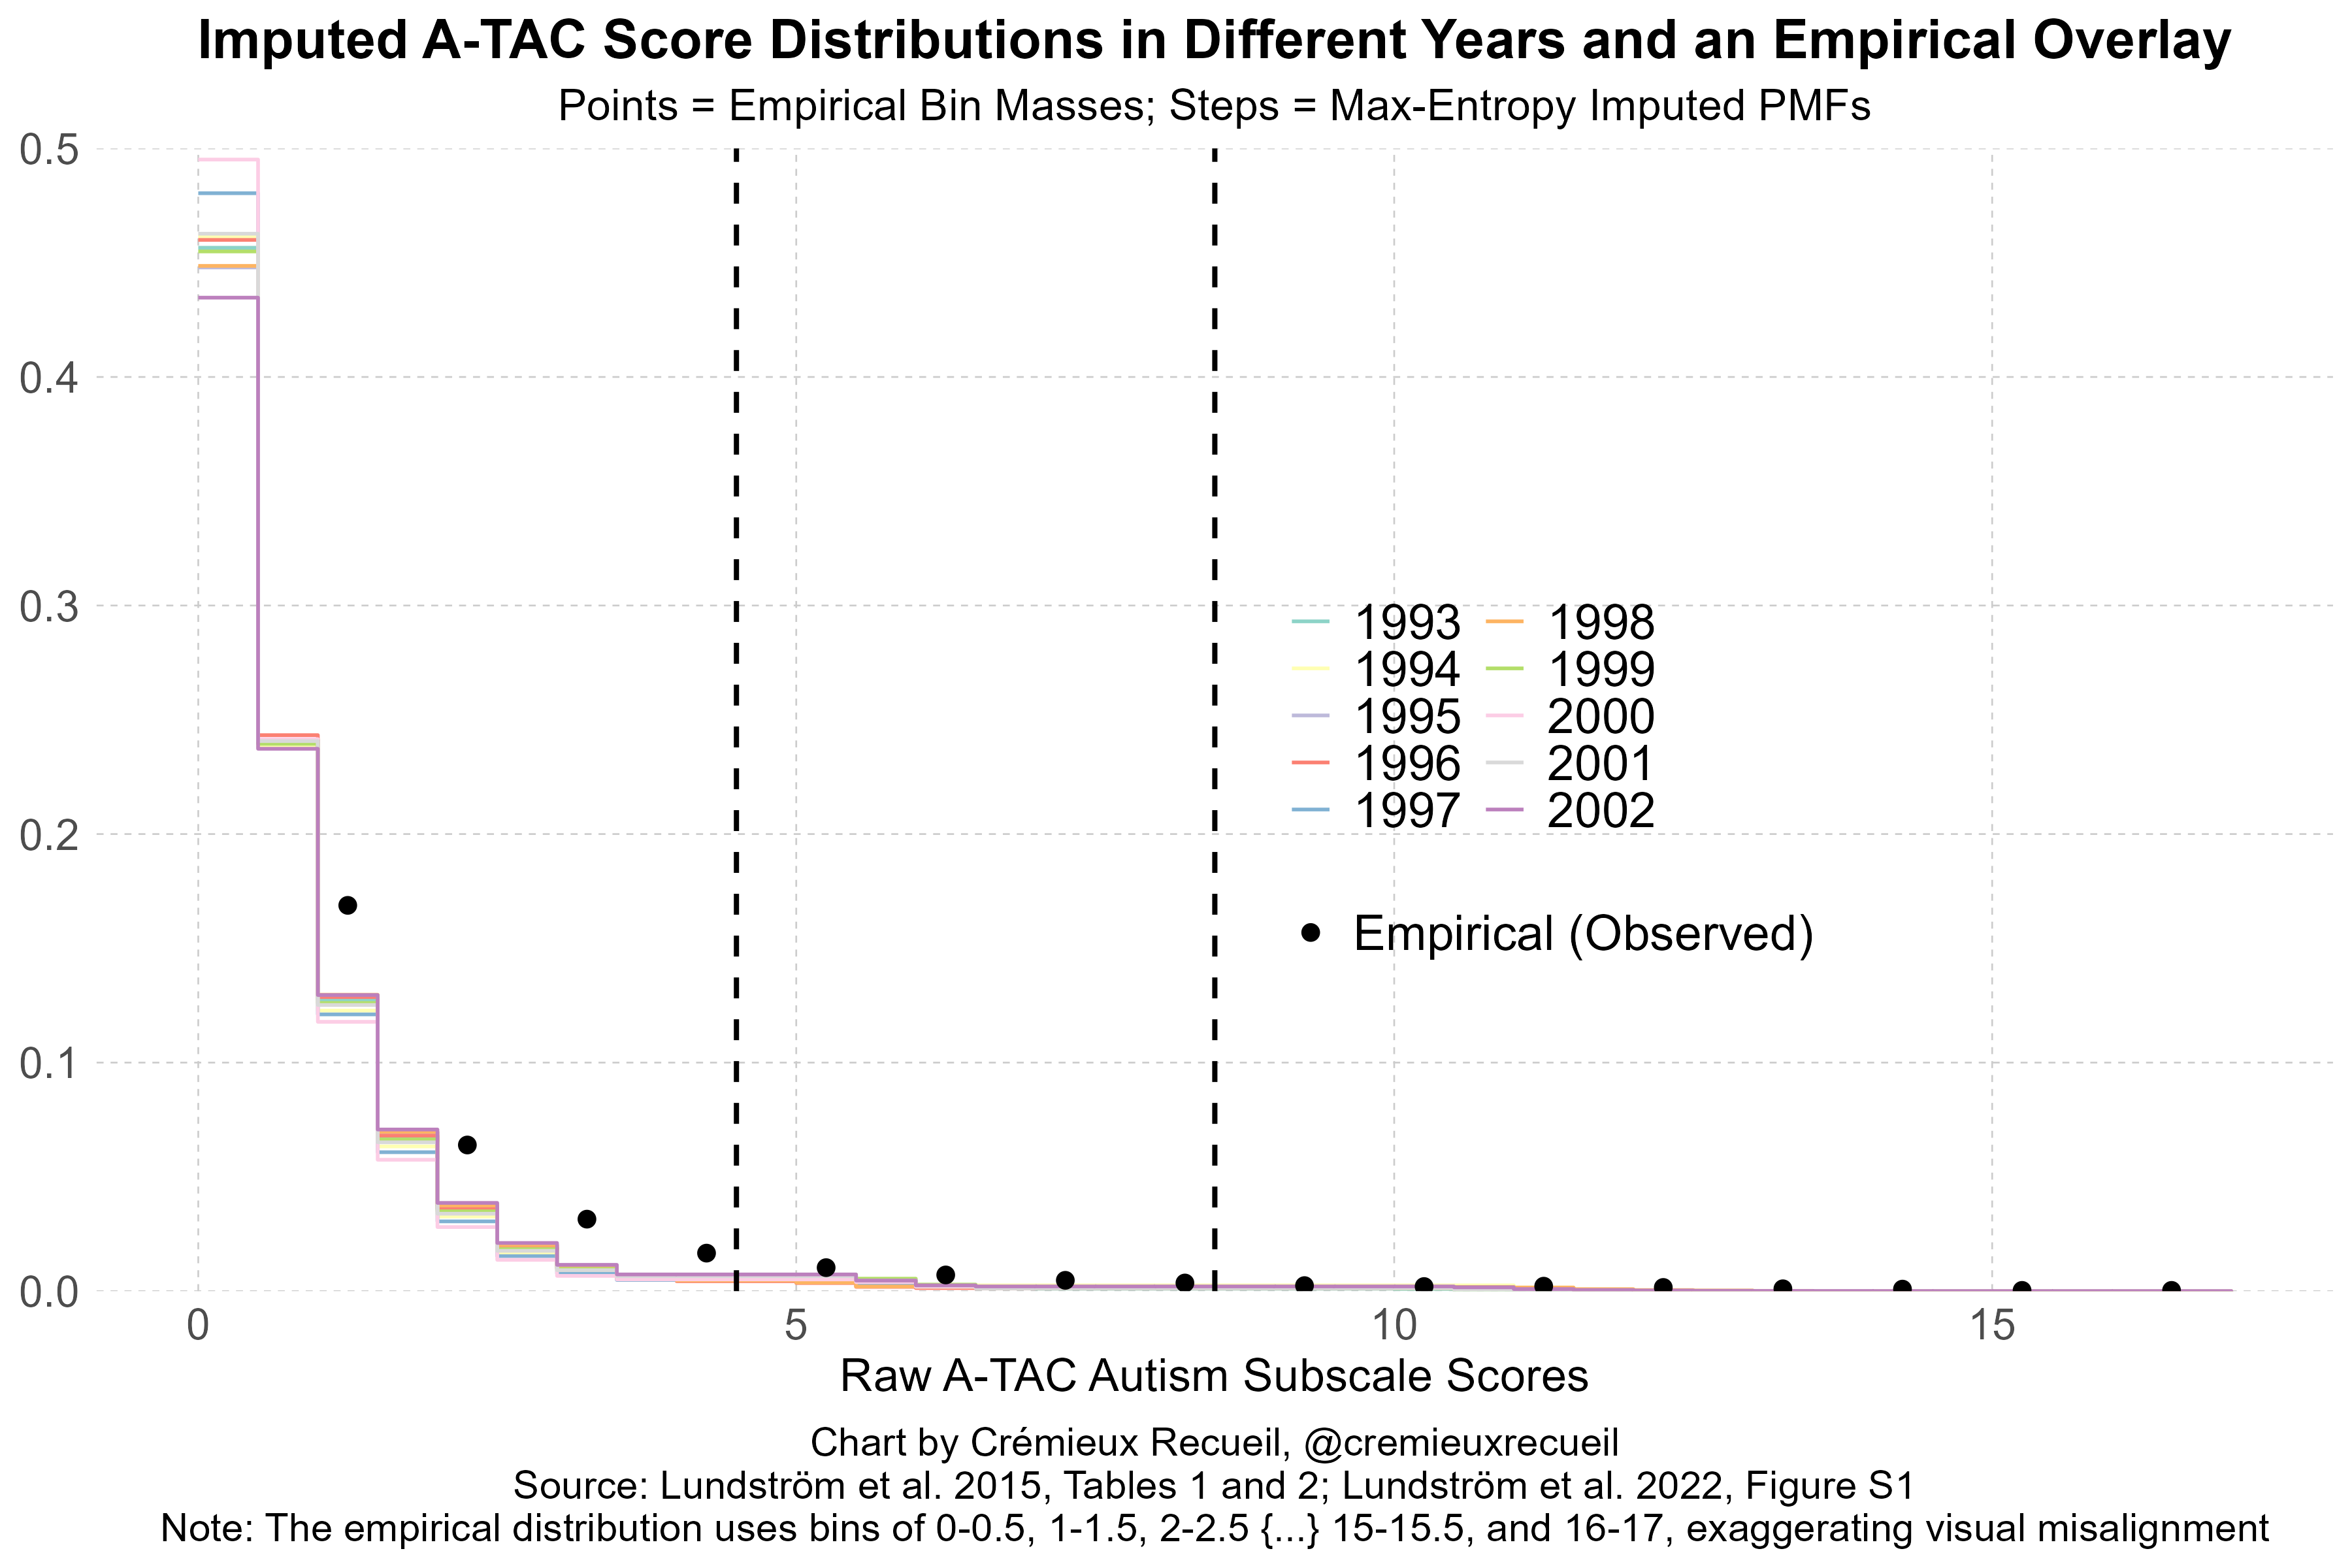
Perform max-entropy imputation. Among all PMFs on our data which match the three constraints
choose the one with maximum entropy:
You solve for θ by matching the three moments with a simple root find. The result is a monotone max-entropy shape honoring the means and both tail figures.
We can see that this strategy works by comparing it to empirical distributions that have been published in other papers, noting that those empirical distributions are binned differently and are missing some of the levels we used. Compared to these imputed distributions, they are nevertheless close, and if we cut the imputations like that paper did, they become indistinguishably close.
Follow this up by, first, pooling across years for stability:
Map scores to a latent z-score:
Then, compute a liability index for each year:
From Table 2, get the diagnosis proportion p_t = p_t^{text{NPR}} and convert:
Weight by the probit-scale variance via the delta method using the CATSS/NPR denominators n_t, which you can back out from confidence intervals:
Once here, we’re ready to compute the liability and drift shares as described above.
You have the data, you have the assumptions, you have the methods, the code is below so you can reproduce and replicate at your leisure, and now we’re onto the results.
Results
The various model permutations all agree with one another: practically none of the rise in autism diagnoses can be attributed to a rise in population liability to autism.
I’ve complimented the Swedish data with conservative modeling of CDC data on the prevalence of “profound” versus “non-profound” autism. [October 28, 2025 update: More data has become available. The bottom row, colored yellow, shows the results of a new liability decomposition using data on 18-year-olds in Sweden. Details below.] [December 31, 2025 update: More data from the CDC has become available, and now we know about shifts in recorded adaptive functioning levels. I have added reanalysis based on this as a new bottom row, colored purple, which shows that the rise in the CDC data is not even a little bit driven by an increase in liability. Details below.]
The Autism Default Hypothesis
The Default Hypothesis for the Autism Epidemic (DHAE) is simple:
There has been a significant rise in autism diagnoses due to diagnostic drift.
There is no reason to think there has been a significant rise due to increasing liability.
There is no room for even a small amount of liability shift (say ~10% or more).
If the rise in diagnoses characterizing the “autism epidemic” is decomposed between these two sources, it becomes immediately obvious that the rise cannot be explained by people becoming more autistic. In fact, the mean level of autistic traits found in the population has not shifted in any dataset it’s recorded in, even though diagnoses have become much more prevalent. The “autism epidemic” is a case of overdiagnosis.
We have strong theoretical reasons to believe the DHAE. For one, it is impossible for diagnostic drift to not be involved in the rise in autism cases since virtually all of those diagnosed with autism today cannot qualify under Kanner’s original criteria; most of those eventually diagnosed under the DSM-IV and its iterations did not qualify under the original DSM-III, and; in dual-coding tests on the move from the DSM-IV to the DSM-5, many people ‘fell out’ of being autistic, as the criteria became more strict and thus fewer people were eligible.1
Secondly, we know for a fact that autism diagnoses have become less severe.
The CDC ADDM-based decomposition in the Results section table shows the result of an analysis based on changes in profound and non-profound autism diagnoses. (In my preferred model of that CDC data, the liability share is 7.06% and that estimate is not distinguishable from zero. This is covered in detail below. [December 31, 2025 update: New data covered below shows that my preferred model was actually based on exogenously fixed parameters that were too conservative, and the real liability share increase in the ADDM data was just 1.75%, not 7.06%.]) When I discussed this data previously, I noted that it also showed that 84.6% of the rise in autism between 2000 and 2016 is due to non-profound autism; that the rise in profound cases can be attributed to phenomena like diagnostic substitution, and; that among those diagnosed in Sweden, Australia, Denmark, the U.S. and anywhere else we have data, autism symptom severity has declined among those diagnosed.
Similarly, in data from California—where we have details on diagnostic substitution over the same period—5.38% of the rise between 1992 and 2002 can be attributed to “low-functioning” autism, 71.78% can be attributed to “mid-functioning” autism (20th-79th percentile symptom scores in the 1992 distribution), and the remaining 22.84% to “high-functioning” autism. The low-functioning share declined and the high-functioning share increased: in the epicenter of the “autism epidemic,” autism diagnoses became less severe over time, and accordingly, the overwhelming majority—91.1%—of California’s rise in this period can readily be attributed to diagnostic drift.
I’ve outlined many more details on this before. At the end of the day, all evidence points to diagnostic drift, and there is no reason to believe a sizable portion of the increase in autism diagnoses can be ascribed to a liability shift. My challenge to people who believe otherwise is to present their evidence. Show your decompositions.

Who’s This For?
The answer to the question ‘Why have autism rates risen?’ is clear to anyone who’s looked. The arguments for diagnostic drift are overwhelming and the arguments in favor of a liability shift are fallacious, confused, or arguments about influences that are limited to being very small. So, who needs to hear this?
The public, probably. The more people realize that diagnostic drift is ‘it’ when it comes to autism, the less confused the public conversation will be, and the more we can work towards understanding and managing the condition effectively and humanely. When we get the wrong answer, people end up hurt and both money and time end up being wasted.
I’m preregistering my prediction that the people on the other side of this argument will ignore this challenge and these facts. They have always ignored the facts about the rise in autism and at best proposed factors that cannot contribute. For example, vaccines and acetaminophen (Tylenol) are not valid explanatory factors. They have no causal influence on autism rates; if they had influence it would be inconsistent with our well-developed understanding of the heritability and de novo contributions to autism, and; they cannot mesh with the rise of autism over time: there’s no massive uptick in acetaminophen usage, nor are there year-of-introduction leaps in autism rates associated with any vaccine.

Liability shift proponents never grapple with relevant facts, they avoid them and keep talking and talking about things that are not in evidence or claims that are irrelevant, instead. They talk about cohort studies linking Tylenol and autism, for example, and then never talk about the usage trends required for them to be meaningful. I assume that’s all they’ll ever do. So, this challenge is for them, but really, it’s for the public.
Addressing Excuses
“Sweden is unique. Other countries are different.”
