Brief Data Post
Part IV: Mr. Beast, Toogits and Flurps, Speeding Fines, Between-Group Heritability Estimates, the Greatest Cuisine, and More.
A/B Test Interactions: Relax?
A lot of people recently learned about A/B testing through the ineffable philanthropist Mr. Beast. In his experiment, Mr. Beast tested whether how he held his mouth in his video thumbnails affected viewer retention and, as it turned out, the answer was that an open mouth is bad. This alone doesn’t tell us why this is. Perhaps an open mouth put people off; perhaps it attracted a different type of viewer. Regardless, Mr. Beast has transitioned away from the open mouth thumbnail.
If you’ve ever administered A/B tests, you might have been worried about interference, or interaction, where running multiple A/B tests simultaneously affects test outcomes because test groups overlap, there’s exposure cross-contamination, tests share resources, participants become aware that they’re taking part in an A/B test, or a number of other possibilities. According to researchers at Microsoft, interference might not be very concerning in general.
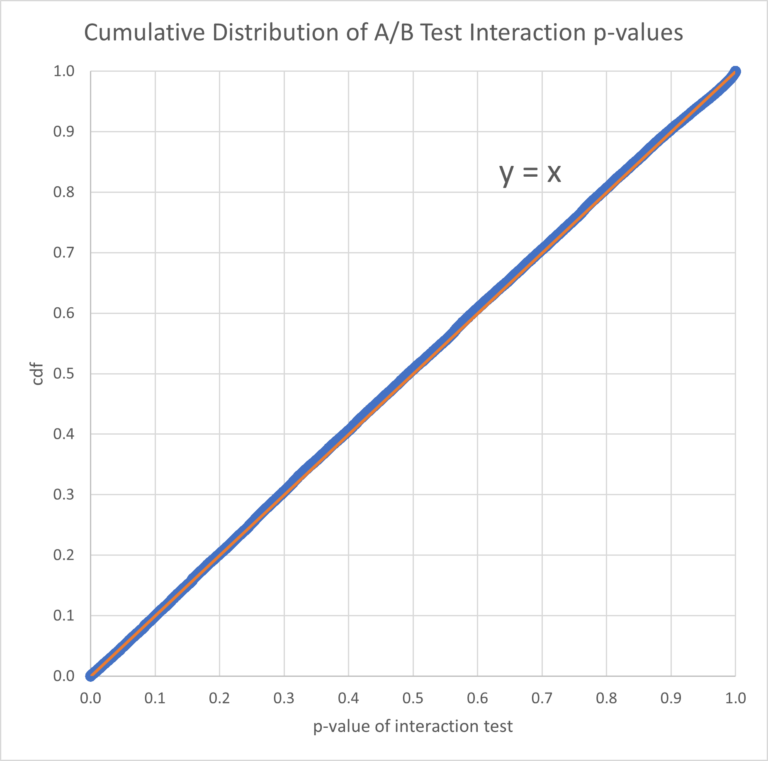
The basis for this claim is extremely large-scale data from A/B testing with Microsoft products. Per the post, four major products were examined, and each of them runs hundreds of A/B tests per day on millions of users, so they picked out a single day and calculated every product metric and randomized group assignment combination for pairs of tests, leaving us with this result:
There looks to be nothing! Microsoft seems to have genuinely shown that interaction p-values are distributed as they should be under the null.
So, relax?
While interesting (and replicable at other companies like Facebook and Google), I don’t think “relax” is a good perspective to take. After all, interactions are scale-dependent, so if two interventions have an effect, interaction effects cannot be zero in both additive and multiplicative terms. One possibility here is that typical treatments have no effect and when a treatment does have an effect, when matched with another experiment, their respectively nonzero effects are applied to disjoint groups.
An explanation posited in the post is simply that power was low and interactions that researchers ought to worry about get quashed by the sheer number of interaction effects being tested. I’ve worked with scenarios where there’s strong—and, unfortunately, replicable—interference, so this possibility speaks to me. This isn’t to say interference isn’t ignorable in a broad sense. For people who work with complementary experiments rather than ones involving substitutes, it’s probably fine to give short shrift to interference if measurement is good and attribution is sensible.1 I’ll stay wary.
Sex and Mathematics
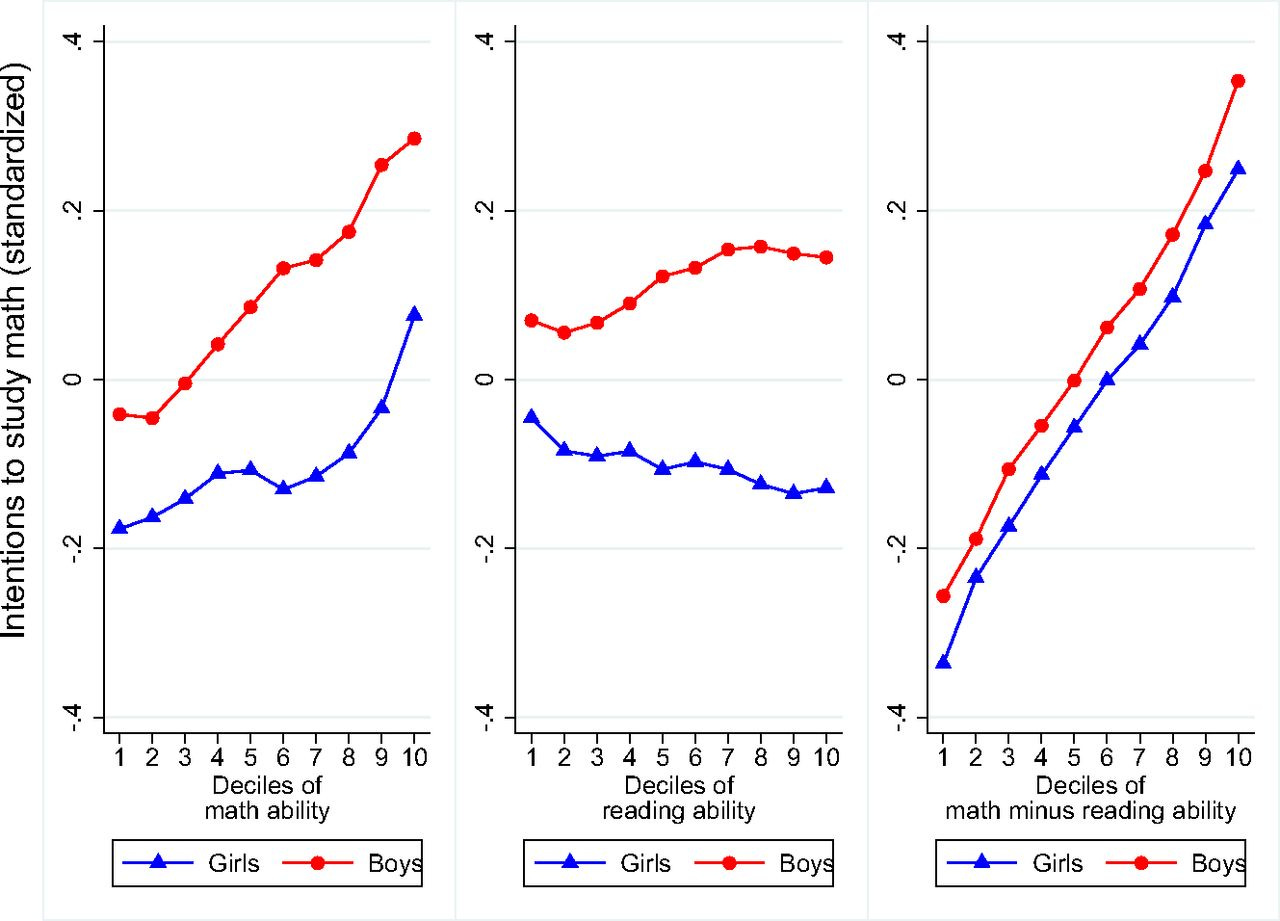
There are notable sex differences in intentions to pursue mathematics. One recent study analyzed these differences across 61 countries using data from the 2012 administration of the PISA. The authors split mathematical ability into twenty quantiles and showed that, in each quantile, the mean level of interest in pursuing mathematics was greater for males than for females.
These differences in interest are reflected in differences in what higher education programs people eventually select into. This analysis is noisier, but the pattern is consistent: boys are overrepresented in mathematics, physics, engineering, and computer science programs at each level of mathematical performance:
The paper goes on to show that this result holds for people’s eventual occupations, broadly STEM-classified occupations, occupations that use numeracy skills intensively, and occupations that use numeracy skills more often. Since those fields are typically more remunerative than occupations that don’t involve people’s quantitative skills, this has socially meaningful implications. That observation also supplies a possibility for determining why males have greater interest in mathematics. But before that, what are some other explanations? One is obvious: ability has a large general dimension (and PISA performance largely reflects general intelligence), but there are also generally male-female differences in mathematical and verbal performance net of measured general ability. Among high performers, this appears in a clear way as tilt; at the level of the mean, women generally do better in verbal and men in mathematical and spatial tests, with some exceptions. So, could this be explained by women’s comparative advantage in the PISA reading test? The authors investigated this first in another article that used the same data:
Indeed! The gap in intention to study mathematics substantially—but perhaps not wholly—dissipated when reading ability was accounted for. A similar pattern of results was observed for mathematical self-concept:
So, using the same data in this more recent paper, did that result replicate?
Seemingly not:
Girl students who are good at math are more likely than their boys counterparts to be even better in reading, and this comparative advantage in reading over boys among girls can account for a large part of the raw gender gap in the intention to pursue math. Similarly, student performance in reading and comparative advantages in reading over math are likely to vary with math ability and may vary differentially for girls and boys. As student intentions to pursue math are in part driven by a trade-off between their math performance and their performance in other subjects, our main results could potentially be explained by the joint distribution of performance in math, reading and science for girl and boy students. We show that this is not the case.
First, the gender gap (boys minus girls) in the comparative advantage in math (defined as math ability minus reading ability) decreases with math ability, implying that, if anything, this comparative advantage should lead to a lower gender gap in the intention to pursue math among high achievers in math than among low achievers.
Second, when we include a rich set of control variables that capture reading and science ability as well as their interaction with gender… the difference between girls and boys in the relationship linking math ability to math intentions is actually magnified.
Third, even when we allow the comparative advantage in math to interact with math intentions differentially by both gender and math ability (by including math ability, gender and comparative advantage as well as the 3 corresponding two-way interactions and the three-way interaction in a regression model), the coefficient of interest capturing how math ability interacts with math intentions differentially for girls is barely affected.
Fourth, this coefficient remains unaffected if we allow comparative advantages in math to influence math intentions nonlinearly. We do so by controlling either for a dummy variable indicating a positive comparative advantage or by including comparative advantage quintiles and their interactions with student gender.
This set of exercises in evaluating whether comparative advantage is explanatory seems to explain too much, through overcontrolling and potentially falling prey to the error of making inferences about results with low power. This could use some psychometrics, additional robustness tests, and less binning in general. But it’s not the most interesting part. This isn’t either: sex differences in mathematical self-concept didn’t account for the gap, nor did students’ declared interest in mathematics. In both cases, those variables evolved in the opposite of the direction intentions did. The really interesting part was this:
[The] gender gap in the intention to pursue math is actually larger among high socioeconomic status (SES) students. Controlling for SES differentially by gender… actually lowers the magnitude of [differences in the intention to pursue mathematics] by 45%. This shows that our main results partly capture the fact that high math performers tend to predominantly have a high SES.
Now this is interesting! Jobs that reward numeracy are more remunerative, so it makes sense that SES makes a difference if there’s persistence in SES attainment, or at least sex-biased persistence in some of the interest-related antecedents of SES attainment net of measured ability. If this is true, it could be controlling for interests in a roundabout way. If fathers contribute more to measured student SES, this would be reinforced, and if higher ability students had greater paternal SES contributions (as is likely in places where men are presumed to be providers and both SES and ability relate to marital stability), this could be doubly reinforced. As it stands, this is speculative, but the possibility is certainly there and it should be investigated.
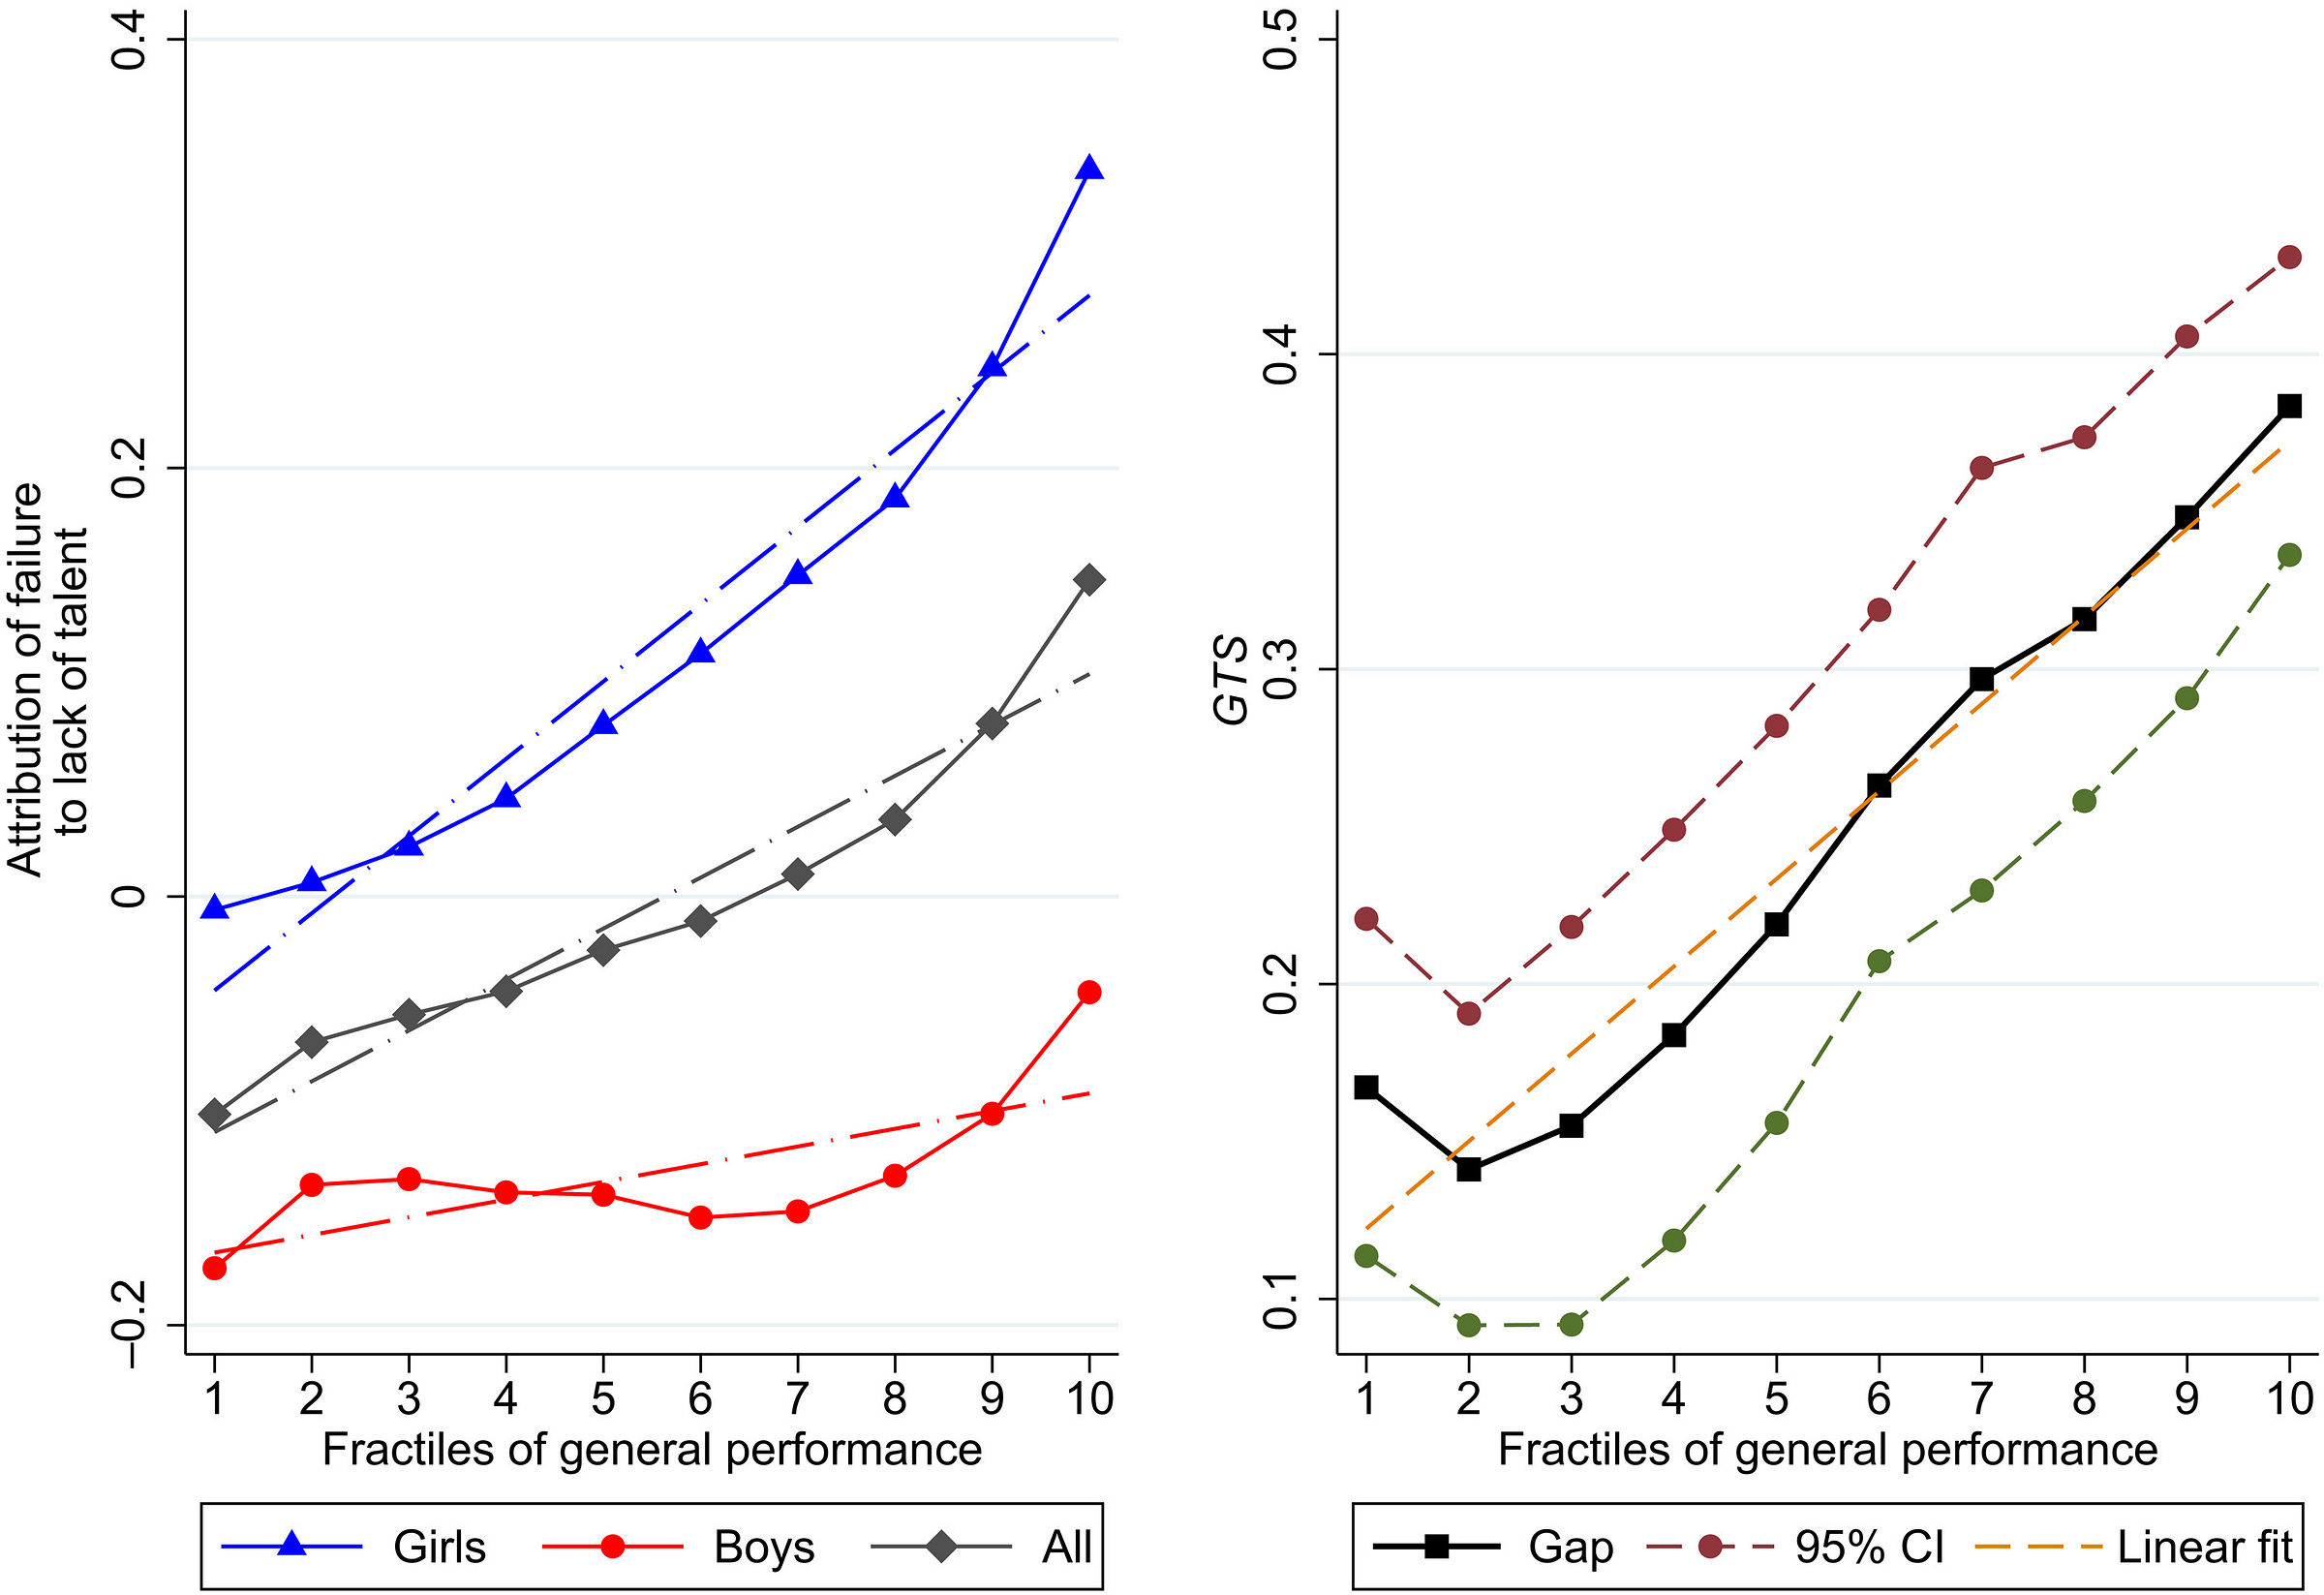
In another study, the authors observed something else worth mentioning: within each level of general performance in the 2018 PISA, girls are much more likely than boys to attribute their failures to a lack of talent:
I don’t know if this can explain anything, but it can statistically explain parts of other sex differences in some career-related outcomes, but so can everything else in this nomothetic web. One part of this study stood out:
Many of the gender gaps said to be related to the glass ceiling are larger in more developed or more gender-egalitarian countries, and they are also larger among high-performing students. The first pattern suggests that the glass ceiling is unlikely to disappear as countries develop or become more gender-egalitarian. The second is worrying as high-performing students are the most likely to be concerned with the glass ceiling.
Regarding the first part, this finding actually sounds like it puts the kibosh to a strong interpretation of the idea that gendered stereotyping or gender differences in beliefs about talents by sex play a formative role in male-female differences in labor market attainments. The reason is simple: the gender-equality paradox is only a paradox about gender equality if there actually is a paradoxical difference in beliefs we believe play a role in attainment at higher levels of observed gender equality. If these beliefs do matter as predicted, then they obviously play a smaller role at higher levels of gender equality. If they didn’t, there would be no paradox.
White American’s Views on Immigrant Assimilation
What do White Americans want out of immigrants? If we interpret every marginal mean from this new survey as if it reflects desires conditionally, then they want highly-educated, female, English-speaking, Christian or Jewish, and Indian or White immigrants:
Overall, it looks like White Americans want selective, familiar, female immigration, and somehow they don’t seem to care much about race except for when it comes to Middle Eastern immigrants, whom they don’t seem to want. The survey also asked which of these factors White Americans thought influenced immigrant assimilation:
Apparently White Americans’ opinions about what makes an immigrant desirable largely mirror the pattern of their beliefs about who assimilates best. Strangely, they didn’t seem to believe English fluency makes much of a difference. White Americans also downweighted race, but they still professed a belief that Muslims were worse at integrating.
The authors wanted to investigate the role of race in these preferences and perceptions, but the result of that analysis was uninspiring: splitting the results by race didn’t seem to lead to very many significant interactions!
When it came to immigrant desirability, South Asians were considered the same as Whites, and Blacks were considered somewhat worse, but only significantly when it came to the category of immigrants with advanced English. Middle Easterners had more consistently negative results, but in most cases, there still wasn’t a discernible preference for Whites over Middle Easterners most of the time. In most of these cases, significant effects were also marginal.
When it came to immigrant assimilation ability perceptions, there were two significant differences: Middle Easterners who were Muslim or male were perceived as less capable of assimilating. But otherwise, the results were nulls, although in most cases, differences in these nonsignificant perception differences were negative towards non-White immigrants.
Or in the lead authors’ words: “White Americans do not prefer Muslim immigrants regardless of their race. However, White Muslims [are] seen as having [an] easier time assimilating relative to [Middle Eastern and North African] Muslims.”
Ratings of Honesty by Occupation Don’t Depend on Politics
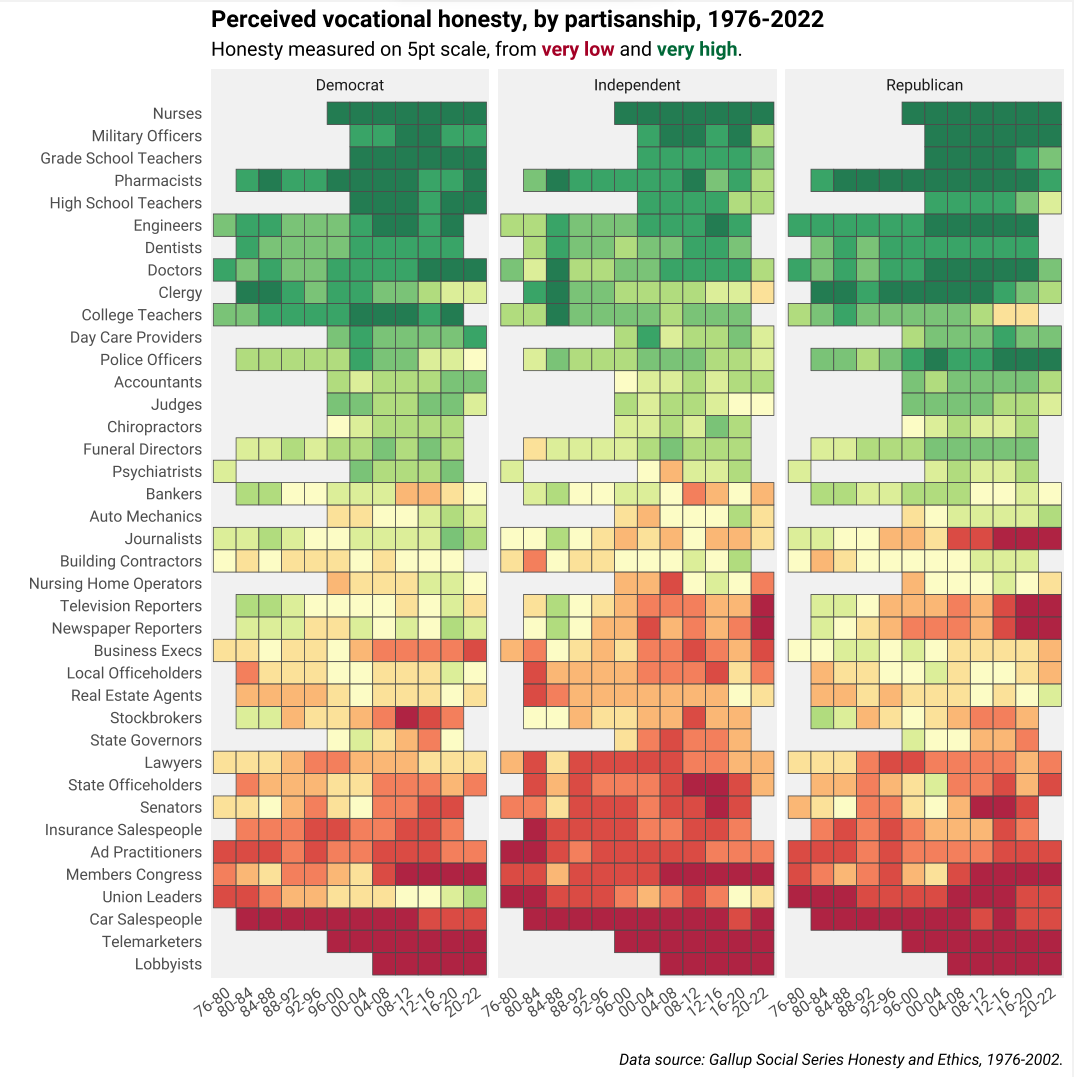
Which jobs are honest? Which jobs are full of liars? Twitter user @Thomasjwood has visualized people’s opinions on this question by their political affiliation using data from the Gallup Social Series:
Toogits, Flurps, and the Dangers of Getting Causes Wrong
Toogits and Flurps are, well, imaginary. They’re the names of two imaginary groups used to probe kids’ understanding and perceptions of inequality in a new study in the Proceedings of the National Academy of Sciences.
In this study, kids were exposed to different explanations for the material situations of the Toogits and the Flurps. After being provided these details, kids were asked to make predictions about things like where members of either group will end up when they're adults or how schools will treat them. They were also asked about their opinions on Toogits and Flurps, the fairness of their living situations, and their preferences for what to do with them. The experiment is explained in this picture:
So kids were told about how well Toogits and Flurps were doing and they were told an explanation. In one explanation, things simply were; in another, a third party created the conditions that led to each group’s current situations; in a final one, the Toogits created the conditions (or Flurps; the high-status group was randomly assigned, but for my purposes, I will simply refer to the high-status group as the Toogits and the low-status group as the Flurps). The results of the study were presented in a single diagram:
In panel B, we see that children affirmed that when a third-party set the rules that made things as they were for the Toogits and Flurps, things were a bit more unfair, but not significantly more unfair. However, when the Toogits set the rules that made them better off, that was deemed significantly less fair.
In panel C, we see that the kids were not significantly more likely to choose to allocate resources to the low- or high-status group in the third-party condition, but in the condition where the Toogits set the rules, kids were more likely to choose to allocate resources disproportionately to the low-status group.
In panel D, we see that kids presented their expectations about the mobility of Toogits and Flurps, and these expectations seemed to vary over children’s ages. In the control condition, age didn’t moderate expectations of mobility if the low-status group stayed where they were, but older kids did have a greater expectation that moving would generate higher mobility. In the third-party condition, it was moving that wasn’t moderated by age for some reason (probably noise), but older children strongly believed that failing to change out of the third party-imposed status regime would leave Flurps socially immobile. In the high-status condition, older kids believed that moving out of the Toogit-dominated regime would help Flurps to be mobile, and staying in it would leave them immobile.
In panel E, we see that kids expected society to treat Toogits better to similar degrees in both the third-party and high-status conditions, affirming that the origin of inequalities doesn’t seem to make a difference when it comes to predicting societal dispensations. This seems odd next to panel D, but it makes sense if kids believe social mobility is about more than what’s handed to people. This would be more strongly qualified if the authors also asked about the amounts they believe society would allocate to different groups in the different scenarios. Notably, in the control scenario, kids still expected unequal treatment in accordance with the degree of inequality that already existed.
Finally, in panel A, we’re treated to what is perhaps the study’s most interesting result: kids don’t favor high-status groups2, but when they’re told the high-status group created an inequality between it and a low-status group, they favor low-status groups.
Apparently kids can intuit the consequences of proposed systemic, “structural” mechanisms for inequality, and this affects their attitudes. This seems to suggest something dangerous for the simple reason that veracity needn’t matter, just belief: if people believe an inequality is due to one group acting in a way that generated a biased state of affairs, they may grow to dislike that group, even if the explanation is wrong or the inequality had nothing to do with current group members.
To bring this into the realm of current politics, this may be why belief change interventions are important: if people believe the wrong thing in the direction shown in this study, they are more likely to act on it because conservatives are biased against acting and liberals are biased in favor of acting. And what if people act on false knowledge about structural causes of inequality knowledge? Or what if they act negatively towards members of particular groups due to correct knowledge about those things? That could hardly be just.
On a more humorous note, another recent, fairly small, study on children’s perceptions extended the domain of the shape bias (the tendency to classify based on shape rather than color). This study showed that kids might consider a person’s weight much more important for classifying that person than that person’s race.
Effects That Occur/Effects That Can Be Made To Occur
The distinction between effects that do occur and those that can be made to occur is an important one for researchers. A paper in Frontiers in Social Psychology provided an excellent diagrammatic overview of this distinction:
The distinction can be thought of as the difference between effects that are contrived and those that are naturalistic. Contrived effects happen in controlled settings created by researchers and they are often highly unrealistic, having little bearing on or relationship to what happens in the real world. The relationship might actually be considerable, but that will tend to be unknown for highly-contrived experiments. Naturalistic research, on the other hand, is more likely to generalize outside to the real world, but they often leave the question of causality unanswered because exogenous variation to exploit is rare and exploitable exogenous variation that leaves behind a constrained set of alternative explanations for some finding is even rarer.
This distinction is important. Few reasonable people would explicitly state that “[because] X can predict Y [means] that it does so in the real world.”3 After a bout of careful thinking, few reasonable people would fail to admit that effects observed in the real world often depend on numerous unseen moderators and mediators, either.
The paper’s authors provided examples of the distinction, recommendations for researchers, and an interesting explanation of why it matters that involves a comparison of social psychology with pharmacology:
In many scientific fields, researchers start out by studying effects that can be made to occur and then examine whether these effects actually do occur. For example, in pharmacological research, a vast number of potentially interesting effects are initially identified but then only a tiny proportion of them turn out to be relevant for drug development. Every year, researchers create or screen thousands of new molecules with the goal of altering specific biochemical processes in living organisms. Once it has been shown that a molecule can produce a certain effect under highly specific circumstances, it undergoes a series of tests in increasingly complex environments, e.g., lead optimization testing to minimize non-specific interactions, toxicity testing to verify absorption, distribution, metabolism, and excretion, animal testing, low-dose testing on healthy humans, large-scale clinical trials with patients (Hughes et al., 2011). More than 99% of the molecules turn out to be useless: Once they are tested in complex environments, their effects don't hold up for many possible reasons. The effects turn out to be dependent on moderator variables being set at particular levels that do not exist in the real world in that combination, e.g., the effects are eliminated by other substances or the molecules have undesirable side effects (Sun et al., 2022). One way, then, to describe pharmacological research is as follows: Initially, researchers demonstrate a large number of effects that can be made to occur, but subsequent tests reveal that most of them actually do not occur in living organisms (or cannot be leveraged for the treatment of diseases).
Our proposition here is that psychological research frequently does not make it past the molecule stage: We study psychological effects that can be made to occur under specific circumstances, but we rarely examine if they do occur with reasonable frequency in everyday life or if they can be leveraged to address a societal problem.
Indeterminate Evidence on Bias in Academia
When microbiology and immunology principal investigators were emailed by prospective PhD students who were described as being highly-skilled, but whose career interests differed, their response rates didn’t seem to vary, regardless of whether the student described their goal “applied research in industry” (n = 1,000), “basic research in academia” (1,000), or nothing at all (442).
This wasn’t a huge study for the audit study literature by any means, so it’s a bit indeterminate what the result means. The authors interpret their findings as evidence that PIs don’t discriminate on applicants’ career interests, so if career interests decrease the quantity or quality of mentorship available to students, this occurs after the first impressions. But the observed odds ratios for the comparison of industry preferences and academia preferences were 1.091, or just shy of the OR of 1.122 that was considered powerful evidence for racial bias in an earlier audit study.
So is this study evidence for or against bias? Well the results are far from significant, so I’m of the opinion that it’s indeterminate, but a coefficient like this also probably doesn’t matter too much in the first place. However, it probably matters more than it would at the same scale in the job market in general, because there are fewer recruiting options in academia than in the wider labor market.4
The South Will Rise Again? Or, Where Are Americans From?
The American South stands out among regions of the U.S., as it has never experienced a period of foreign influx, whereas for every other region, it is a foundational component of their histories. Apparently this remains true today.
In 2020, the U.S. Census Bureau recorded that the total U.S. population was 329.5 million, of which the Southern U.S. region constituted 38% (126 million) in the same year. Something else that’s notable about the South is that it’s a major source of the population of the rest of the country because it has a higher birth rate than most of the rest of it. This isn’t just because of its Black population either: Southern Whites have more kids than Northern Whites!
Since Southerners have a lot of kids and spread out to other regions in the U.S., the South is going to play a major role in America’s future, culturally and demographically. The movement of Southerners to other parts of the U.S. has been documented recently:
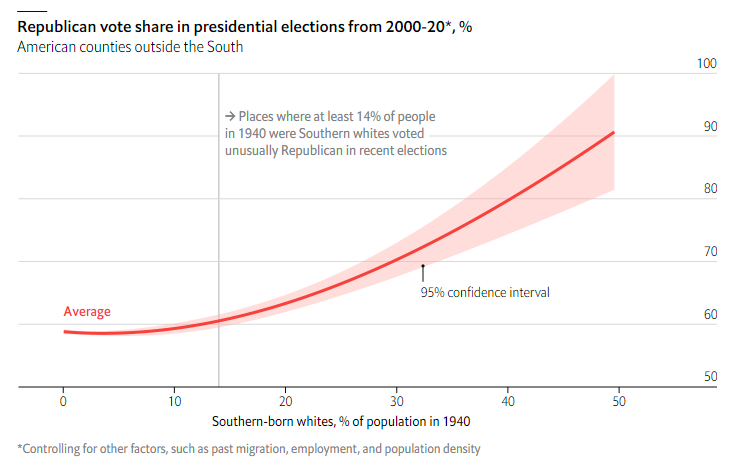
The places that welcomed these immigrants have seen their cultures change accordingly. For example, the higher the share of Southern-born Whites in a non-Southern county, the greater the Republican vote share:
In fact, each percentage point increase in Southern Whites was associated with more voting against the Civil Rights Act, more votes for Reagan’s tax cuts, and more votes against certifying the 2020 election:
The Best Cuisine? Italian
The most popular cuisines in the world are
Italian (84% of the people in each country who had tried it liked it)
Chinese (78%)
Japanese (71%)
Thai (70%)
French (70%)
The five least popular cuisines probably had a smaller sample size and were presumably less precisely estimated, but nevertheless, they were:
Peruvian (32%)
Finnish (32%)
Saudi Arabian (36%)
Filipino (36%)
Norwegian (37%)
How Does Alcohol Use Affect the Brain?
A new review article has an informative overview of causal research on the effects of alcohol on the brain. This diagram suggests that the causal evidence for alcohol effects on most areas that have been investigated is less consistent with alcohol impacts and more consistent with people who are predisposed to alcohol use differing in those brain areas:
The article also discusses designs for disentangling causality and integrative modeling prospects. It’s worth a read if this topic interests you.
Rapid Behavior Adjustment
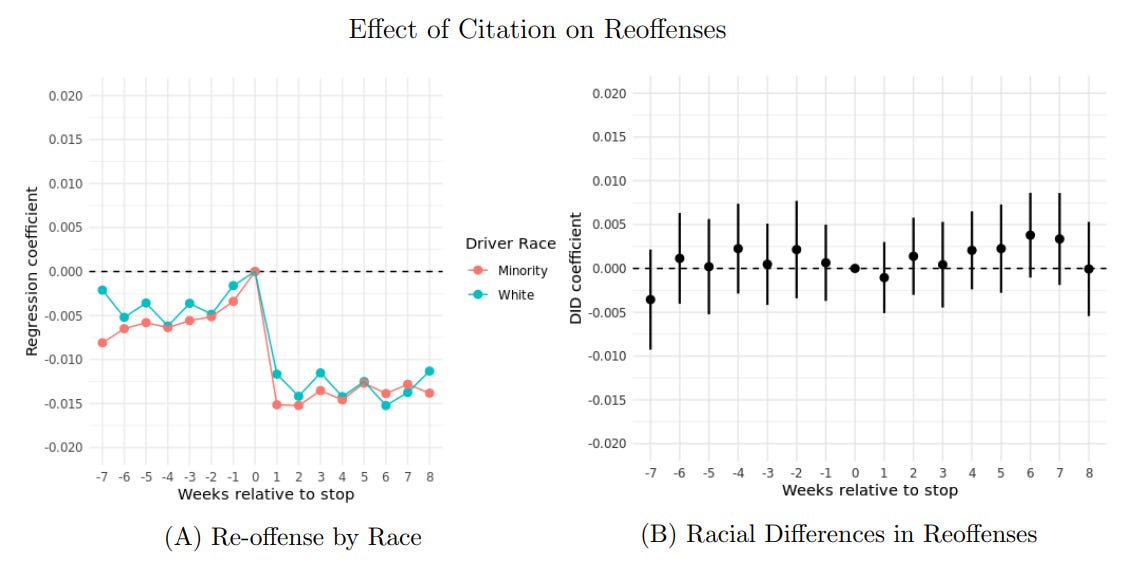
Two recent papers have found that giving people tickets for speeding results in reduced speeding. The first paper was about how race affects the likelihood of being pulled over and fined for speeding. The relevant chart is this one:
Up to eight weeks after being fined, people are still much less likely to reoffend (panel A), and there are no race differences in the extent of this effect (panel B). This is significant, and it seems that panel A replicated.
The point of the second paper was to estimate the impacts of fines by leveraging the discretionary powers officers and consistent differences in their fining behaviors, kind of like the Judge Instrumental-Variables design that’s used to assess the impacts of incarceration on behavior.
The study’s first major finding was that there was an effect on the probability of committing a movement violation (speeding) after fines were laid out, and the effect was like the first study. But an important qualifier is that the effect is not due to accidents, and it might be due to a general effect of being fined rather than the specific effect of being fined for speeding. But after about a year, people were back to behaving normally.
The authors of this research also observed that individuals with prior offenses were less affected by harsh fines than were people who hadn’t previously offended. At the same time, people with prior offenses were more likely to offend initially and after being fined. Overall, the study’s estimates implied that if fine amounts were doubled, speeding recidivism would be reduced by 13%.
Work Hours, Work Priorities
Many studies have compared male and female working hours the world over. For example, here are male and female hours worked in Taiwan in four different years:
Here’s the distribution of male and female hours worked in Germany in 1991-92:
And here are the work hours for Egyptian child laborers:
And here’s a replication with adults in the National Longitudinal Survey of Youth 1979:
With a complimentary split that shows how sex differences change with age:
One of the reasons this has been examined so many times is that the difference in hours worked is an important determinant of male-female differences in labor market attainment because hours worked affect total income, on-the-job skill acquisition, and occupational advancement. But in some occupations, women might work more and still be awarded less. An example of this could be doctor visits. Consider this chart:
Female PCPs generate considerably lower revenue per minute spent in visits with patients. At the same time, they spend 2.6% more time in visits in a given year than their male peers despite working 5.3 fewer days. So what’s going on?
The reason for this pattern seems to be that female PCPs perform 10.8% fewer total visits, but they spend 15.7% more time with each visit. Because visits have a relatively fixed price for patients regardless of the time the doctor spends with them, the choice to spend more time with patients costs female PCPs, even when they’re compared to men in the same practice, with controls for PCP, patient, and visit characteristics.
As in studies of MTurk and Uber workers, this result reflects labor supply choices within an occupation. Of the two, this scenario is more like the former, in that it reflects less the choice to work fewer hours, and more the choice to do particular kinds of work. Namely, more involved work, at least in terms of time spent with individual patients. Could this be compassion? Perhaps female doctors just want to go slower? Is this due to attempts to be easier with patients? In all likelihood, a multitude of different choices explain this observed difference in on-the-job time use.
What Part of the Black-White Homicide Rate Gap Decline was Due to Classification Problems?
Each new NIBRS data release confirms that Hispanics are disproportionately involved in violent crime perpetration. Due to bureaucratic choices long ago, “Hispanic” is given as an ethnicity and not a race; for that and cultural reasons, many Hispanics simply identify as White or Black, and sometimes they’re classified with one of those categories alone. As such, numerous “White Hispanics” contribute towards increasing White crime totals and, at the same time, a comparatively smaller number of “Black Hispanics” contribute to Black crime totals, in the opposite direction. Because Hispanics have increased as a percentage of the population, they’ve contributed to the narrowing of the Black-White violent crime rate gap.5
But how much does that matter?
Steffensmeier et al. attempted to quantify that by leveraging California and New York’s more refined categorizations in data gathered between 1980 and 2008. The more refined categorization in question is simply doing away with Hispanic as an ethnicity and, instead, making it its own racial category that’s mutually exclusive from White and Black. With this, they calculated correction factors for the FBI’s Uniform Crime Reports defined by the ratio of “clean” arrest counts from California and New York over “confounded” arrest counts from the same states.
The application of these correction factors to the UCR makes for quite a difference when it comes to calculating the Black percentage of arrests between 1980 and 2008:
Correcting the National Crime Victimization Survey lead to a similar result:
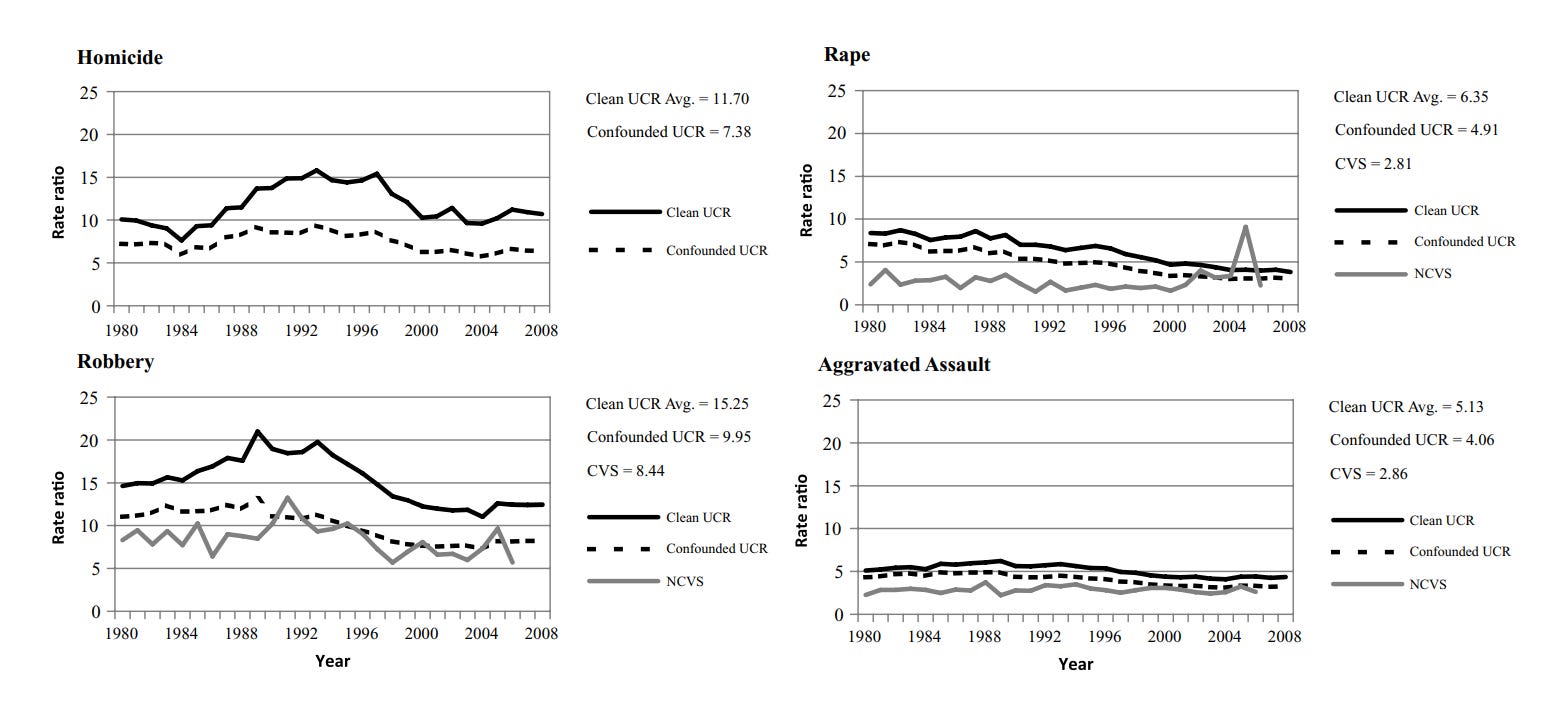
But what about the Black-White rate ratios? The effect is obviously similar, and when it’s really plotted, it does seem quite dramatic:
The authors followed this up by showing that augmented Dickey-Fuller tests of trends with the corrected UCR and NCVS data largely didn’t support the trends observed in the confounded data. For the Black percentage of UCR arrests, the homicide, robbery, and aggravated assault weren’t converging, but rape was; for NCVS offenses, rape and robbery weren’t converging, but aggravated assault was; for Black-White UCR rate ratios, only rape was converging; for Black-White NCVS rate ratios, only robbery was converging.
This paper is quite remarkable in its breadth. It concluded with a response to the idea that “pronounced racial disparities have persisted despite the declining Black involvement in violent crime”, which was promulgated in a contemporary article that claimed “The simplest explanation for [imprisonment disparities] is that drug and sentencing policies that contribute to disparities have not been significantly changed in decades” because “the white majority does not empathize with poor black people” since “recent punishment policies have replaced the urban ghetto, Jim Crow laws, and slavery as a mechanism for maintaining white dominance over blacks in the United States.” Quite a claim!
With corrected arrest data in hand, Steffensmeier et al. checked whether Blacks were “overincarcerated” or “underincarcerated” by assessing whether Black incarceration rates exceeded or were below the Black risk of arrest. In the legend in the figure below, an asterisk denotes overincarceration and a checkmark denotes underincarceration:
This study is wide-ranging and it makes it abundantly clear that the “Hispanic Effect” in crime reports is tricky and it matters a lot.
Too Many Psychological Measures, For Too Few Constructs
Over the past thirty years, there has been an incredibly proliferation of psychological measures.
Unfortunately, these measures are often not unique: many measures are for the same things, even when they have different names. There are also many measures that have the same names as other measures but they measure different things. Many more measures suffer from the nominal fallacy, in that they’re named for something, but they don’t really measure it at all. One of the more alarming things about this proliferation of measures is that the majority of them have been used in two or fewer studies.
This is somewhat worrying for several reasons. For instance, inventing their own measures is a simple way for researchers to hack together significant effects. This practice seems to come with larger effect sizes in education research:
But more importantly, this means many psychological studies don’t involve exact replication or, perhaps, any replication at all. Moreover, the use of many different measures is a threat to generalization. So, the study suggests, we need to stop using psychological measures like toothbrushes.
Less Selective Education Indicates IQ More Poorly
As education has become less selective, the average IQs of college graduates have declined. Holding a professional degree is no longer even close to impressive when it comes to indicating ability. This relationship is possible because the direction of causality runs primarily from individual’s IQs to their educational attainment rather than vice-versa. To the more limited extent the arrow runs in reverse, it does so by enhancing individual manifest scores via specific skills, rather than intelligence itself. Some of the effect of education in typical batteries is due to education eliciting psychometric bias, which seems like about what you’d expect for a rubbish bin phenotype like educational attainment, that exists practically wholly due to socially facilitated vertical pleiotropy.
Norwegian register data was used to assess to what extent the correlation between individual’s IQs measured at conscription correlated with their educational attainment down the line at age 30 across 40 years of birth cohorts. The result looked like this: IQs are less related to educational attainment than they once were.
The reason is likely much the same as elsewhere: education is now more universal, so it’s less selective. As they showed in their supplement, education is on the up and up:
Deaths in deCODE
In 2021, the American College of Medical Genetics and Genomics published a recommendation to report actionable genotypes in 73 disease-related genes with available therapies. Using deCODE data from Iceland, Jensson et al. discovered that 4% of Icelanders carried one of these actionable genotypes and, unfortunately, carrying those genotypes was associated with an early death.
Carriers of these actionable genotypes died earlier in general, and this difference seemed largely attributable to cancer.
Indeed, the most impactful effects were due to TP53, a tumor suppressor gene, and MSH2, a DNA mismatch repair protein. The third-largest effect was due to APT7B, the Wilson disease protein. The likely biggest single killer was a more broadly familiar gene with a smaller effect and a greater number of affected people: BRCA2.
Christian-Muslim Income Differences in the West Bank
Despite being equally affected by Israel, there are notable differences in the incomes of Palestinian Christians and Muslims living in the West Bank.6 I posted about these differences recently over on Twitter:
The scale of these differences is pretty remarkable. Both groups share statelessness and the Muslims outnumber the Christians by more than an order of magnitude. And yet, the Christians have higher socioeconomic attainment in a way that mirrors the situation in Egypt with Copts, the situation in Turkey prior to the persecution of its minorities in the middle of the last century, the situation in India with the Parsis, or the situation of Jews across the Middle East between the time the Abbasids made urbanization state policy7 and the founding of Israel and the pogroms across the Middle East that followed.
It may be worthwhile to assess the robustness of this finding. The data runs from 2000 to 2016 and it can be acquired from here.
For the sake of comparison, I’ll replot the data from above, with 95% confidence intervals, and I’ll subset it to the portion of the data with a complete set of demographic and socioeconomic controls. That means going from a sample size of 44,367 to 40,343. All of the income units are New Israeli Shekels (₪). The first chart is the unadjusted differences in income:
At baseline, Palestinian Christians are considerably richer than their Muslim peers.
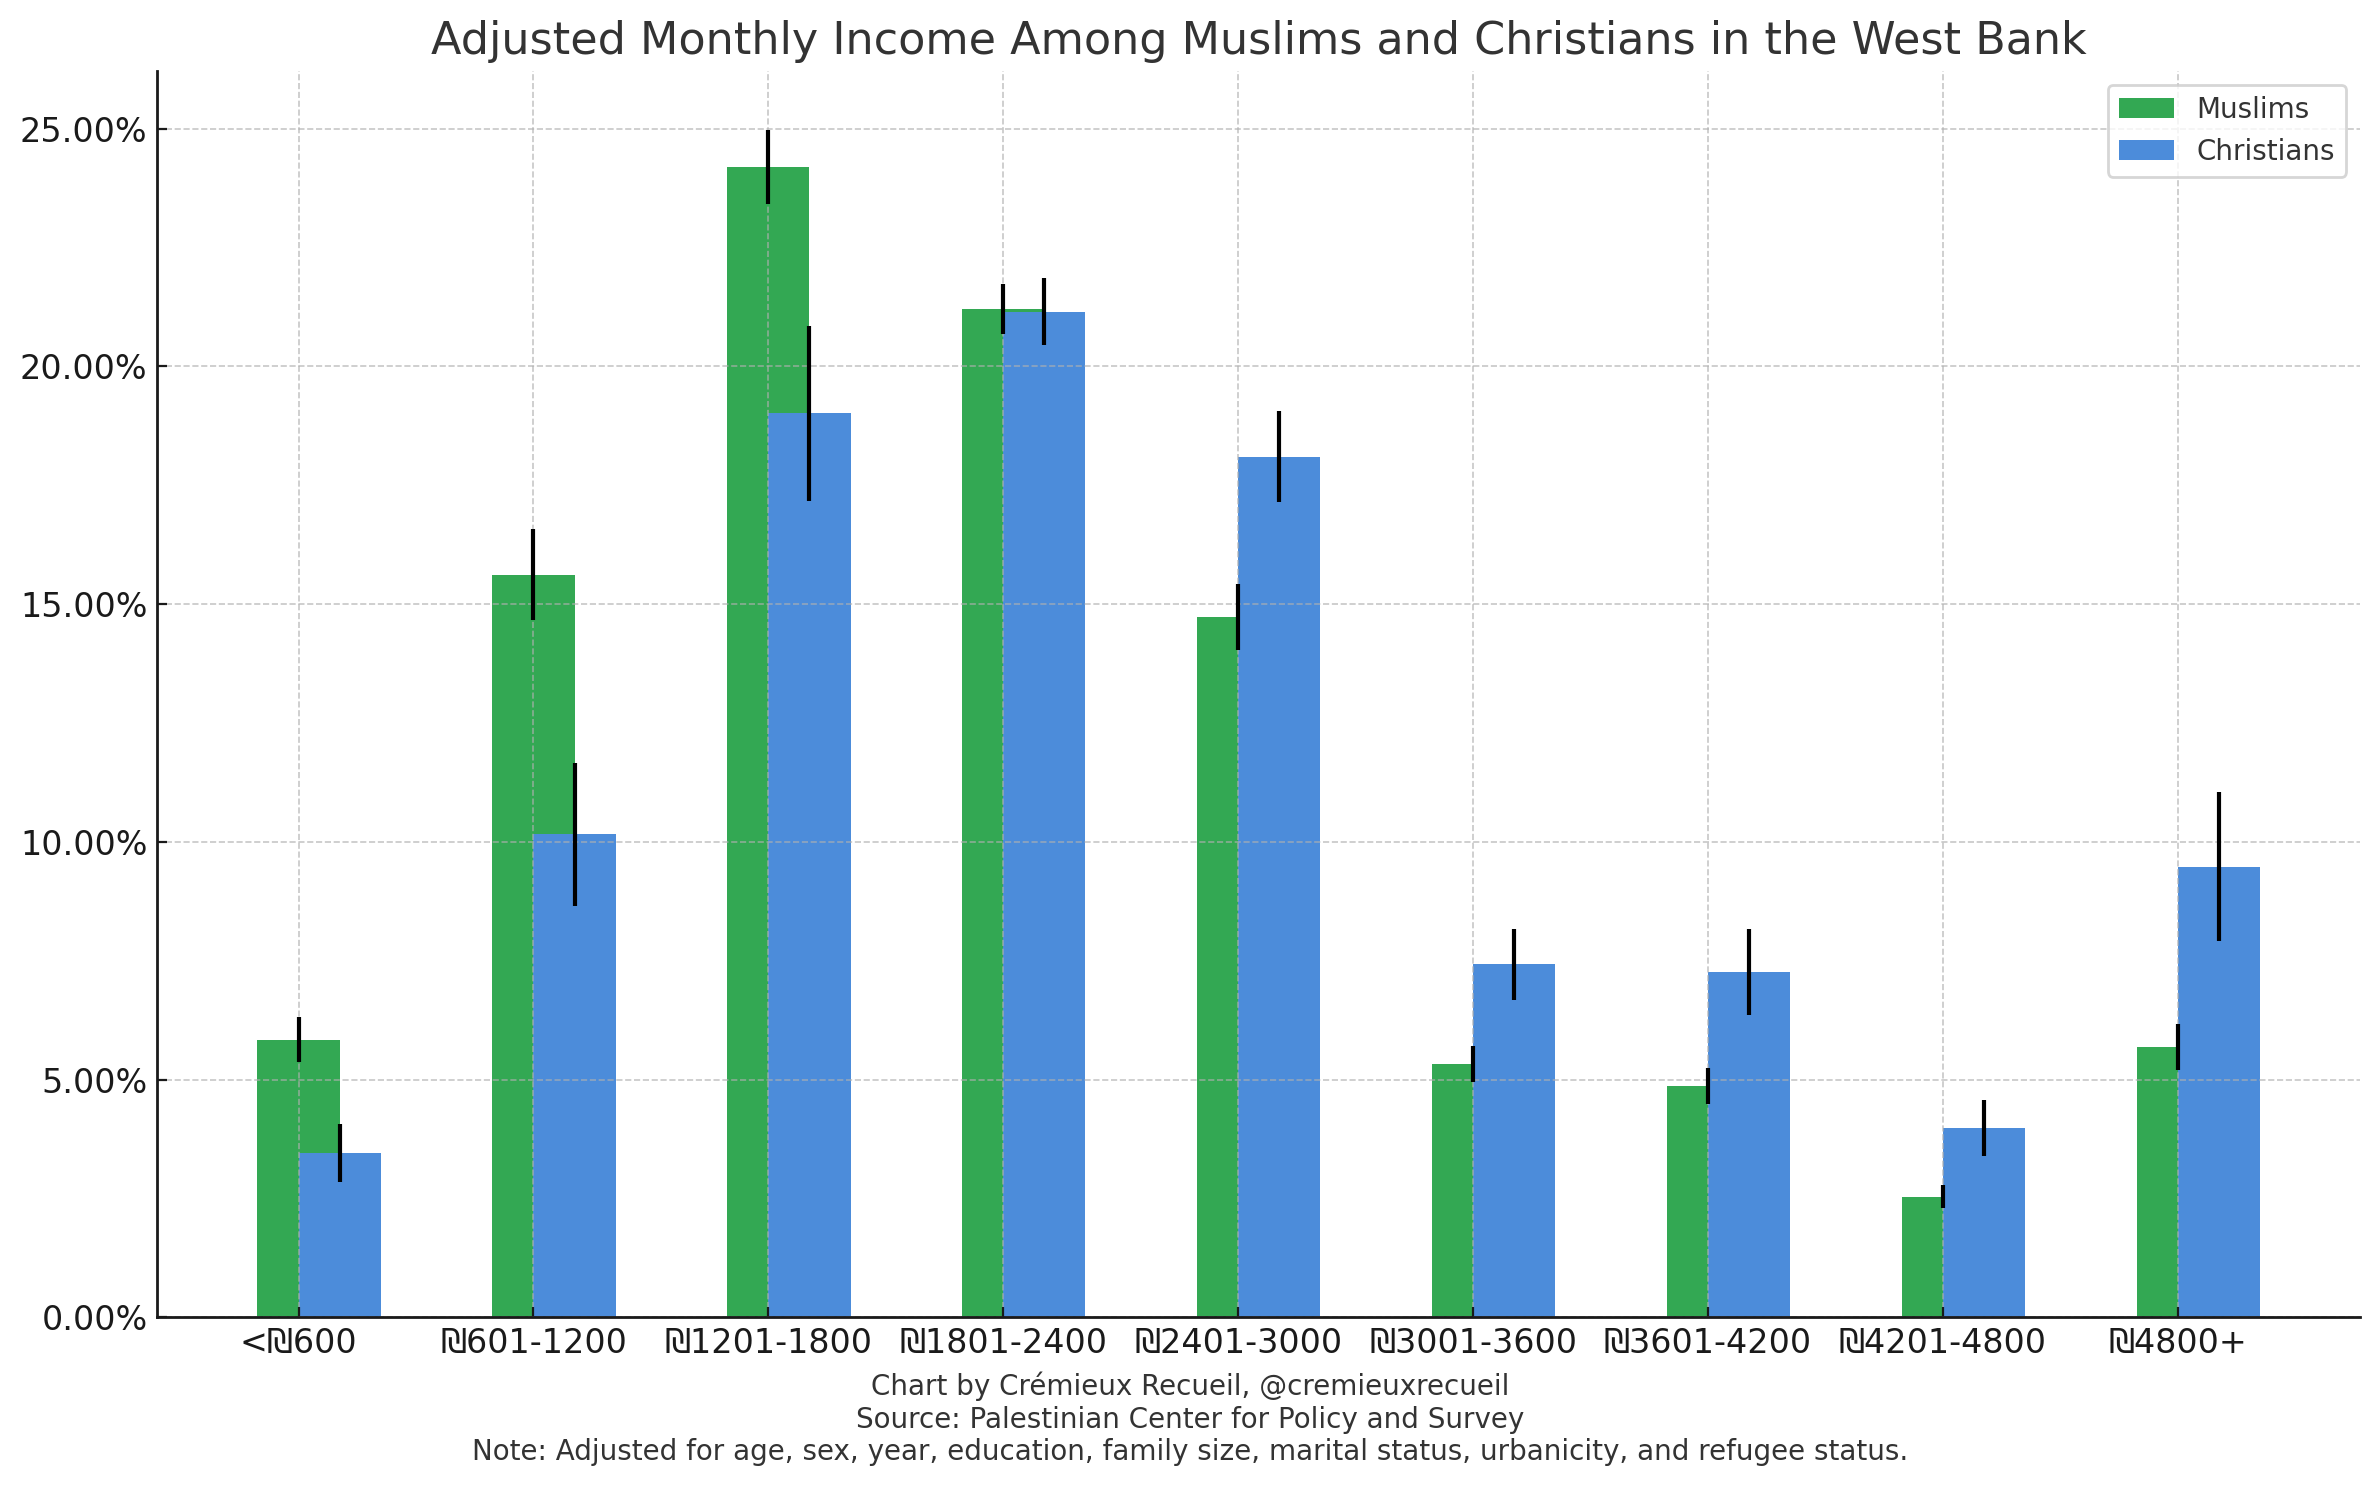
After adjustment for age, sex, survey year, education, family size, marital status, urbanicity, and refugee status, this is the result:
After all of those demographic controls and controlling an explicit and obvious explanatory variable (education), differences remain. The final graph takes this one step further and adjusts for another important mediator: occupation. This is especially important because Islam keeps women in the home, so the modal occupation among Muslims is “housewife”.8 Here’s the result:
With everything out of the way including the two important mediating variables, Christian Palestinians were still underrepresented in the lowest income groups and overrepresented in the highest ones when compared to Muslim Palestinians.
Good Land, Bad Land
When nature sees fit to bequeath a people with immense natural wealth, it impoverishes them in the long run. That is effectively what stands out in this chart:
Litina documented that places with lands that are more suitable for agriculture are poorer today. This is somewhat unusual, as, all else equal, wouldn’t a people with an easier time doing agriculture be better off? Similarly, wouldn’t geographic isolation be harmful because it impedes trade?
In both of these cases, the result is unintuitive and amusing. After all, how could obviously beneficial things come with bad effects? And the answer is that we’re dealing with history, of course.
Historical change involves processes—if something made life easier in the past, it may have reduced the desire to innovate, which is a key ingredient in industrialization. Or, if trade facilitated plagues, wars, conquests, and polity dissolution through the interaction of diffuse borders and limited state capacity, it might have marred an area for the foreseeable future. That seems in line with what Litina posited, which was that areas with lower land suitability fostered cooperation, because to survive, people had to work together better when the land provided them with less opportunity.
Few deep roots findings are this counterintuitive. For example, Alesina, Giuliano & Nunn found that the use of the plough for agriculture historically was associated with different gender norms today.
Neighborhoods vs Families
One of the most interesting job market papers I’ve seen lately is entitled “The Origins of Parenting”. It describes parenting styles, and the extent to which they come from the family or the neighborhood. The way parenting is conceptualized is like this:
If a parent is demanding and unresponsive to a child’s needs, they’re authoritarian; if they’re demanding and responsive, they’re authoritative; if they’re not demanding and they’re not responsive, they’re neglectful; if they’re responsive but not demanding, they’re permissive. There’s also “no-nonsense” parenting, which is like authoritative parenting, with the addition of stringent child monitoring and extensive control of children’s lifestyles.
To the extent these parenting styles matter, it’s important to understand where they come from, but the most common datasets people use to investigate household behavior—Add Health, the CNLSY, PSID—don’t have the required data on siblings and neighbors alongside measurements of parenting behaviors. So the author of this paper used a relatively novel dataset: The Project on Human Development in Chicago Neighborhoods (PHDCN), which has included a representative sample of over 6,200 children in seven birth cohorts who were living in Chicago in the mid-1990s. The PHDCN Longitudinal Cohort Study (LCS) has longitudinal measurements of neighborhood context, various aspects of human development, and self-reported and observed parenting behaviors, in addition to data for siblings within the same families.
To break down the degree to which parenting behaviors are derived from neighborhood or families, the author leveraged movers: people sort into different neighborhoods and if we observe them over multiple waves of data collection, variance in neighborhood characteristics can be leveraged to estimate neighborhood effects. With this large, American data in hand, the author was able to compute the upper-bound on neighborhood effects—”the observable covariance in the outcome variable between neighbors”—and the lower-bound on family effects—”the covariance between siblings less the covariance between neighbors”—in addition to the bounds on idiosyncratic effects. The estimation and identification strategy was actually quite ingenious, so I recommend giving that section a read.
Here’s the first result: family and neighborhood effects on self-reported parenting behaviors:
The average lower-bound on family effects was 27.5% and the average upper-bound on neighborhood effects was just 0.9%. Most of the variance seems to be independent of both, but the variance due to neighborhoods seems to be virtually nil! It’s certainly small enough that it might not matter for determining self-reported parenting behaviors, and it is, in fact, nonsignificant excepting “Ever Swore” and “Homework Rules and Checks”. But there might be problems with self-reports. People’s self-evaluations might be much more idiosyncratic than their behaviors really are, so the author vetted them by performing the same analysis with interviewer-observed parenting behaviors. Unfortunately, these variables were not quite the same, but they’re still worth considering:
The average upper-bound on neighborhood effects was 1.9%, and estimates were generally significant; the average lower-bound on family effects was 55.6%, and of course, all estimates were significant. To put this into a more familiar form, the author also looked at family and neighborhood effects on discretized parenting styles:
For assignment to a type of parenting style, the upper-bound on neighborhood effects averaged 2.6% and the lower-bound on family effects averaged 51%. Clearly, across different types of measurements of parenting behaviors and styles, neighborhoods matter much less than features that are idiosyncratic to families. But some neighborhoods are much worse than others. That is actually a common explanation for why so many Black parents seem to engage in the “no-nonsense” parenting style: they live in “bad neighborhoods”, so they try to control what their kids do so they can keep them safe. So what do the upper-bounds on neighborhood effects look like in high-crime and low-opportunity neighborhoods only? With self-reported parenting behaviors, like this:
The averages for high-crime and low-opportunity neighborhoods were 1% and 0%, respectively. This result is virtually identical on the other end, in low-crime and high-opportunity neighborhoods, where neighborhood effects averaged 1% and 2%, respectively:
Perhaps, however, it is racialized experiences that make neighborhoods matter more for Blacks and Hispanics than for Whites. As the author noted, there were differences in parenting behaviors by race, but are they attributable to neighborhoods? To answer that, the authors tested that too:
To make things even more explicit, the causal effect of moving to dangerous and low-opportunity neighborhoods was also estimated:
The same conclusions held for moves to safe and high-opportunity neighborhoods. In numerous permutations of these results and with a litany of robustness checks, neighborhoods were consistently unimportant as a determinant of parenting behaviors and family-level idiosyncrasies mattered to a much greater and, indeed, a major degree.
In Simulations
Unfortunately, mice and humans are different.
This is the source of an enormous number of misconceptions about the reality of different genetics effects, the reality of different psychological effects, and even whether certain drugs actually work.


