

Today’s post is brought to you by my sponsor, Mechanize. They’re hiring junior software engineers at $300K/year base salary.

Spend enough time online and you’ll probably hear claims like:
89% of Americans have lived paycheck-to-paycheck in the last year;
78% of Americans are living paycheck to paycheck, a six percent increase in just one year;
63% of Americans consider themselves to be living paycheck to paycheck;
63% of Americans have been living paycheck to paycheck since the pandemic began;
A majority of Americans earning $100,000 are living paycheck to paycheck;
36% of those earning $250,000 or more live paycheck to paycheck;
Americans living paycheck to paycheck own 60% of credit card debt;
37% of Americans lack enough money to cover a $400 emergency expense;
A majority of Americans cannot afford a $1,000 emergency expense;
Read enough of these headlines and you’ll get the impression that the American precariat is large—perhaps unsustainably so. But, notice too, that these headlines disagree with one another. How, for example, could it be true that 48% and 78% of Americans are living paycheck-to-paycheck? Which is right? The links contain numerous internal inconsistencies, too. For example, PYMNTS’ estimates show a higher annual average percentage (70%) than the monthly readings it summarizes.
Something is amiss!
The truth is that the concept of living paycheck-to-paycheck is poorly measured. It is both inconsistently defined to mean many different things and the samples used to measure it are often highly unrepresentative. Plus, surveys are reported on carelessly.
Consider the claim that 37% of Americans lack the money to cover a $400 emergency expense. That seems extreme, but that’s because it’s not an accurate description of the quantity. The actual thing being measured is ‘Would you cover a $400 emergency expense with cash or its equivalents?’, and the follow-up question of ‘Could you pay it by any means?’ was answered in the affirmative by 88% of people.1
If you ask people directly whether they’re living paycheck-to-paycheck, most—55% here—say ‘yes’. However, of that sample, just 21% of them define that condition as being unable to pay monthly bills without their next paycheck. This very directly gives the game away: most people don’t have a good definition of what it means to live paycheck-to-paycheck, and that’s reflected across different surveys, with their wildly varying numbers and implications.
If we want to obtain a realistic estimate of the portion of Americans living paycheck-to-paycheck, we have to think about what we’re trying to measure. For example, if we’re talking about cushion beyond the next paycheck, the Survey of Consumer Finances (SCF) data for 2025 suggests the best estimate is 23%, with a range of 17-34% depending on pay frequency and cushion threshold. If we pare that down to just people for whom there’s no cushion because of low income—defined as income below two-times the poverty line plus bad year shocks—, the number becomes 9-13%. If the number is households earning $100,000 per year or more with no cushion, it’s 11%, but this drops to 6% if they’re also not saving.
If we use a more expansive definition of paycheck-to-paycheck, then in the SCF and the Fed’s Survey of Household Economics and Decisionmaking (SHED) we get to about 47% of households fitting the criteria. But most of these households also hold some savings each month, so they’re clearly not ‘paycheck-to-paycheck’ because they’re actively able to build cushion. But what about just going based on self-reported struggle? In the SHED, that’s 27-30% reporting they’re “Just getting by”.
If we want to get a best estimate, none of the above will do. We need a standard, because these all disagree while possibly being correct and also possibly being biased in their own ways. So, my procedure to get there using the SCF involves, first, figuring out who has no cushion. A household counts as having no cushion if the cash it can reach would run out before the next paycheck, meaning that they’re living hand-to-mouth. This covers checking, savings, money market and prepaid accounts, plus directly held stocks, bonds, funds, and savings bonds, minus credit card balances and excluding retirement accounts and home equity, with ‘no cushion’ meaning that the amount of those things is at or below half of one two-week paycheck. That’s 23.3% of households.
We then need to do some subtraction. We need to see who can’t afford a cushion by comparing each household’s usual yearly income with the federal poverty line for their size. Household size is the head, the spouse or partner, and their children, and if they’re below twice the poverty line, we can—reasonably, but debatably—count the household as being unable to afford a cushion due to non-lifestyle reasons. About 22% of households fall under that line and 42% have no cushion, representing 9.1% of all households.
Next, we need to figure out who are precarious due to having an unusually bad year. About half of above-line households report that their income last year was more than 10% below its usual level, or their expenses were unusually high. With a bad year, 23.3% have no cushion, and without one, 12.8% do. We count only the gap, 10.5 points, applied to households that had a bad year, adding up to 4.2% of all households.
Finally, we do some addition. 9.1% plus 4.2% equals 13.3% of households, or about 18 million. The remaining 10% have no cushion, adequate income, and no bad year to blame for their finances. Then, we weight each household by its size, giving 13.7% of people, or about 42-47 million people.2
So, how many Americans are living paycheck-to-paycheck? It’s a judgment call ranging from ~7-18% depending on how you treat the threshold, non-nuclear families, and so on. But what it is not is an estimate like ‘65% of Americans live paycheck-to-paycheck.’
But Americans Are Starving in the Streets!
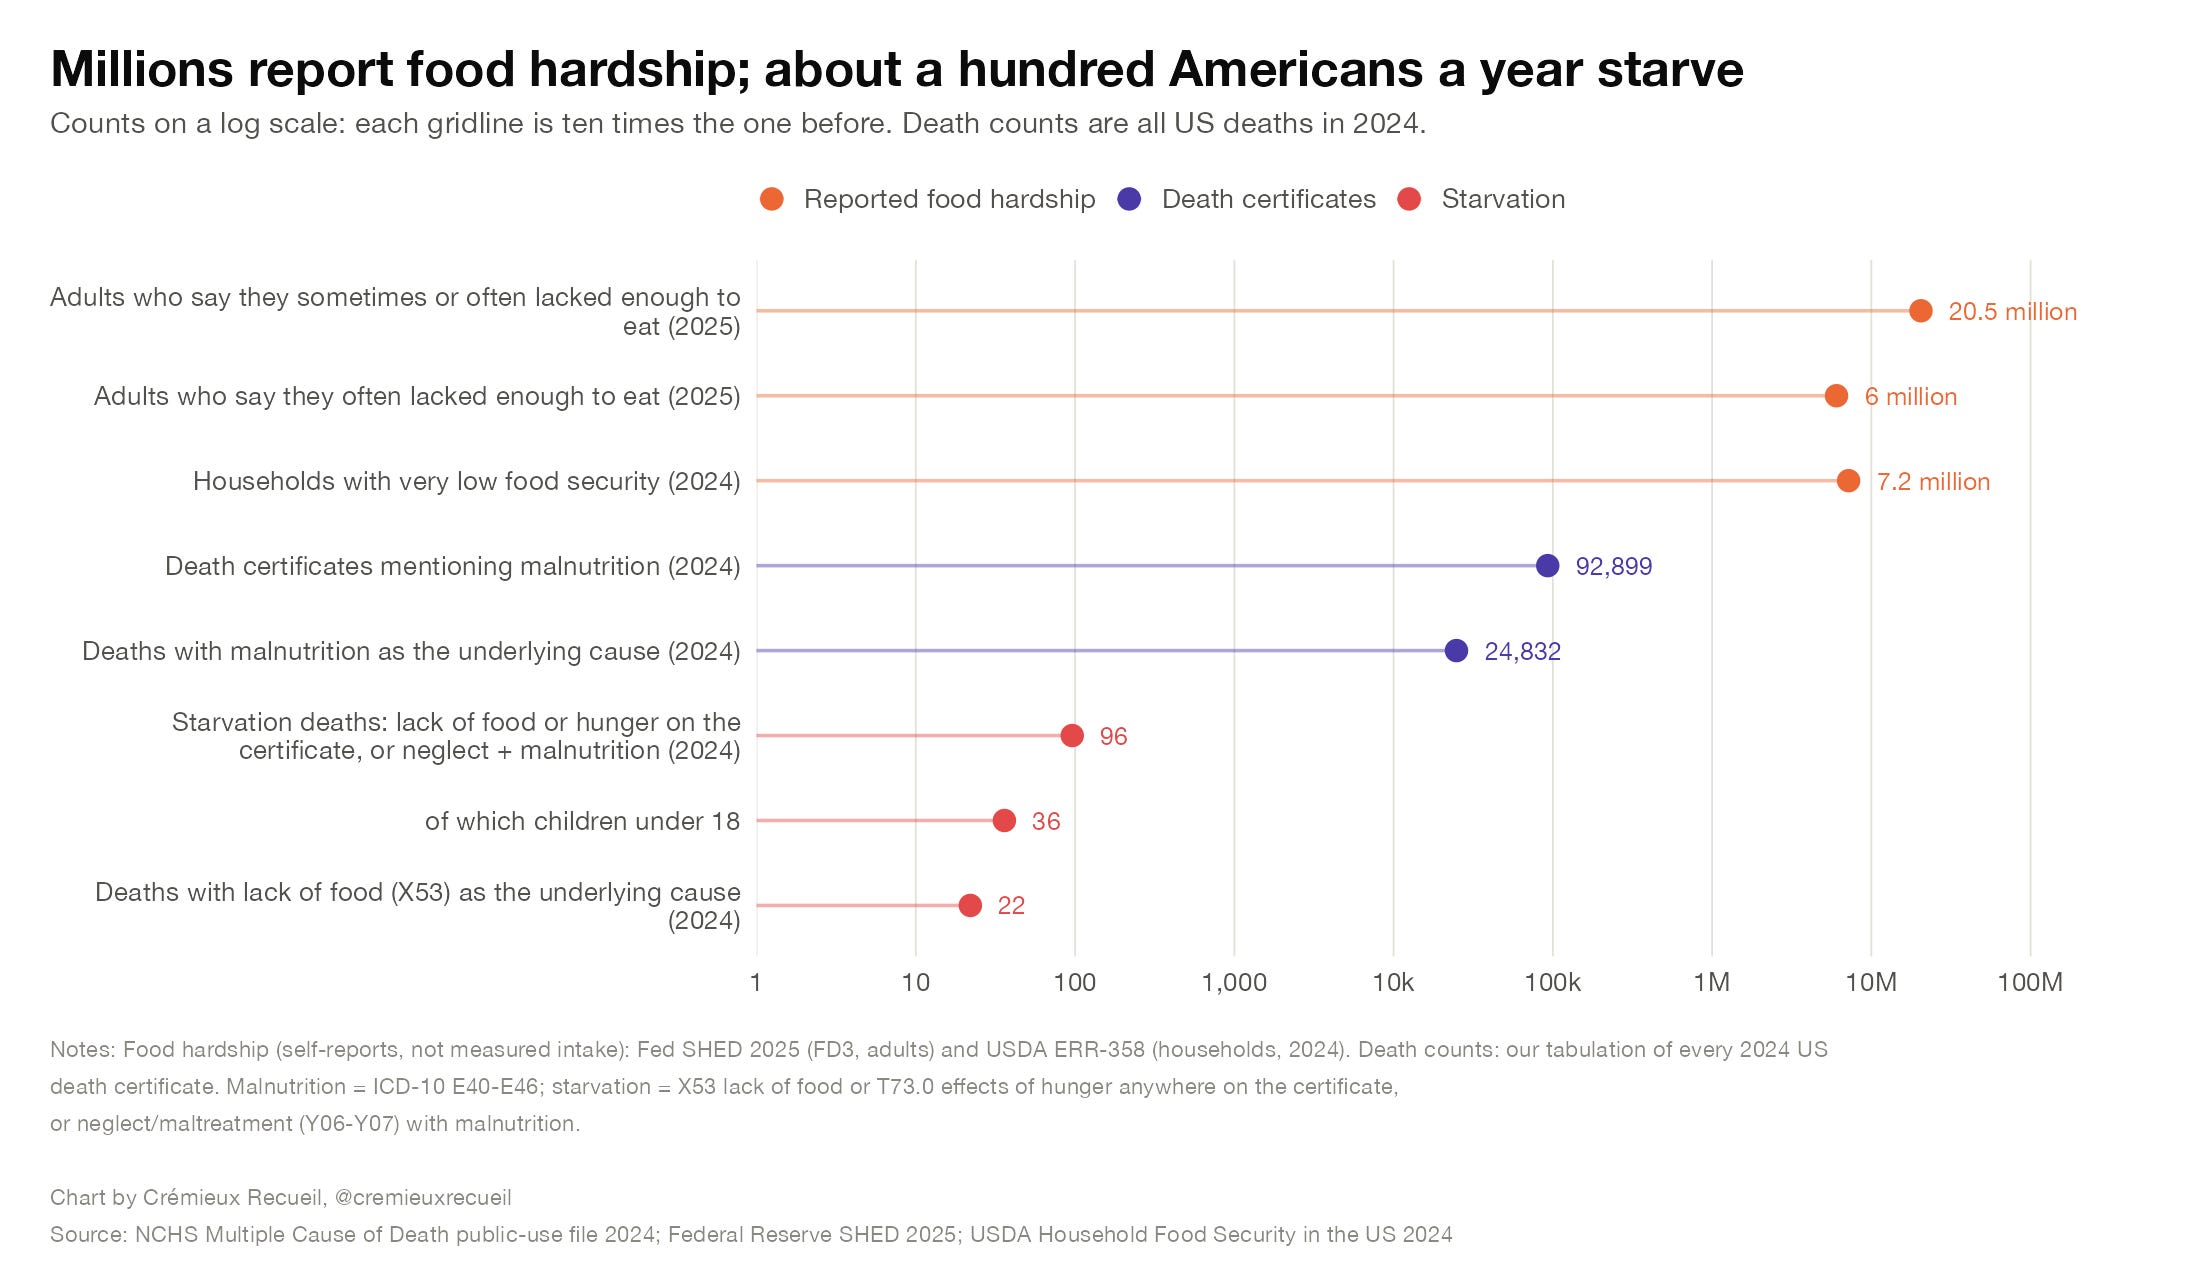
If we use the Fed’s SHED, we see that some 7.8% of adults report sometimes or often (2.3% often) feeling like they’re unable to get enough food. These people are considered ‘food-insecure’, and even though they may not be living paycheck-to-paycheck per se, if we take their claims seriously, then they are definitely economically struggling. But there are three big issues here. Before getting to them, let’s look at some numbers:
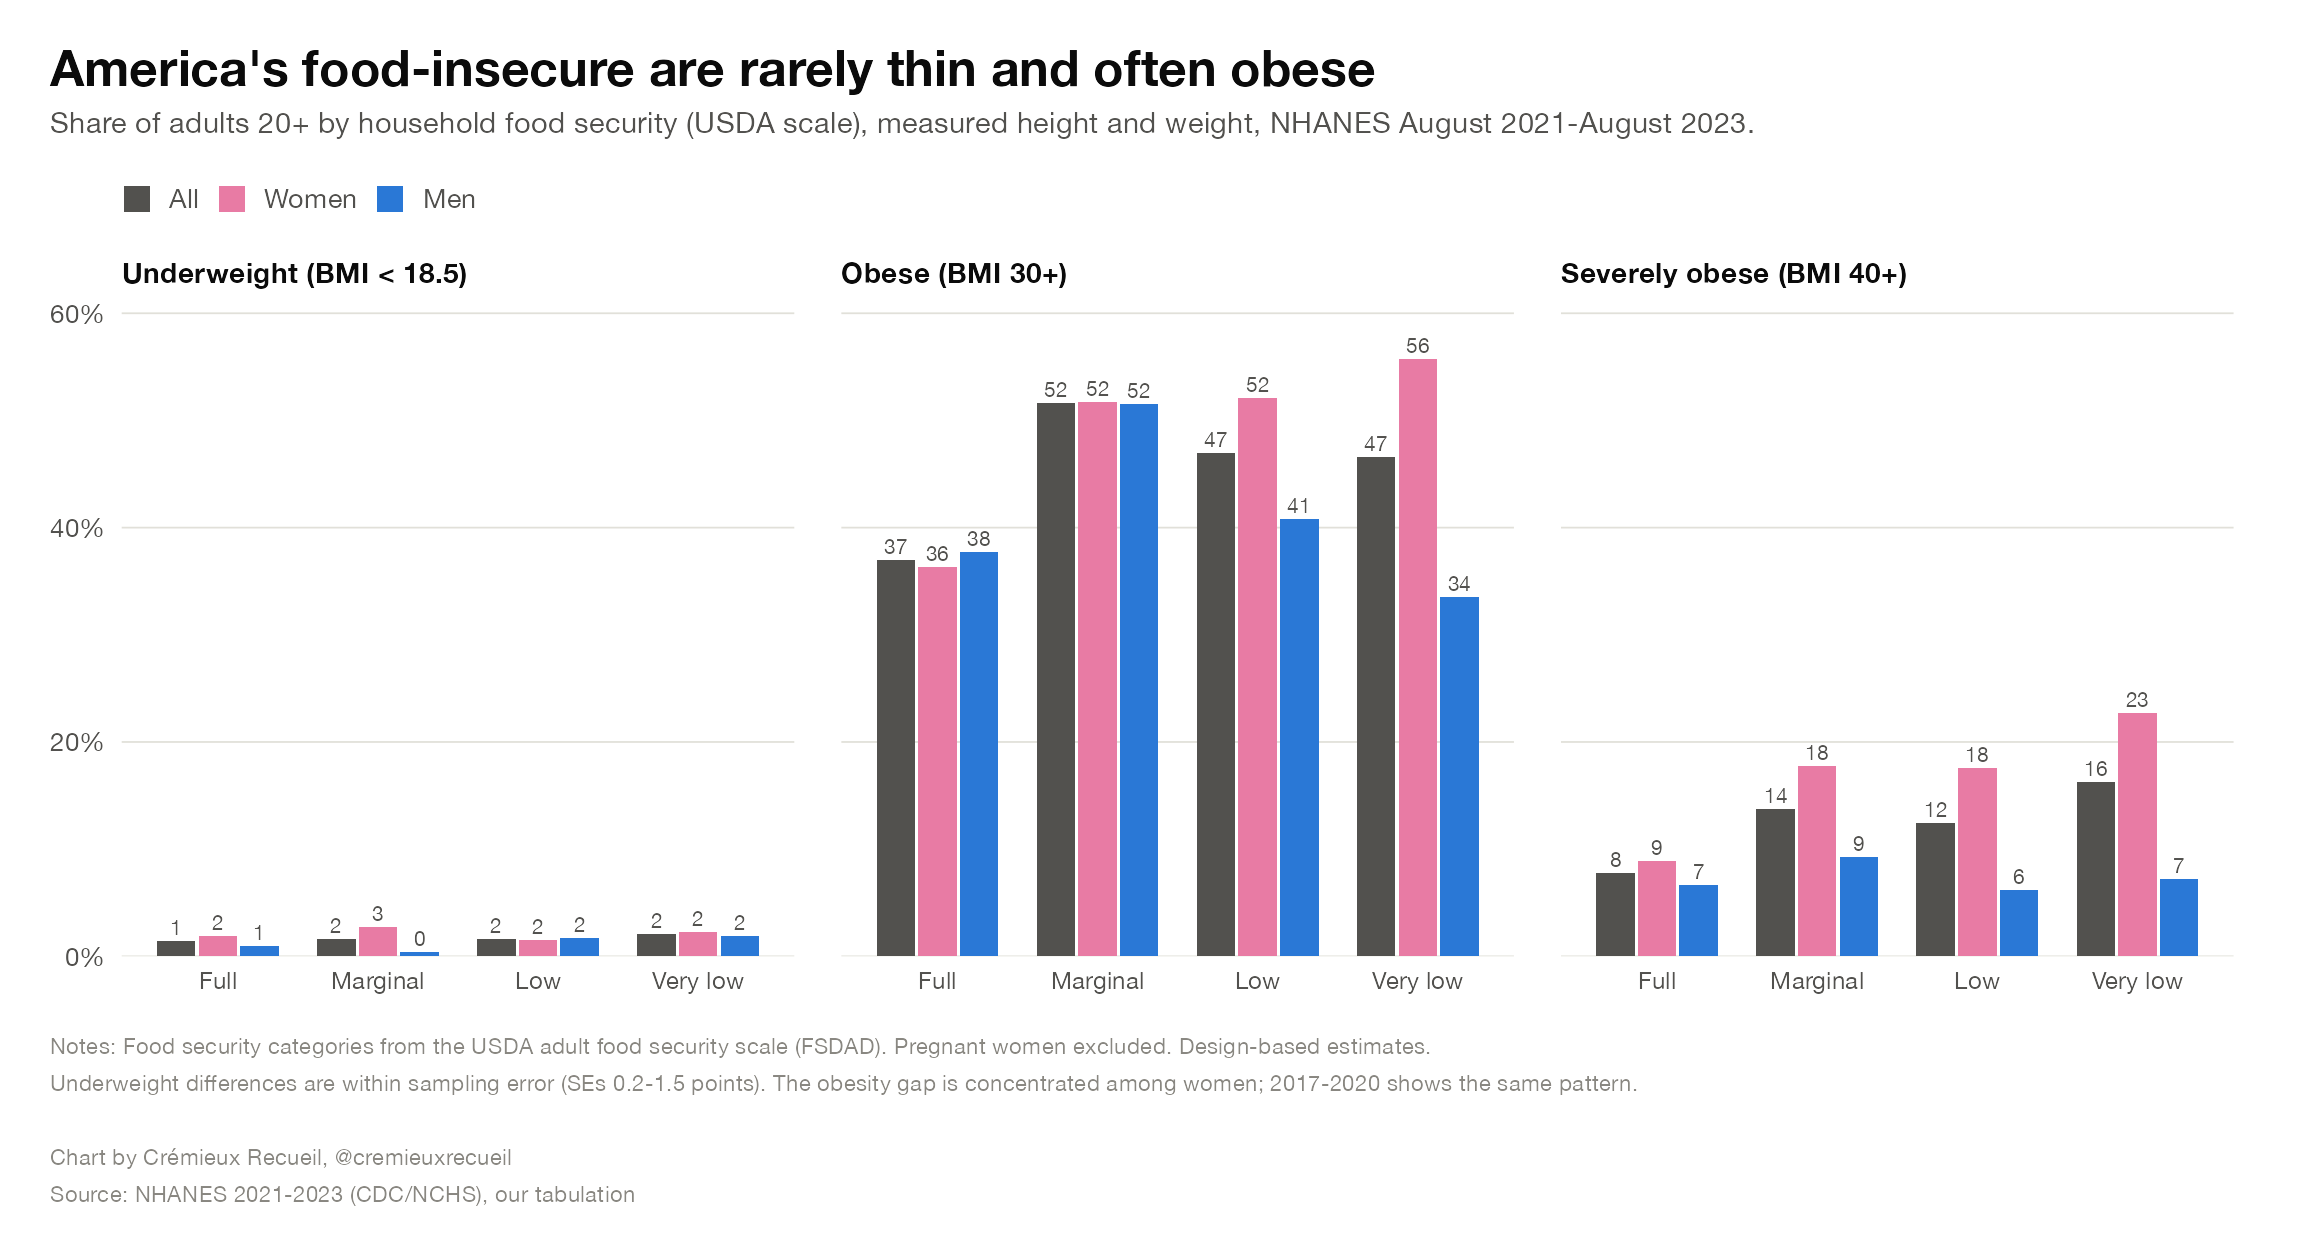
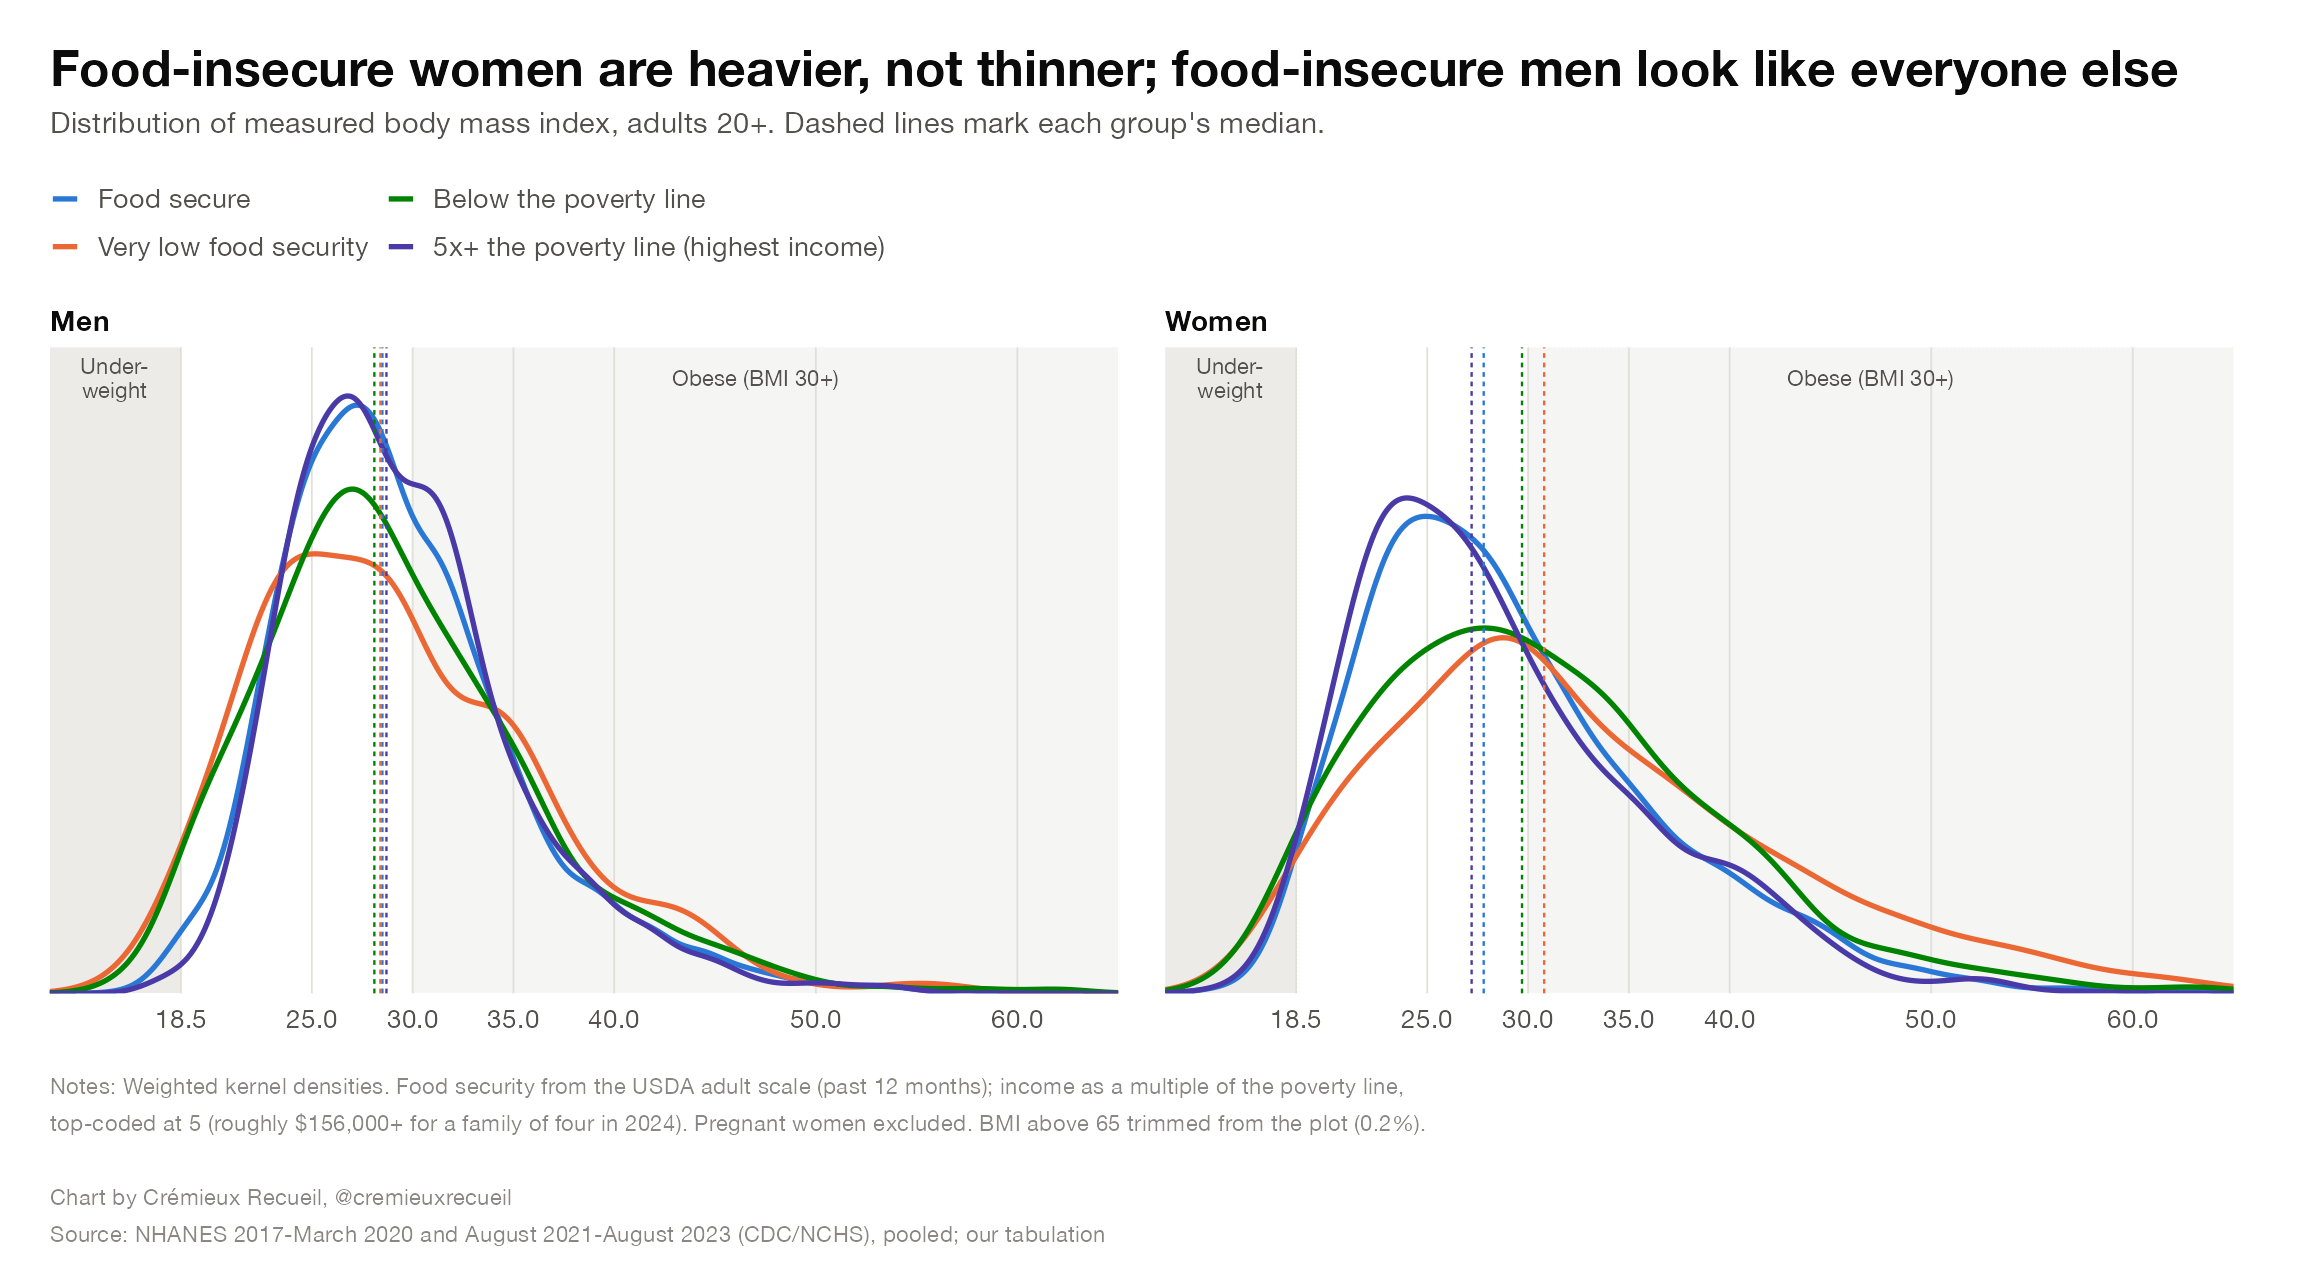
The first issue to note is that food insecurity is paradoxically associated with obesity. This might seem odd, but recall: in the modern world, it’s the poor who tend to be fatter. This is precisely because they are not starving, or even anywhere near being at-risk of it except in the most rare and extreme of cases.3
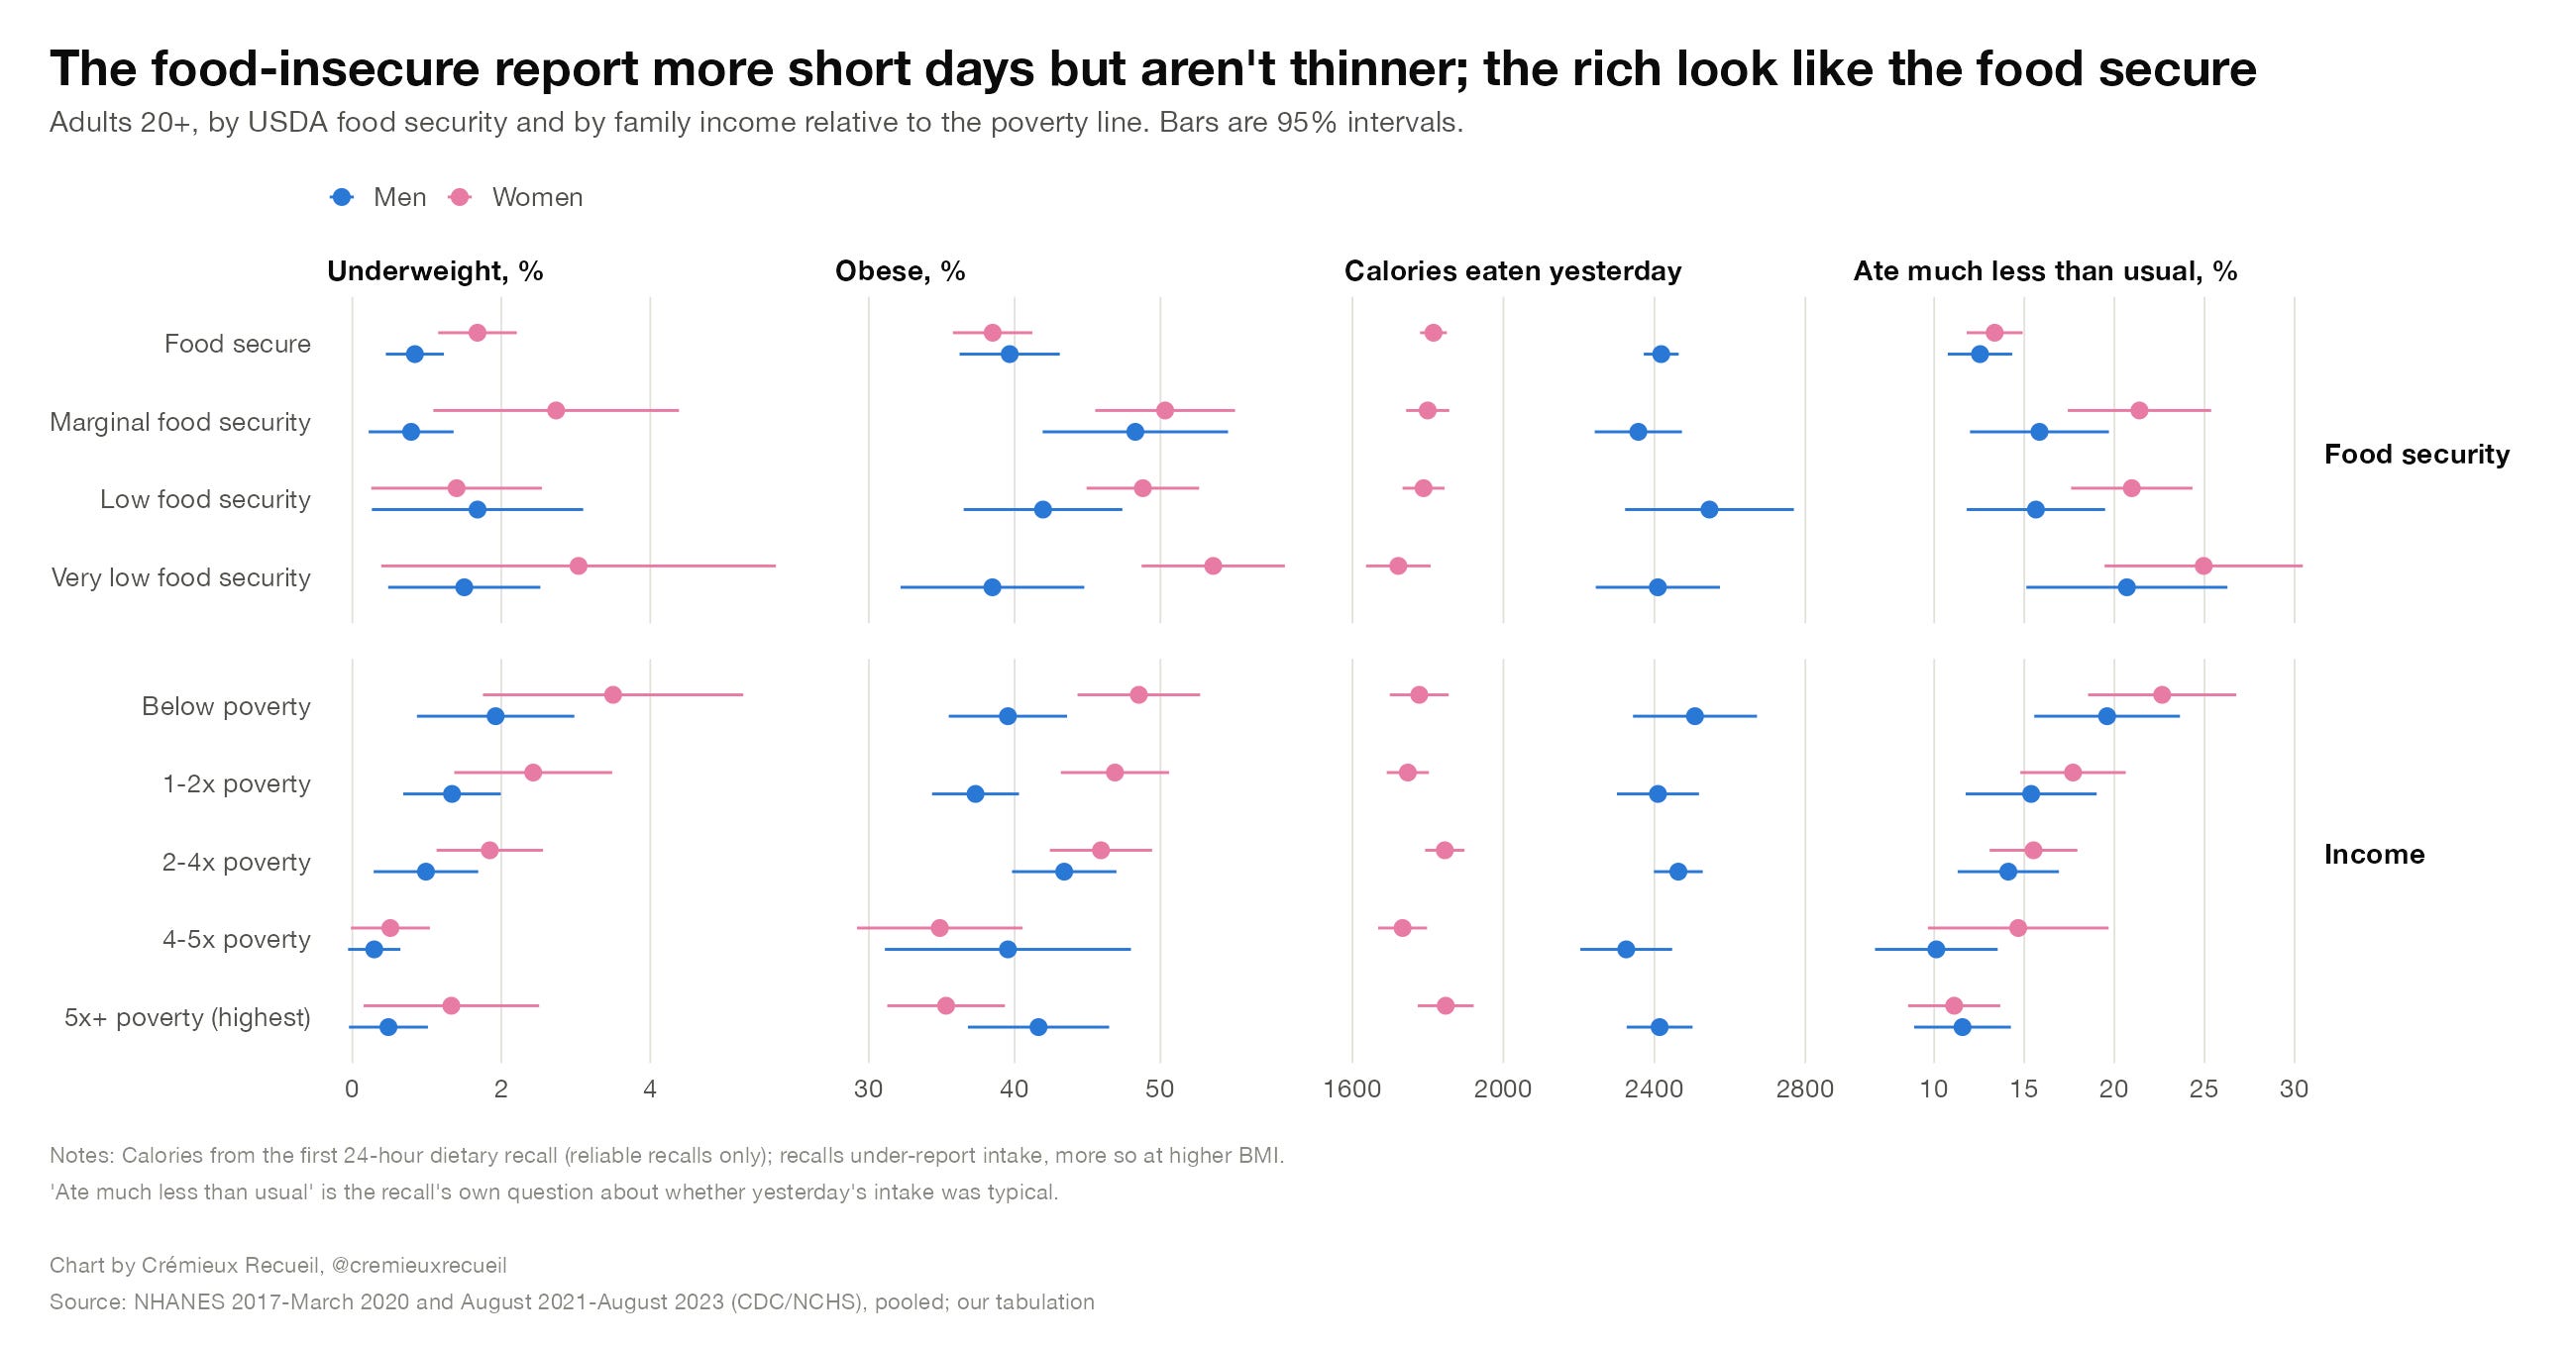
The second issue to note is that food insecurity is associated with reporting differences. Namely, the food-insecure report eating about the same amounts of calories as the food-secure while also reporting that they ate much less than usual. It may be the case that, to the food-insecure, a day without what would be a binge to normal people is anomalously scant for them.
The final issue is that there’s a missing right tail of events driven by food-insecurity. Namely, wasting away and starving: virtually no one actually starves due to lack of food in the U.S. To be fair, there is a way to claim otherwise, but it’s based on a misreading of death certificates. To get to that misreading, look at this chart:
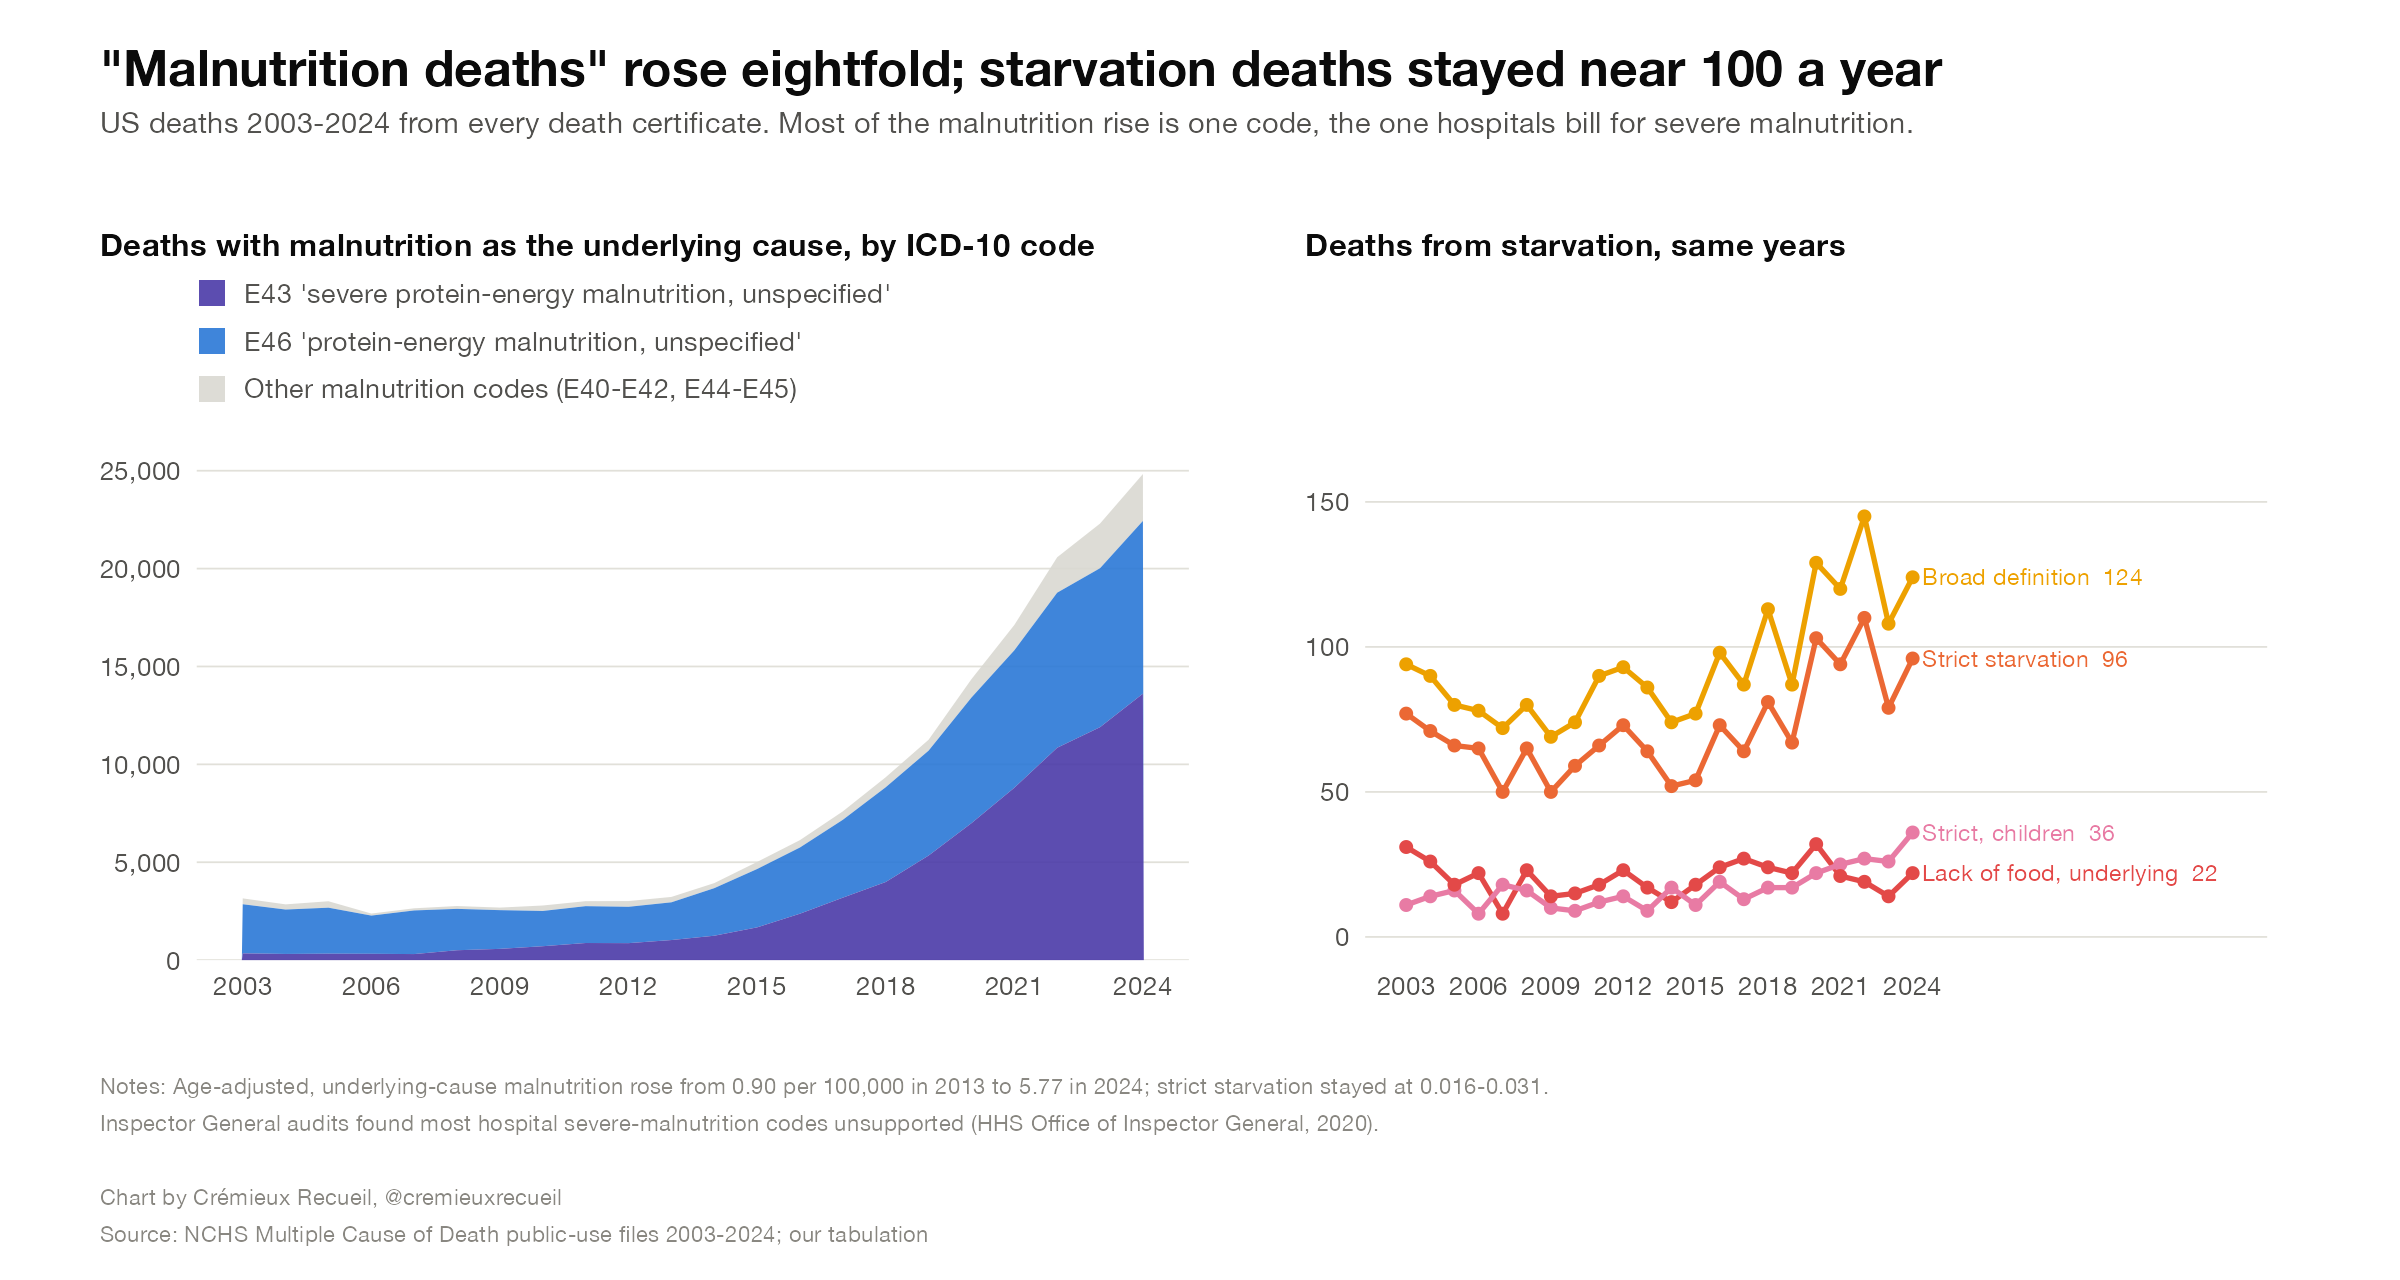
Notice how America has seen a massive rise in malnutrition-related deaths over the past decade or so? This has been used to make the case that America is falling behind and apart. But it’s an illusory phenomenon driven by diagnostic changes, not a substantial increase in malnutrition. Specifically, in October 2007, Medicare began paying for severe malnutrition, so while claims for malnutrition death were flat in following years, the share classified as severe began to rise. Next, the Academy of Nutrition and Dietetics and the Parenteral and Enteral Nutrition Society published new criteria making it easier to diagnose malnutrition in the sick and elderly in 2012. Finally, in 2014, Medicare stopped letting hospices use “adult failure to thrive” and “debility” as main diagnoses, so malnutrition became the natural substitute. As a result, we see a rise where we’d expect: old people dying at home or in nursing homes.4
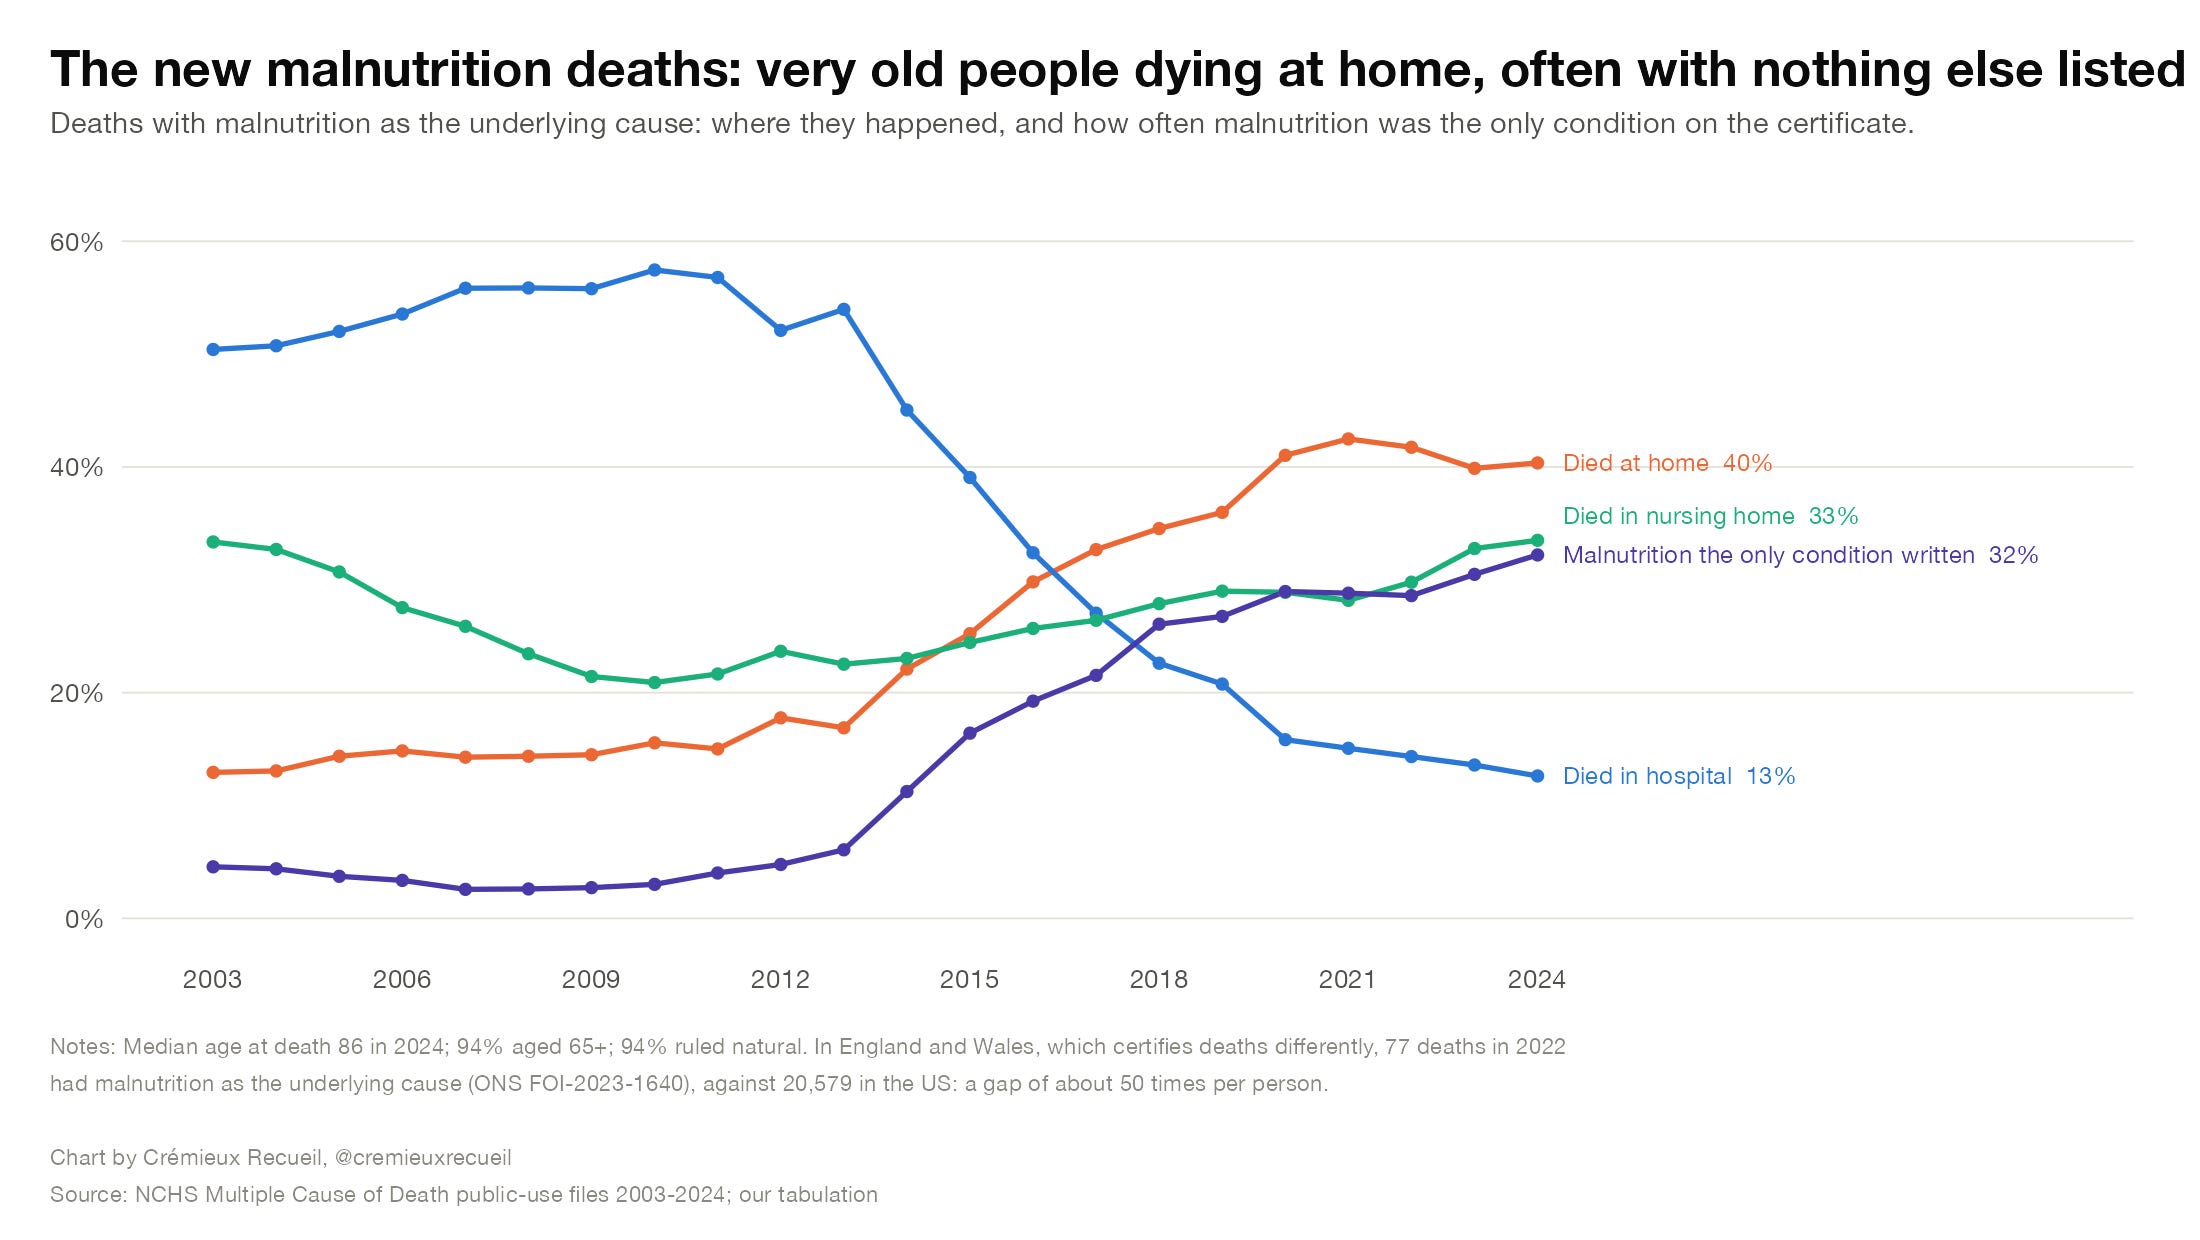
That missing right tail also shows up with the very small number of deaths listed as being due to lack of food alone in the National Center for Health Statistics’ (NCHS’) data on underlying causes of death for 2024. In that data, we can see that there were 22 strict starvation from lack of food deaths in the whole United States. Even this number overstates how many Americans are actually starving to death. The reason this number is an exaggeration is because the deaths are not really about starvation.
Two of America’s 22 lack of food deaths in 2024 were young children who died at home and the incidents were ruled accidents—that’s caregiver failure. Three involved dementia patients, one of whom was designated with a failure to thrive. Another four involved alcohol dependence, cirrhosis, liver failure, and chronic pancreatitis. Two involved swallowing problems among very old—78, 81—patients. One case was a 67-year-old woman dying at home with wasting due to self-neglect. Eight cases involved serious illness getting in the way of eating, including heart and kidney failure, COPD, diabetes, and a broken hip, with most of the cases being among the elderly. There were just two cases with nothing else listed: a 40-year-old man who died at home with dehydration and an 83-year-old man in the hospital, with no explanations for either case provided.
America has virtually abolished true poverty of the sort that leads people to lose their lives. It is a society so wealthy, filled with such abundance, and so obviously so, that when someone claims Americans are dying on the streets from empty stomachs or that they’re genuinely living hand-to-mouth and paycheck-to-paycheck with no cushion against adversity, we should look at them with at least a hint of revulsion, because they’re clearly trying to lie to us.
This was a timed post. The way these work is that if it takes me more than an hour to complete the post, an applet that I made deletes everything I’ve written so far and I abandon the post. You can find my previous timed post here.
A message from my sponsor, Mechanize:
We’re hiring software engineers to build environments and evals that frontier AI labs use to train coding agents.
To get a better sense of the work we do, you can check out GBA Eval, where we had models build Game Boy Advance emulators from scratch and scored their performance.
Base pay starts at $300K/year for junior software engineers, with more for senior roles, plus equity and performance bonuses. Apply here.
And if JPMorgan Chase’s 2024 data is to be believed, the number is actually at least 92%. I say ‘at least’, since that’s based on bank account balances.
The SCF does not count adult relatives and other members beyond core family.
Here’s how that looks distributionally. This view suggests that there’s higher variance among the food-insecure. That could be driven by people genuinely struggling to get food, but given the sex difference, that seems dubious.
These sorts of coding differences, changes, criteria, etc. are also behind national differences in rates, which are another, but related topic.
Thank you for this informative work. We all need much more of this way of viewing the "headlines".
Many live on their credit cards because their paychecks are inadequate.