
Think About Control Variables
If you don't, then who knows what you're controlling for?

This was a timed post. The way these work is that if it takes me more than an hour to complete the post, an applet that I made deletes everything I’ve written so far and I abandon the post. You can find my previous timed post here.
Glyphosate is perhaps the least toxic still-effective herbicide man has ever developed. But it’s artificial; naturally, then, there are those who despise it. However: (1) it is acknowledged to be safe; (2) the case against it is built on fraud and misunderstanding; (3) and in large population-representative American cohorts, it doesn’t seem to be related to bad health outcomes any more often than it’s related to good health outcomes. What do the critics have? They have their confusion.
I provided an example that speaks to this this over on X recently. The gist is that some researchers got a paper published claiming that people who had higher urinary glyphosate levels—an unreliable exposure measure—also had lower bone mineral density, implying that they would be more likely to suffer from fractures, osteoporosis, and other ailments of the nature. That’s not good, but it’s alright because the result was artefactual. The authors made a critical mistake by adjusting for age with quadratic age. Once I flexibly controlled for age, the result disappeared—bupkes!


The explanation for this result is simple: the relationship between bone mineral density (BMD) and age is not adequately described by a quadratic. I’ve plotted the relationship on the left, with the relationship after controlling for age with a quadratic on the right.
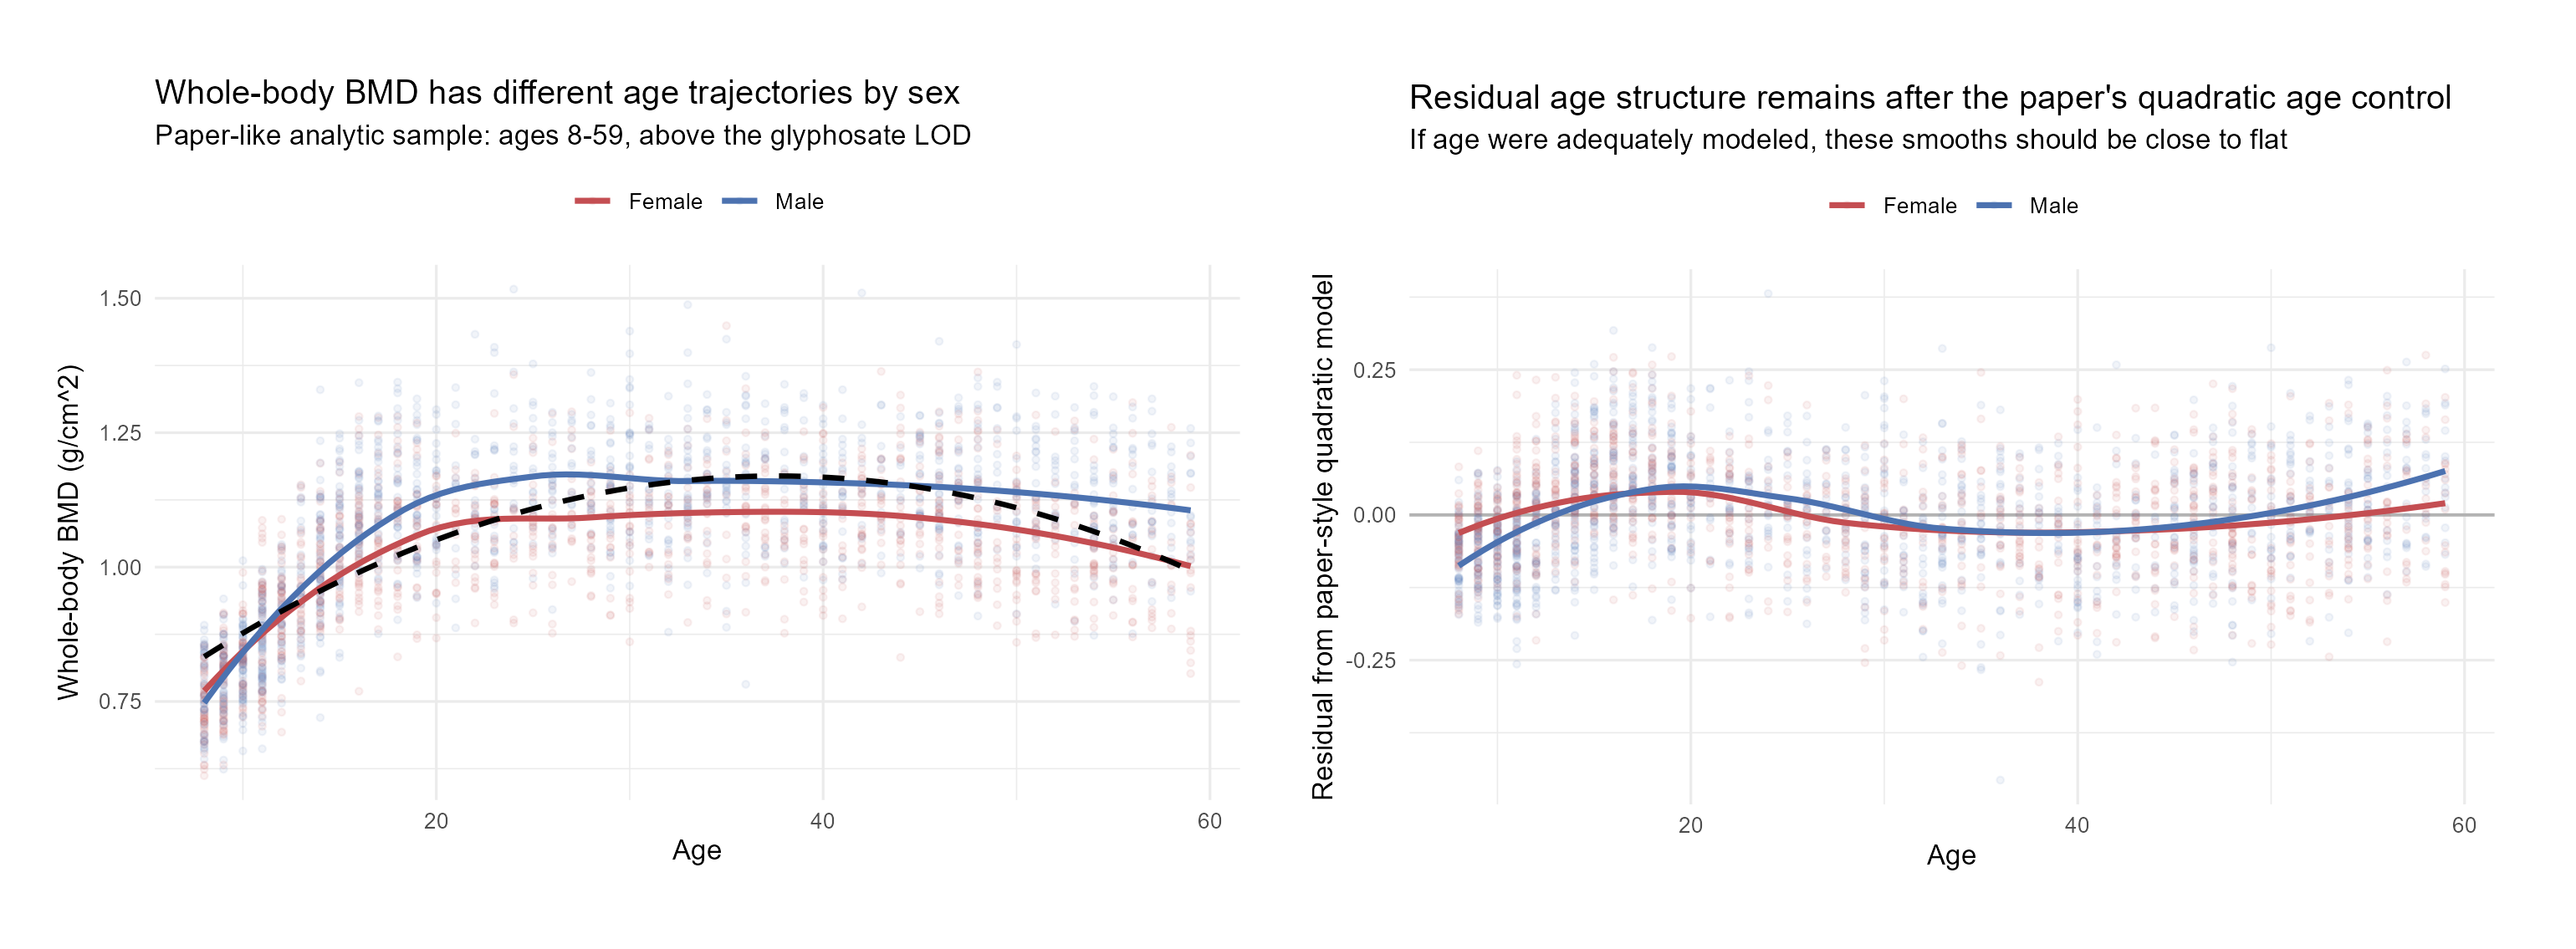
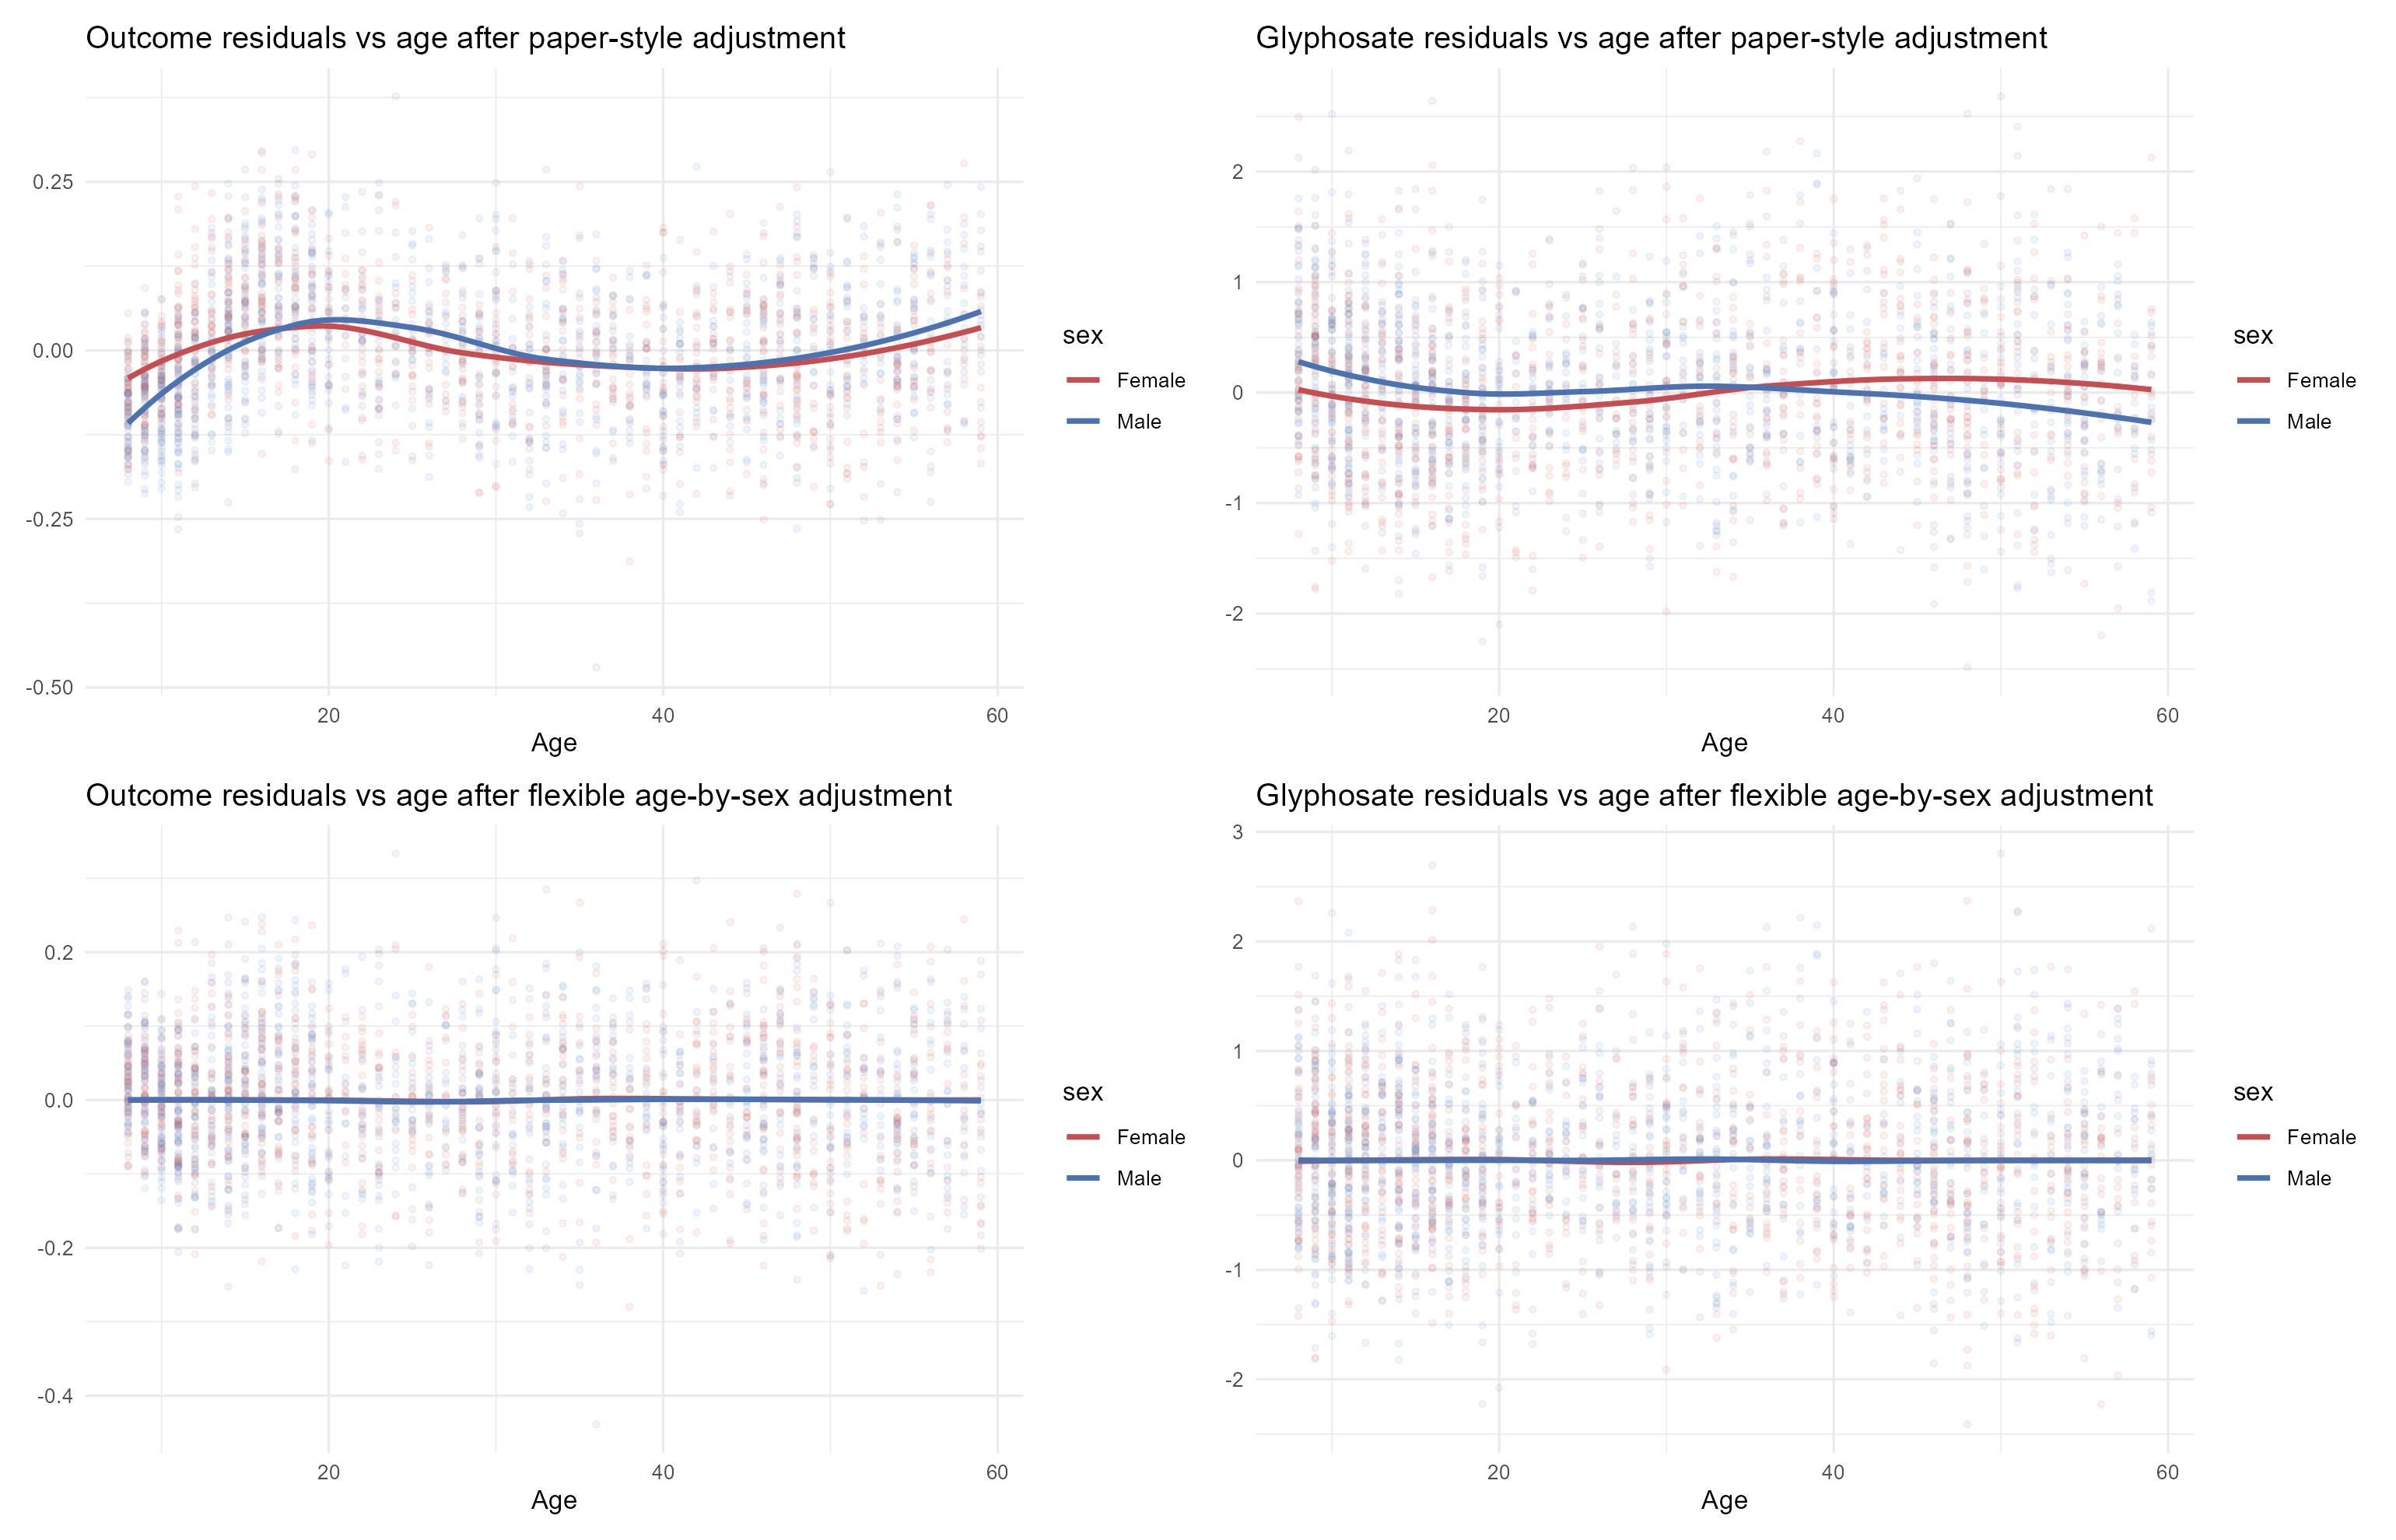
This is not what should happen when you control for a variable. If you do it right, there should be no relationship to the covariate—here that means age—after adjustment. In other words, BMD and glyphosate levels should be unrelated to age. Using the paper’s adjustment (top), they’re not; with my adjustment, they are (bottom):
The glyphosate-BMD example is not the focus of this article. I’m only mentioning it to make a broader point. That is: not only do you have to think about causality and measurement error when you control for a variable, you also have to think about the form of your controls.

How often do people actually do this? To my knowledge, the answer is ‘basically never’. Almost everyone who uses control variables uses them in a rote, brain-dead way, where the variables enter a regression and no one checks if they were entered appropriately. But, they should. Apply this advice broadly, not just to age. Tons of variables have forms that are not treated properly! Here’s an exemplary workflow:
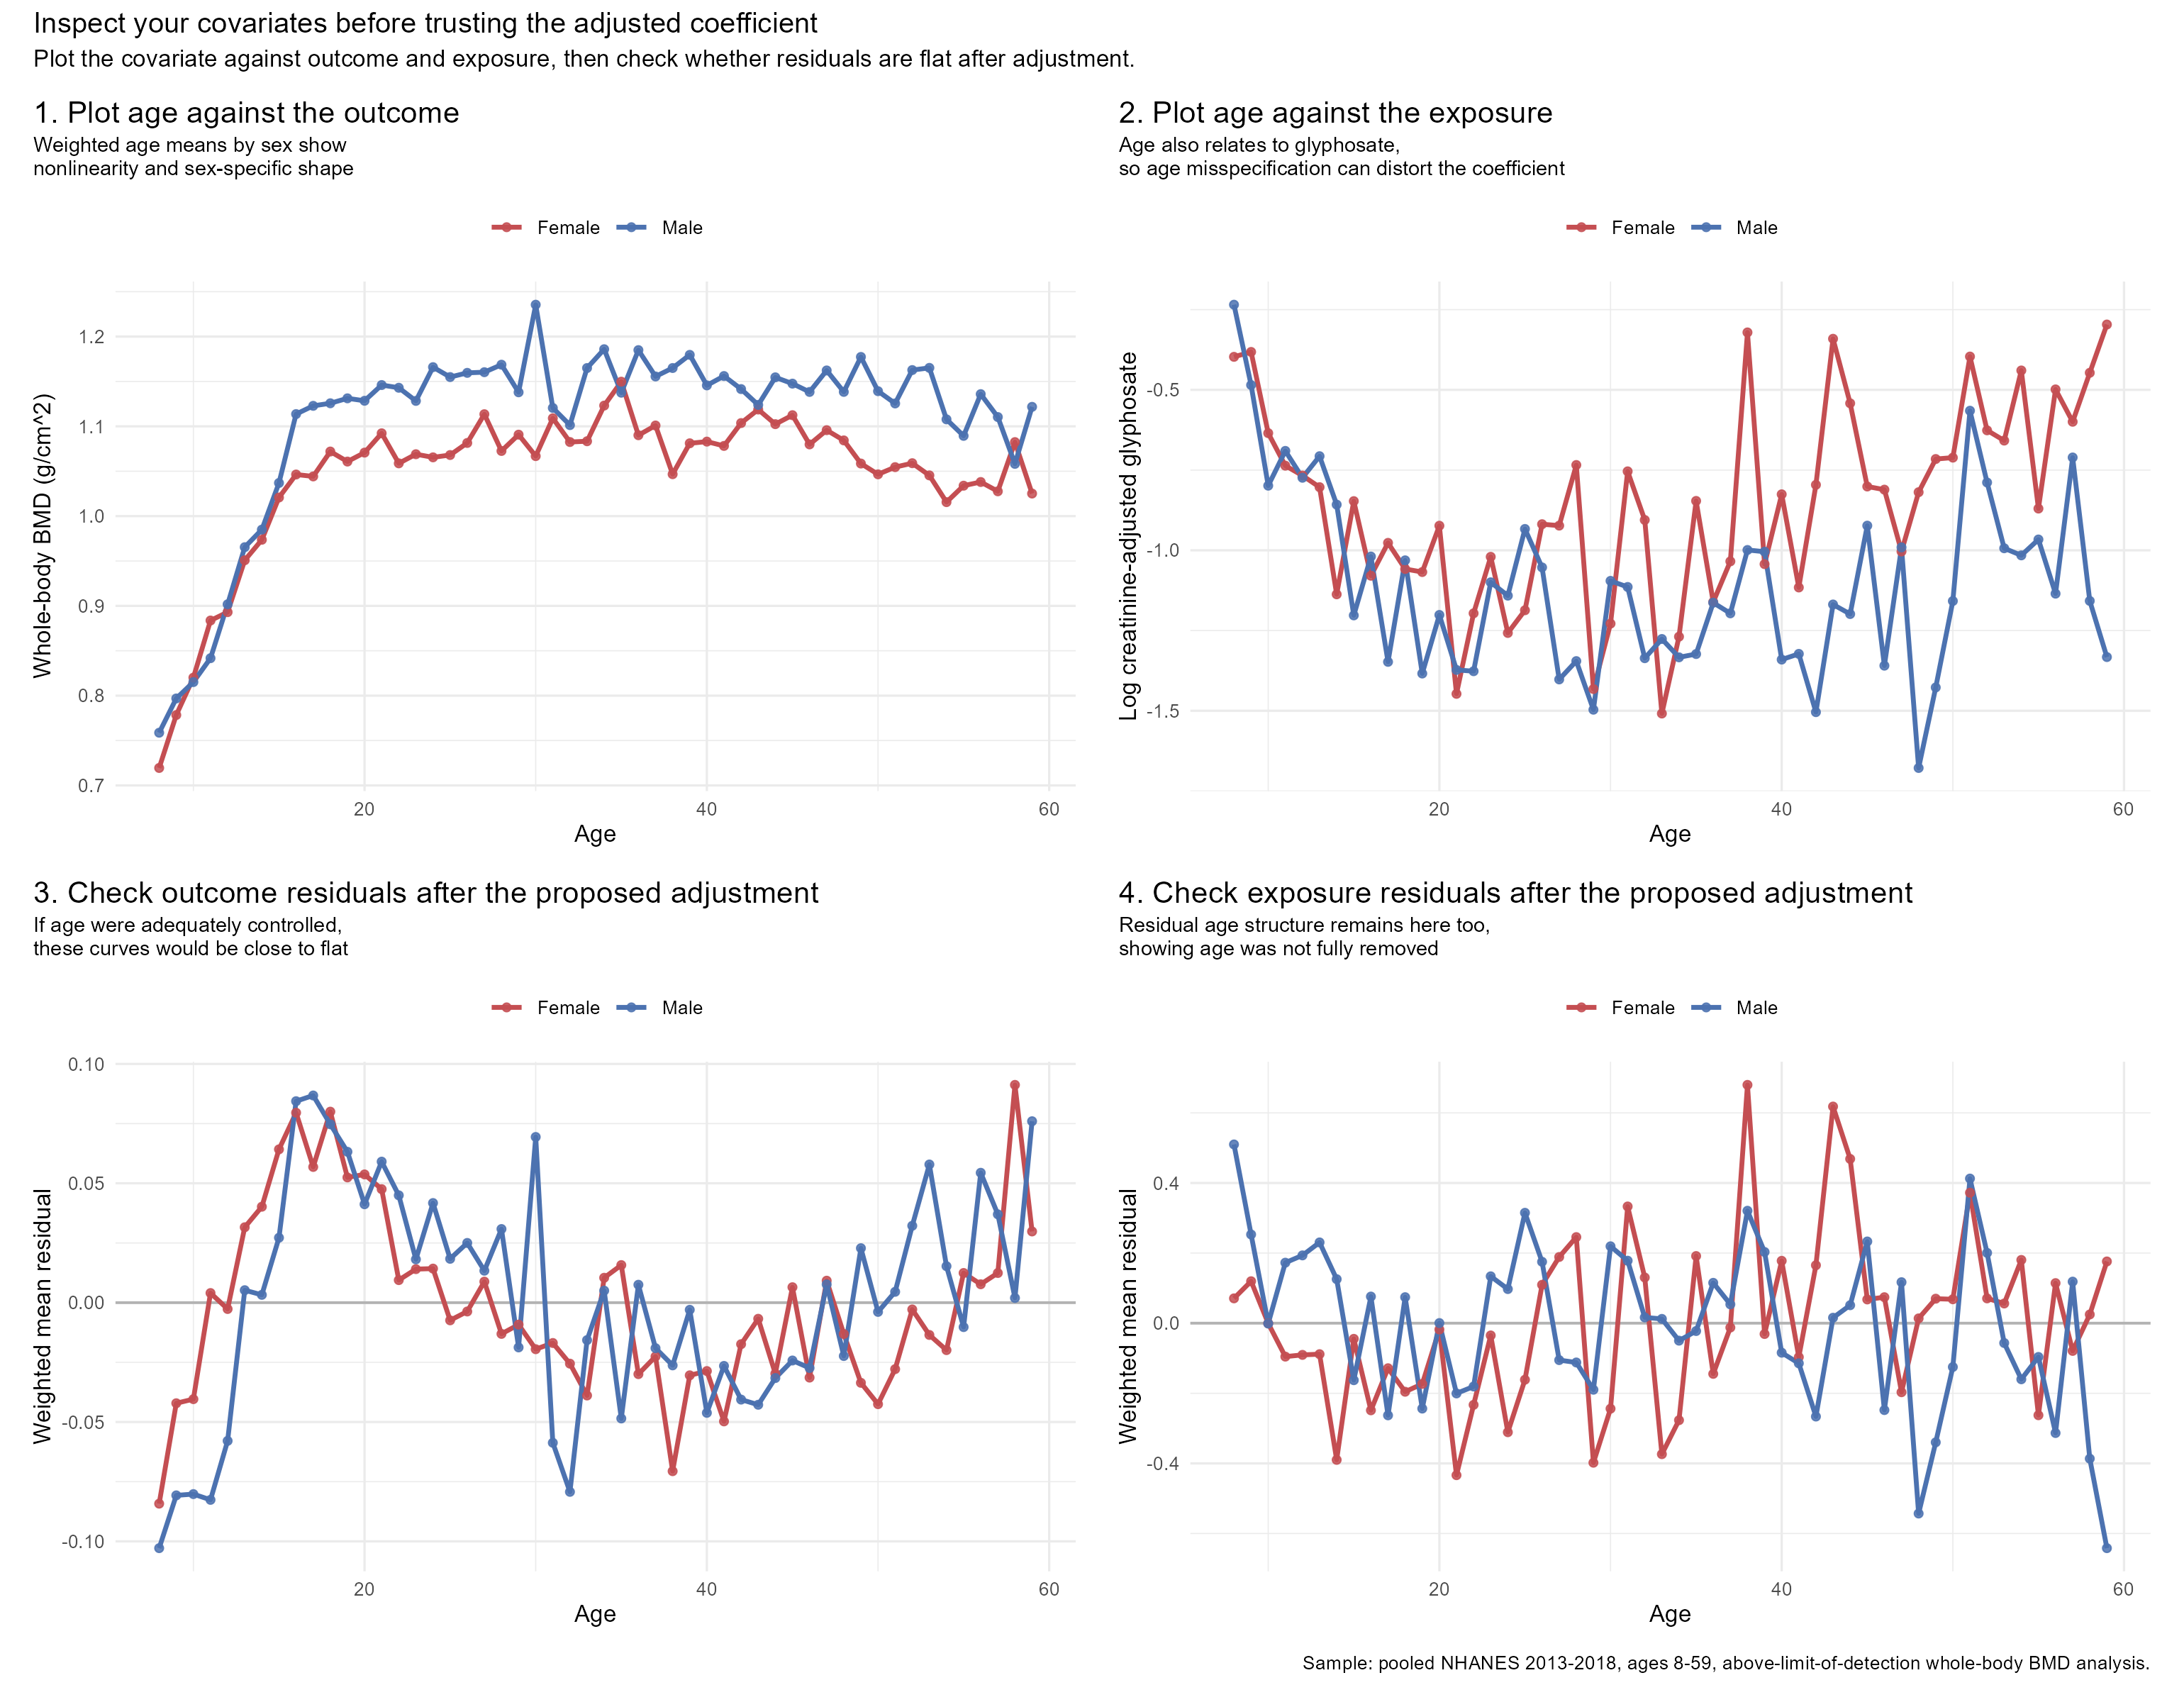
Starting in the top left, look at age versus the outcome and then go to looking at age versus the exposure. There are clearly some relationships here, and those might interfere with your inferences about glyphosate and replace them with ones about age if you don’t adjust for it properly. But, if you take out a quadratic like the original paper I’m using as an example did, you’ll end up with the bottom charts, where not only are the exposure and outcome still related to age, but they’re related in bizarre, noisy ways that also seem to vary by sex, possibly distorting results in another way!
Again, very few people account for this, but anyone can. Plot your results before publishing them; be a little more rigorous by checking if your choices make sense.
These results and more will be made available in a forthcoming paper on covariate adjustment.
In addition to plotting residuals, many models are amenable to nonparametric or pseudo-nonparametric fits. For instance, in this example you could fit a model with a binary (1 or 0) categorical variable for each age, and then plot parameter estimates for these terms. This allows a free shape for the fit on age. This way you can get a shape for age after one fitting, rather than have to iterate over multiple fittings.
C, unfortunately, biologically and mathematically smart biostatisticians are hard to find. It is a bit like the proverbial Eshet Chayil: "An accomplished woman who can find her? Her value is far beyond pearls. Her husband's heart trusts in her, and he lacks nothing..."
If I instead of RFK jr were running the Health Department overseeing CDC and NIH, I would make sure that at least 5% of the grant money were going to biostatistics and nowhere else, and make a complementary demand on the university overheads. Judging from my experience at a premier research university getting good quality biostatistics expertise is not easy.