
Against Attribution Studies
I'm tired of them, you're tired of them. Let's just not do them anymore.

This was a timed post. The way these work is that if it takes me more than an hour to complete the post, an applet that I made deletes everything I’ve written so far and I abandon the post. You can find my previous timed post here.
An “attribution study” is the name I’ve given to studies that purport to provide estimates of important real-world quantities through extrapolations from estimates in other, uninformative studies. There are a lot of these papers and they often come with conclusions like ‘Gas stoves responsible for 13% of American asthma’, ‘68,000 die each year due to health insurer denials’, ‘DOGE killed a million billion Africans with its program cuts’.


This style of study is not inherently bad. There are ways to do it right, but they require more effort than multiplying what are oftentimes pretty random numbers together. I’ll walk through the example from that tweet, the claim that “68,000 excess deaths per year… can be attributed to people who delay or avoid care because they lack health insurance.”

The source for the 68,000 death claim is Galvani et al. (2020), a paper in The Lancet that does, indeed, claim that “ensuring health-care access for all Americans would save more than 68 000 lives and 1.73 million life-years every year compared with the status quo.” Read that carefully and you’ll notice it’s not quite the same claim that was made on Twitter; to get anywhere, we have to be generous in treating this as commensurable to the tweeted claim about people dying from delayed or avoided care. But, if we grant that the claims are the same, we can move on to the big reason why they’re invalid: the methods. Here’s what the study did:
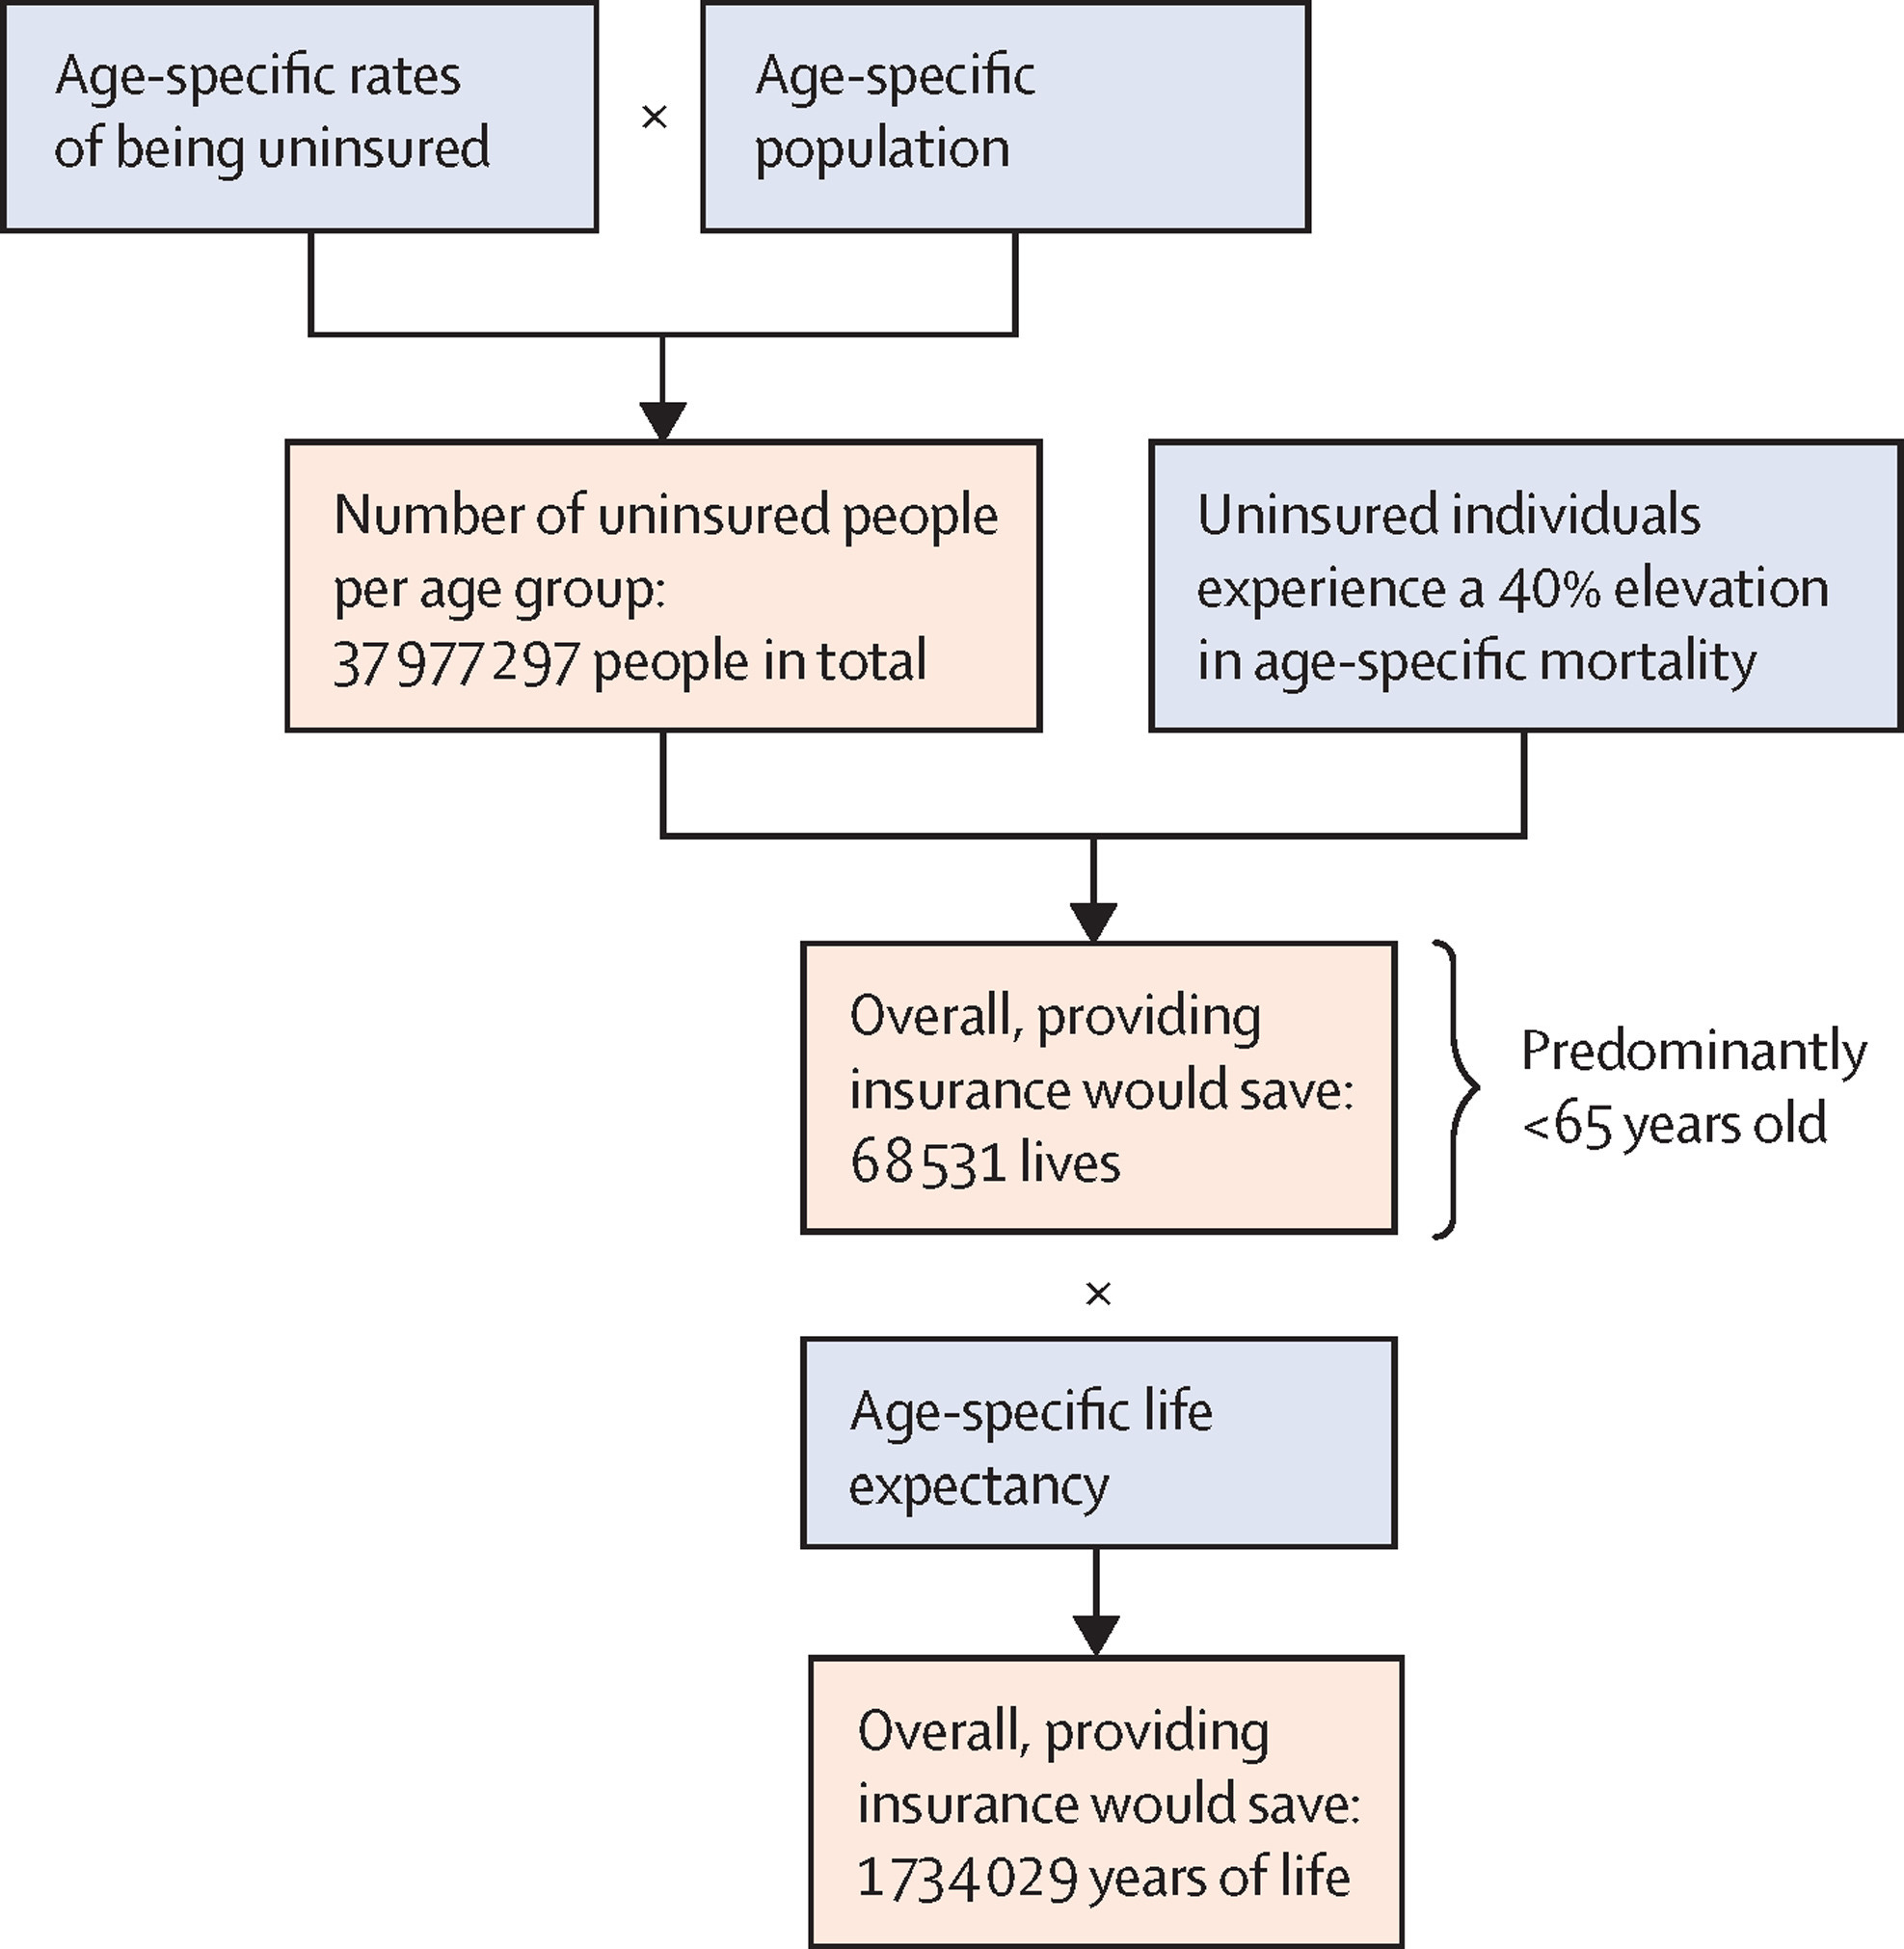
Galvani et al. took age-specific rates of being uninsured, multiplied them by the size of the population at those ages, and reasoned that, if that group had a 40% lower age-specific mortality rate, it would have had 68,531 fewer deaths. Thus, they conclude, expanding insurance coverage would have saved those roughly 68,000 lives.
The first issue with this is that the gap between the uninsured and insured is not necessarily due to the lack of insurance. It could be due to factors associated with not having insurance, like living on the streets, being schizophrenic, being poor, and so on. The second issue with this is that the gap is not reliably estimated. One of the hints of this comes from the author list of the source study: two of the authors are behind the infamous fake healthcare administration costs graph that you might’ve seen making the rounds on X, Instagram, Facebook, Reddit, etc.

The source study used the NHANES III, which is, coincidentally, a dataset that I’ve used for several of my most recent articles. The authors excluded Medicare, Medicaid, and VA/CHAMPUS recipients1 and adjusted for age2, sex, race, income, education, self- and physician-rated health status, body mass index, leisure exercise, smoking, and regular alcohol use and found that after those controls, the uninsured were 40% more likely to die. But what if we do a more extensive control strategy, like what I did in my articles on seed oils, ultraprocessed foods, and ice cream? The mortality differential collapses.
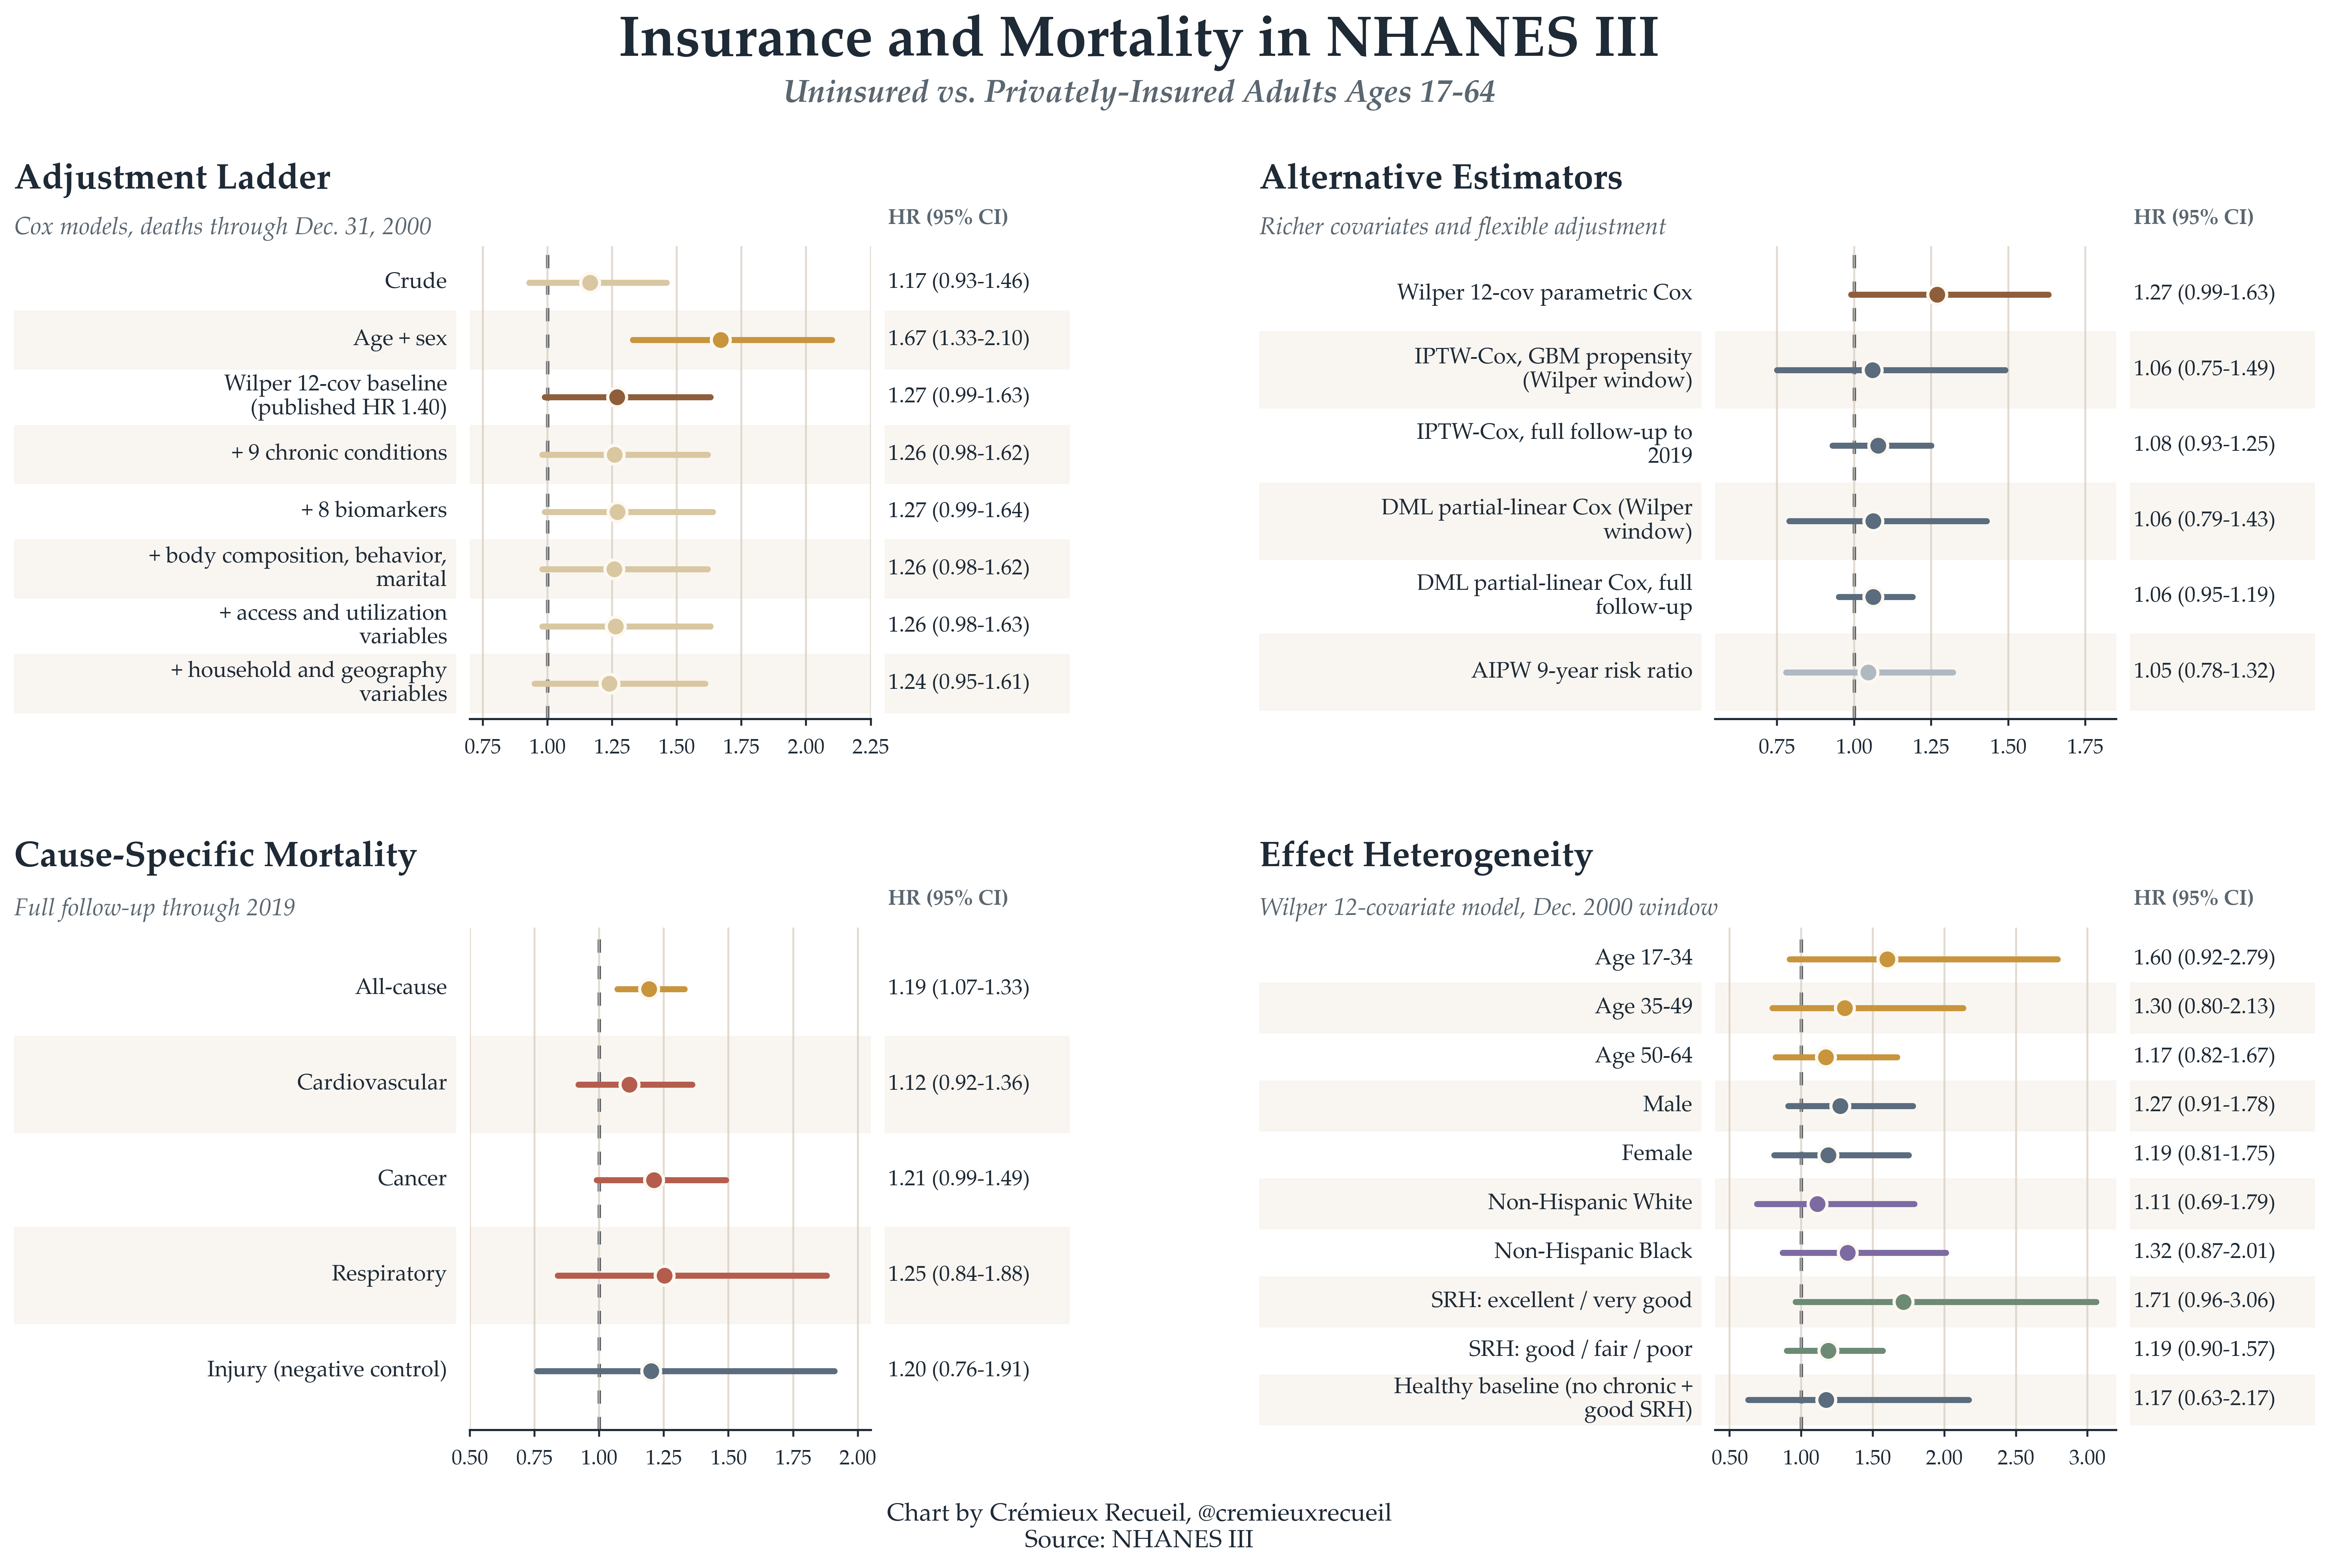
Moreover, if we use more waves of NHANES data or years in the mortality file, it also collapses and sometimes reverses, even without more extensive controls. These adjusted results are not causally informative per se. But, what they do tell us is that the estimated 40% uninsured age-specific mortality delta is not so certain, and not so easy to attribute to insurance. In fact, we can show this in a more serious way by looking at other ways that the insured and uninsured differ. For example, the uninsured are fatter, shorter, less likely to be White, and their diets differ in a number of pretty significant ways. As another negative control, they’re just as likely to die from accidents—which the medical system is generally not responsible for—as they are in general. We can’t attribute these findings to not having insurance coverage. Even by refusing to dichotomize education, letting drinkers report any number of drinks rather than at most 6, and extending the follow-up, the mortality gap shrinks a lot.3
Other studies have looked at the differences in mortality between the insured and uninsured, and they tend to agree with what I’ve found, that there is a lot of confounding to the relationship between insurance status and everything else. But we don’t even need to keep referring to cohort studies. We do have causally informative work that we can cite to get at this question.
A number of these were discussed during the Hanson debate on healthcare utility over on Scott Alexander’s blog Astral Codex Ten. The gist of the studies where people were freely provided with insurance is that mortality was not meaningfully affected, and what little evidence there was for any effect was marginally significant. That means no deaths to attribute to insurance, but, we have to also note that those studies were underpowered to detect small effects, so those might still be on the table. The study of letters sent out by the IRS reminding people to get insured had more power and found a small, but significant effect, where it would take 1,587 people getting health insurance to save one life in the two years following getting insured, with no effect among children and young adults.

What happens if we attempt to re-estimate the original 68,000 number given everything we now know about it? Since the hazard ratio to use is so close to zero, the number of deaths that we can attribute to this excessively broad definition of ‘deaths from delay or denial of care’ is also nearly zero.
We likely won’t ever have a good estimate of the ‘true’ number of people who die from denial or delay of medical care, except that it is small. And it must be this way given the structure of mortality in the population: the overwhelming majority of deaths happen in old age, when there’s government-provided insurance; via EMTALA is is illegal to deny emergency care; and most other deaths among the young are due to things that are outside of the control of the medical system! Our health system is obviously not set up to deny people to death; there is no serious argument that it is.
But this is neither here nor there. The issue for this article is this sort of study, where dubious numbers are selected to promote some sort of narrative that they can hardly support. A previous instance of this that I dealt with some three years ago had to do with gas stoves. A study came out that purported to show that almost 13% of the asthma in America was due to gas stove exposure, but the estimate was based off of a deeply flawed meta-analysis. I redid the meta-analysis and the effect shrank. I then found that a study that had a larger sample than the entire literature up to that point found that there was no significant effect whatsoever, so the estimate ought to be zero.

Despite the gas stove study’s flaws, it was acclaimed. And, as with the Galvani et al. paper, the authors were clearly on a mission: they work for a company with the goal of getting rid of gas stoves! And they’re not alone. Consider the following studies:
Galea et al. attributed 245,000 deaths in 2000 to low education, 176,000 to racial segregation, 162,000 to low social support, 133,000 to individual-level poverty, and 119,000 to income inequality, with a further 39,000 to area-level poverty—an unbelievable 37% of all the deaths, which was obviously not true given subsequent changes in these variables.
Krueger et al. attributed 145,243 deaths in 2010 to people having less than a high school degree (vs. a high school degree), 110,068 deaths to having some college experience rather than graduating, and 554,525 deaths to having anything less than a baccalaureate degree. Mind you, this obviously errant conclusion doesn’t even hold if you use more extensive controls in their dataset (the same one I used in this article).
Brady, Kohler and Zheng attributed 183,003 deaths in 2019 to current poverty and 295,431 deaths to cumulative poverty. They did this in the Panel Study of Income Dynamics so, as with the previous study, we can be sure it doesn’t hold up to using more extensive controls.
Avanceña et al. argued that a universal basic income of $12,000 a year would save between 42,000 and 104,000 deaths annually, with a negative income tax saving 19,000 to 67,000.
Lee et al. argued that physical inactivity caused 9% of premature mortality worldwide, amounting to 5.3 million deaths in 2008. Similarly, Rezende et al. argued that sitting was responsible for 3.8% of all deaths in 2015 and Singh et al. claimed that sugary beverages were responsible for 184,000 deaths worldwide in 2010.
Makary and Daniel claimed that medical error was the third leading cause of death in America.
Bor et al. claimed that police killings of unarmed Black American caused the Black population to suffer 55 million poor mental health days.
What these studies do is fundamentally problematic from a scientific perspective. They take estimates of exposure effects that are only in a scant few cases causally identified—implying that we’re sure they represent an actual effect of something on something else rather than a mere association—, and they make these potentially non-causal estimates appear as though they’re causal by attributing some number of deaths, disease cases, or whatever else to them. They contain the usually unstated argument that differences between identifiable groups must be due to the things those groups are defined by, like minimum wage recipients having higher mortality than salaried workers because of their lower wages. These results are mere reflections of their assumptions and they cannot stand.4
End the blight by joining me in not publishing, supporting, or listening to the results of un-rigorous, non-causal attribution studies.5 We deserve something a little better.
This is, arguably, a very bad idea. These people are insured. They were excluded because, oftentimes, to join those programs, you have to have qualifying bad health. But I don’t see why this is a reason to actually exclude them. They are insured, after all, so cutting them out just biases the conclusion in favor of a larger gap between insured and uninsured. Keeping them in, the crude association is a hazard ratio of 0.77 (0.70-0.84)—the inverse of what Wilper et al. found! Moreover, using their controls doesn’t reverse this, it just produces an almost perfectly null (= 1) estimate).
Clearly this unwarranted exclusion is the critical error that explains Wilper et al.’s results.
Not that it really matters, but the authors incorrectly adjusted for age by doing linear adjustment. I used a spline, as in my previous analyses using the NHANES. This is the superior decision, as mortality risk is obviously nonlinear in age. The residual error with their approach is comparatively enormous.
Yes, this is tautological in the limit and many people switch into Medicare coverage if we do this. It’s still revealing because it tells us about how the treatment of the sample, the years covered, etc. materially alters the projected risk.
Another important thing to note is that coverage has increased while youth mortality has increased since the Wilper et al. study was published, even just looking at 2010-19 and cutting off the COVID years. This is obviously not reassuring for any projections based on their numbers.
Unless peer review seriously fails—which it often does—then the conclusions people reach by taking estimates from other studies and extrapolating like this shouldn’t even be publishable alongside claims that the estimates are causally informative in cases when they are not. You practically have to transfer them to a new study to get them published, which still means peer reviewers and editors are negligent, just in a less direct, more excusable way.
Rigorous ones are fine. They are just rare and they do not look like the ones I cited which are, unfortunately, popular online and thus powerful legitimizers for people who want to support their bad opinions in online discourse.