

Today’s post is brought to you by my sponsor, Mechanize. They’re hiring junior software engineers at $300K/year base salary.
I often see people suggesting that there are countries that are richer than the U.S. This is true if we include wealthy micronations like Monaco or Liechtenstein; it is not true if we look at ‘real’ countries. This fact is sometimes obscured, however, by problematically inflated GDP figures for ‘real’ countries that are tax havens—such as Singapore, Switzerland, and Ireland—, and countries with extraordinary levels of inequality—like Qatar or the United Arab Emirates. But we can overcome these issues.
First, we have to figure out what to measure. The answer is not GDP per capita. Let’s ascend the ladder of comparisons!
GDP Per Capita: This is our familiar starting point.
GDP Per Capita, PPP: This is GDP per capita, but it also adjusts for price levels between countries. The adjustment is required because a dollar buys a different amount in different places. For America, rungs 1 and 2 are the same.
Net National Income Per Capita: This is like GDP Per Capita PPP, but it adjusts to account for the reality that capital wears out and some income belongs to foreigners.
Final Consumption Per Capita: This is actually what people consume, which is what their quality of life is based on in the immediate term. This penalizes thrifting.
Actual Individual Consumption:1 This is like final consumption per capita, except it accounts for the fact that some consumption is done collectively, and it uses consumption prices to promote comparability, too. This also counts out the things that we cannot attribute identifiably to people, like spending on defense and police, and it makes stuff like a publicly- and privately-funded hip replacement both get counted similarly, as the same sort of consumption.
And here’s where things get debatable:
Median AIC: A mean is not a typical person; rather, it’s distorted by outliers.
Low-Percentile AIC: A median is not a poor person, whose lives we’re interested in.
High-Percentile AIC: A median is not a rich person, whose lives we’re interested in.
And there are also some things we definitely can’t do in international comparisons, which I’ll return to below. For now, let’s look at the rankings: how rich is America relative to other countries? The answer is: quite! It doesn’t have the richest poor people, but it does have the richest people at the 10th percentile of the consumption distribution and beyond.2 In other words, for most people, America is richer than anywhere else.
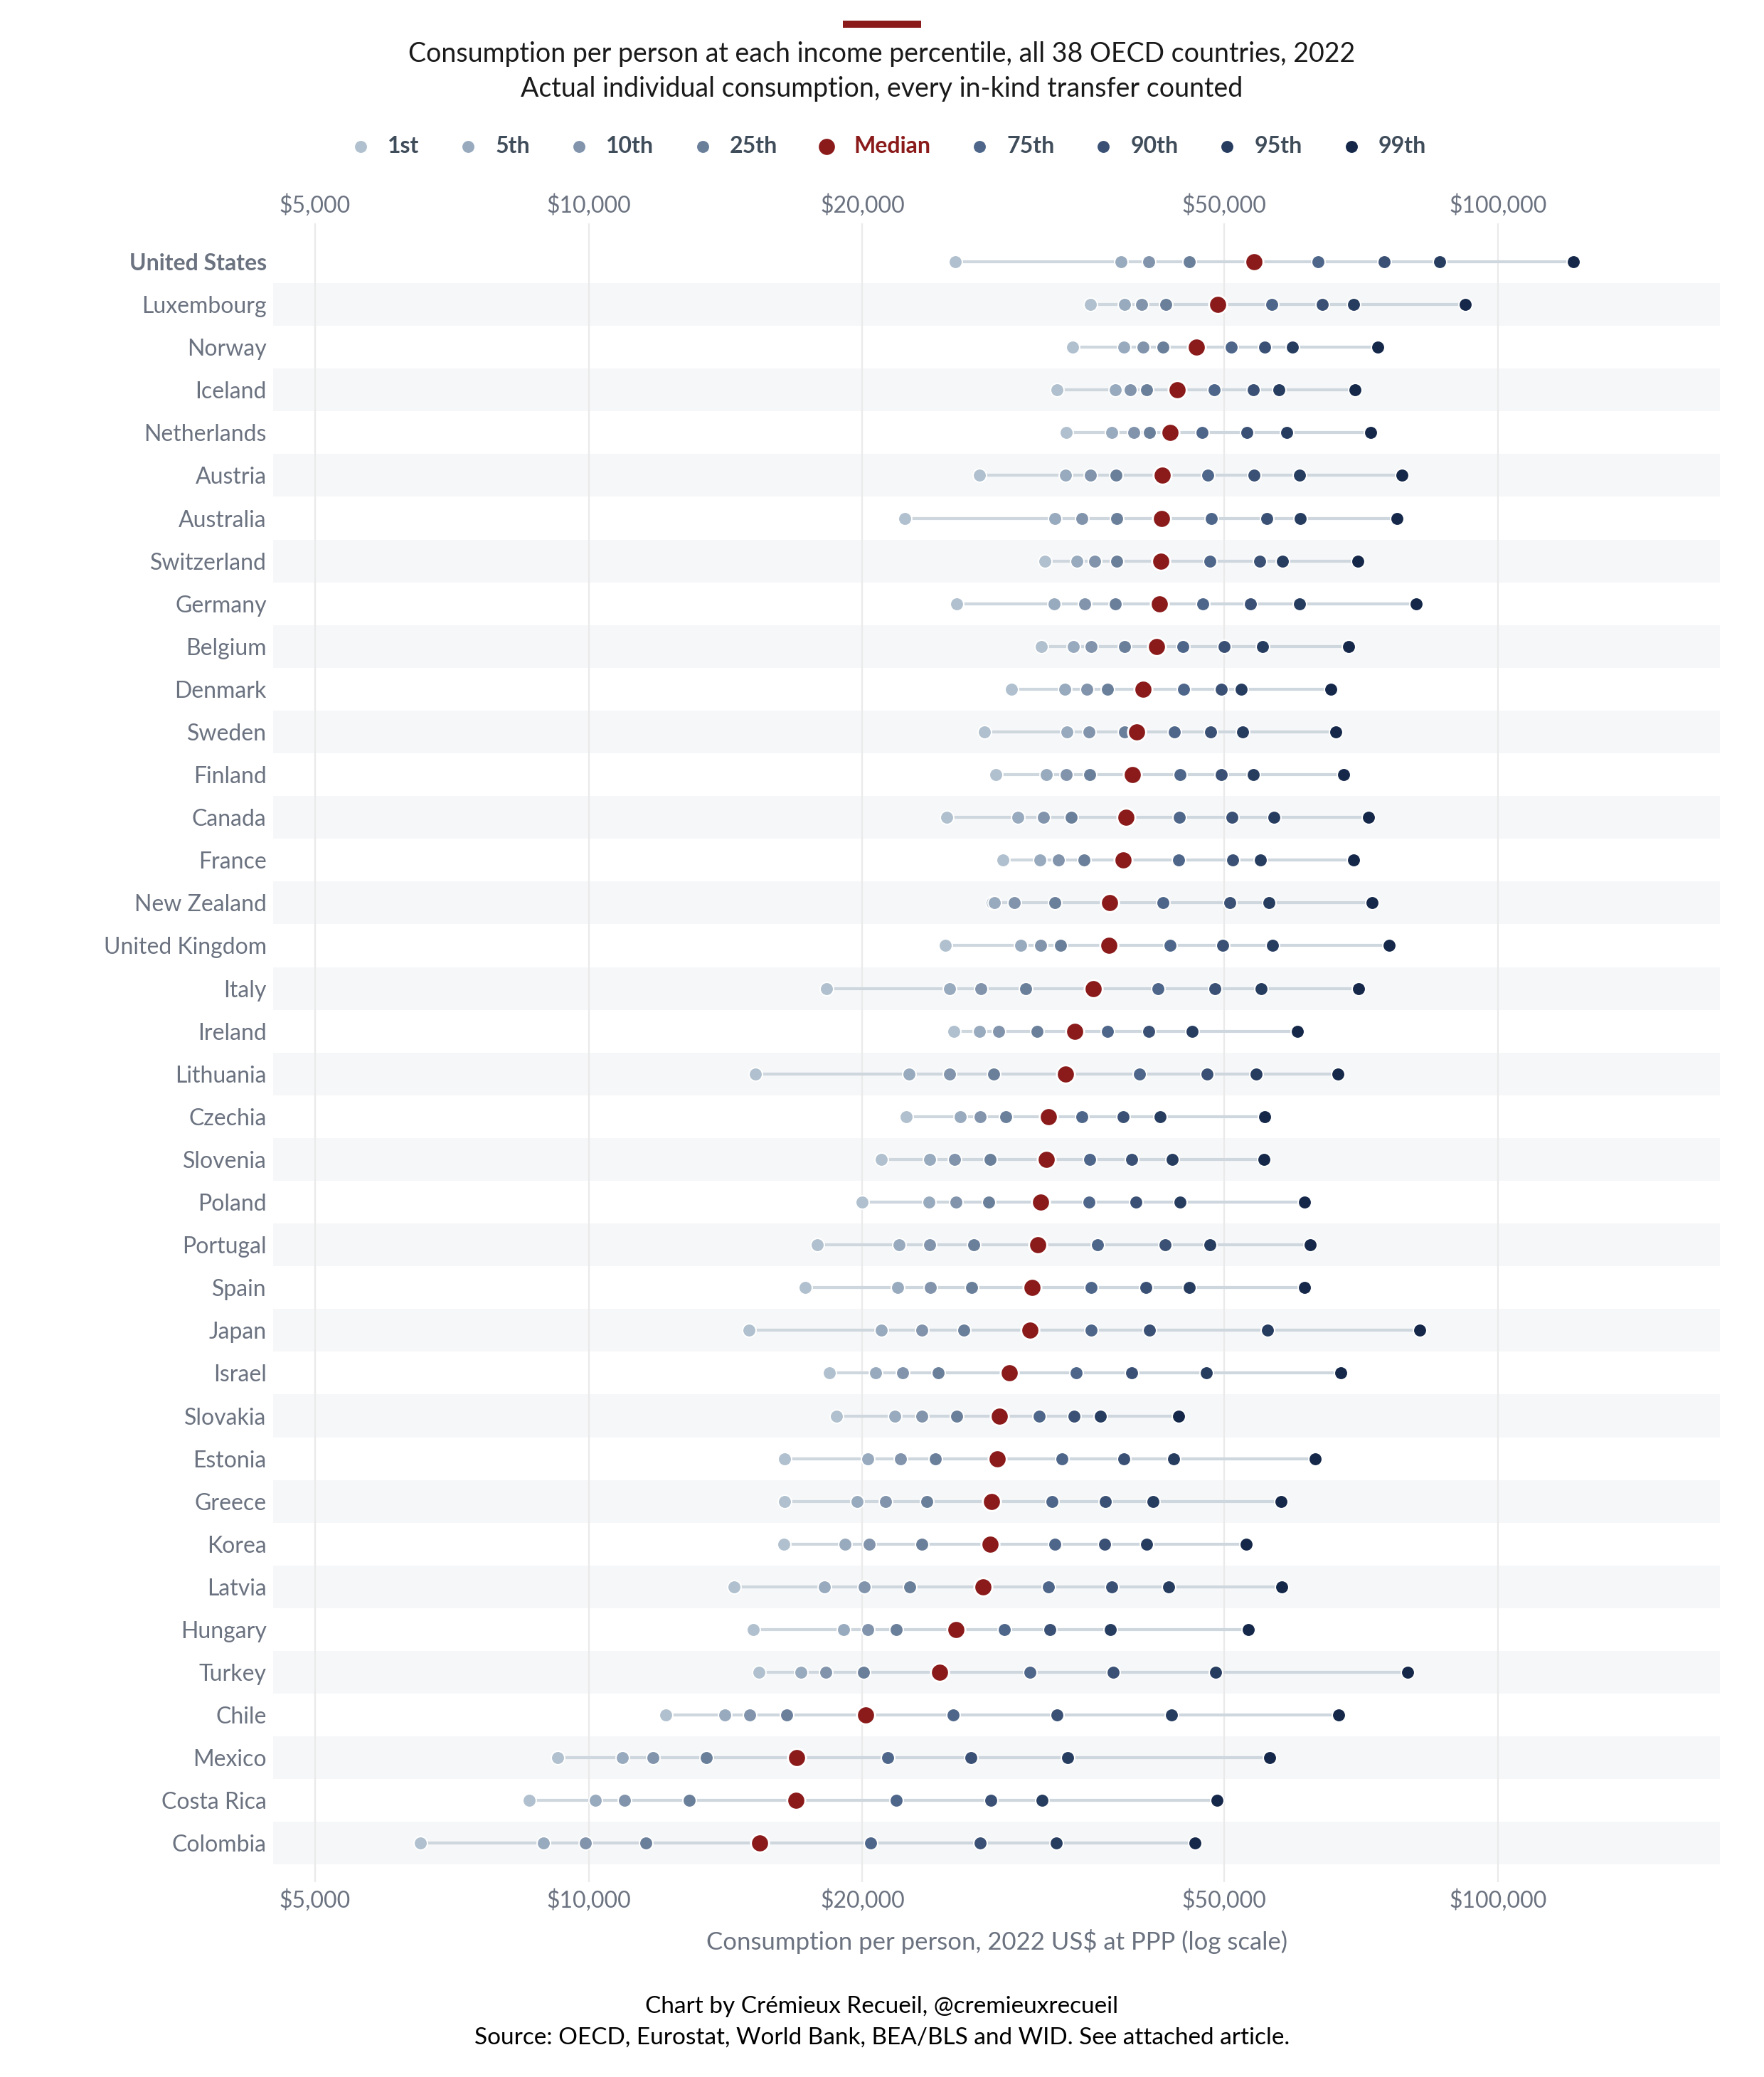
Common Failure Modes
You do not want to compare countries in terms of consumption per hour worked without making substantial adjustments. There are two main reasons for this.
The first and most important is that hours worked are endogenous, for multiple reasons. Firstly, there are income effects on labor supply such that richer countries buy leisure, meaning that hours per capita tend to fall as consumption rises, leading mechanically to inflation. Secondly, there are tax and transfer wedges that shift the labor-leisure margin independently of productivity.3 Third, non-employment isn’t leisure. For example, Americans and Western Europeans spend similar amounts of time on leisure, but Americans spend relatively more time doing market-remunerated work rather than doing work at home. Unemployment, being on disability, and being a discouraged worker are all things that cut into hours, and if a country boosted those, it would raise consumption per hour worked by putting people out of work, even though that’s not good for welfare. Finally, there’s the issue of selection: if the least-productive workers are the ones outside employment, the average worker is mechanically more productive.
The other big issue beyond endogeneity is that measures of hours worked are not comparable between countries, without putting in a lot of work. Consider the employment-to-population ratios for different countries in the OECD. For the U.S., it’s 0.5, for Germany it’s 0.545, for South Korea it’s 0.544, for Italy it’s 0.433, and for Luxembourg, it’s 0.765. Why is Luxembourg so extreme? Well, that’s because roughly half of its workforce are Belgian commuters who show up in the denominator but not the numerator. This is why I dropped it and Switzerland (0.591) when talking about consumption per hour. Similarly, it’s dubious to compare countries like South Korea and the Netherlands (0.565) given that their similar ratios come with very different hours per worker.
An even more major part of the comparability issue is culture. Turkey is an extreme example. Turkey has a low employment-to-population ratio for the OECD, in part because women’s market participation is low. Thus, because women—and in particular the most marginal laborers among women—don’t appear as represented there as in, say, Western Europe or the United States, consumption per hour worked at the household level can mechanically increase if it consumes at a decent rate.
The OECD is aware of these issues and provides an explicit warning not to compare countries in terms of its hours worked measure (levels). Rather, they would like the hours worked measure to be used to assess trends over time for particular countries or sensible groupings of countries. 4
It is also common to fail at doing international comparisons over time by using current PPPs instead of constant PPPs.5 With constant PPPs, you get a measure of real growth because it provides you with details on the change in the volume of a constant set of things which are being produced. However, accounting with constant prices can also overvalue things that are initially scarce after you start producing lots of them (e.g., software, a new fruit cultivar), so there’s room to err on either side with intertemporal comparisons. Know what you want to measure before measuring.
It is exceptionally unwise to chalk up a country’s consumption to mere trade deficits. Remember what a ‘trade deficit’ is: a current account surplus. If you have a trade deficit, that implies that your country takes in more from trade, investment, and transfers, than it puts out. This is not a bad thing, even though it’s widely perceived to be that way. Stated plainly, I actually think it’s hard to see America’s trade deficit as a bad thing, since what it means is that people are investing in America, which allows Americans to consume relatively more than people in other countries.
If we were to eliminate America’s deficit in isolation, then America’s relative position in terms of consumption is largely preserved, but its poorest citizens become notably worse off. America’s relative gap with other countries shifts from 13th-place for the 1st percentile to 15th place, from 3rd to 5th for the 5th percentile, from 1st to 4th for the 10th percentile, while the other percentiles explored above retain 1st-place positioning. The median gap with the population-weighted EU15 declines by almost 14%.
But is this meaningful? It clearly isn’t. If America closed its trade deficit overnight, it would radically disrupt the global economy and imperil the consumption not just of itself, but of everyone, everywhere. For America, the only ways to reduce the trade deficit are to cut down on investment—leading to sizable steady-state output loss—or to increase savings—mechanically lowering consumption for itself and indirectly lowering consumption for economies that export to it! For the rest of the world, since America absorbs 55% of all current account deficits, that saving has to be lent somewhere else at a lower rate, or simply not saved, and either way creditors end up earning less.
Chalking up America’s heightened consumption to a trade deficit is wrong on the numbers and it doesn’t even make a lot of sense. It is essentially arguing that America is ‘only so rich because its institutions are reliable enough that everyone wants to put their money there because there’s so much awesome stuff to invest in!’ OK! That seems like a great thing for America.
Shocks are bad! I’ve used 2022 data because it’s the most complete year. Unfortunately, this means that Norway’s consumption is inflated because of the gas shock that took place in that year, erroneously pushing it up considerably. This can happen, and is why the best picture incorporates multiple years of data.
Don’t randomly count out consumption you dislike. People often like to make arguments like ‘America only consumes more because it has a horribly expensive healthcare system.’ This is manifestly untrue, but people say it. Why? Ultimately, because America does spend a lot on healthcare. But let’s go over two things (which are maybe three things if you squint).
First, counting out healthcare, America still leads. Removing health spending in its entirety, America’s 1st percentile rank moves to 15th from 13th, its 5th percentile moves to 4th from 3rd, and its 10th percentile moves to 4th from 1st. Every other rank and most of the gap remain. Cutting out particular parts of healthcare like health administration, or making prices equivalent has smaller effects than just counting all of healthcare out, and the administration point is even being overly fair to comparator countries because America counts things like advertising in it and it doesn’t shift things like long-term care substantially into social spending or put scheme administration into collective consumption outside health measures. This is a comparability issue that’s slanted against America.6 (The conclusion also nearly persists if we also count away America’s trade deficit in isolation. America’s median goes to 2nd place behind Luxembourg by 0.2% if we do that.)
Second, this is just denigrating people’s spending choices. People want to spend on healthcare. It is a superior good for a society. As affluence grows, so does our ability and desire to spend, and so does the prevalence of diseases of affluence, so richer countries like the U.S. spend larger shares of their income on healthcare. This is true of other countries as well, and when there is an abrogation from this apparent reality, it is usually not lasting, as in the cases of the U.K.—which kept its spending out of line with its wealth by making healthcare practically unavailable—and Singapore—which had a high out-of-pocket share until people found it intolerable and moved it towards the norm for a country of its wealth.
Counting out healthcare spending is as arbitrary as counting out any form of spending, and it makes little sense to cut it out. Doing so simply unfairly penalizes richer countries. This is obviously the case, since everyone ‘wants’ to spend more on healthcare in the sense that as countries get richer, they will. Saying particular parts of the American healthcare system can and should be cut is more convincing, but rests on speculation about optimal governance, and the usual thing people suggest for America is single-payer, which means sacrificing consumer optionality, among other things. That is itself a notable tradeoff.
There are plenty of other common pitfalls in making cross-national comparisons, but I feel like I’ve listed enough here for now. If any notable additional examples come up, I’ll address them.7

This was a timed post. The way these work is that if it takes me more than an hour to complete the post, an applet that I made deletes everything I’ve written so far and I abandon the post. You can find my previous timed post here.
A message from my sponsor, Mechanize:
We’re hiring software engineers to build environments and evals that frontier AI labs use to train coding agents.
To get a better sense of the work we do, you can check out GBA Eval, where we had models build Game Boy Advance emulators from scratch and scored their performance.
Base pay starts at $300K/year for junior software engineers, with more for senior roles, plus equity and performance bonuses. Apply here.
The goal is to think of wealth in utility terms rather than $currency.
Two things:
First: There are more in-depth ways to model this if more data is available, but most countries don’t report enough to do it, and doing this doesn’t affect the rank-order very much: America still sits on top, Luxembourg is still very rich, Switzerland remains quite rich, Sub-Saharan Africa remains poor, etc.
Second: People also want to move to the U.S., but those people are often those who would, at least after some time, likely be higher in the income distributions of their own countries and in the U.S. Immigration is a great way to see that people want to move to the U.S. because it is more prosperous even than Western Europe, but it somewhat overstates America’s general wealthiness in those sorts of comparisons, because it makes America’s inequality a boon, given that skilled immigrants will often benefit from that personally.
These can create different margins at which there are diminishing returns to more work. One implication of these is that if, say, Americans worked less, then Americans would wind up earning more per hour.
In any case, America’s rankings per hour worked at the 1st, 5th, 10th, 25th, 50th, 75th, 90th, 95th, and 99th percentiles are 15th, 8th, 6th, 3rd, and 1st for all the rest.
This concern actually dovetails with concerns about hours worked. We can see that Americans earn more in total, that they are richer. Adjusting their hours worked, their lead would substantially diminish, even though they are literally richer, regardless of the source, which in this case, is in no small part working more hours. American GDP has also grown above and beyond European GDPs at constant prices in recent decades. For American GDP per person to fall to European levels due to hours worked, during that time Americans would have had to start working relatively more than Europeans. The opposite happened.
Comparability issues are doubly problematic when you have things like certain PPPs being output-based for some countries and input-based for others. This whole area is a complete mess, which is the a plausible part of the explanation for why some pundits think the size of healthcare’s impact is so much larger than it is, and how some people end up double-deducting when they make adjustments for it.
I will not be addressing things like ‘But America has more crime. What’s the deduction for that?’ because it’s not really answerable with available data. It could be substantial, and it’s likely that higher crime and licentiousness in America—which inflates its medical spending and reduces its agglomeration gains—is bad on the margins, but not so much that it overwhelms America’s greater wealth for most. Also, it should be noted, much of Western Europe has more crime than America, it’s just that far less of that is violent crime.
> Why is Luxembourg so extreme? Well, that’s because roughly half of its workforce are Belgian commuters who show up in the denominator but not the numerator.
Other way around? They would be amongst the workers of Luxembourg (numerator) but not amongst the population of Luxembourg (denominator).
I moved from the US to New Zealand (temporarily, mostly to hike), and I am getting paid 1/3rd as much as I had been for the same job. I went from having a one bedroom to myself to living with two flatmates. I think much more about filling up the tank and about grocery prices than I ever had before, and my spending on healthcare is a much higher portion of my income (partly a consequence of my visa status). A medication I am on that is generic and a standard first line treatment in the US and most developed countries is not funded here, so my pharmacy imports it from the US and I pay more for it than it costs without insurance in the US. For a lot of cancers or autoimmune conditions the gold standard treatments are not available here except for the very wealthy.