
Bias in Admissions and Hiring
Why we need more tests and less subjectivity

Bias is a major problem.
American universities have a long history of discrimination on the lines of race, religion, and sex.
Many elite universities used to have quotas to limit the numbers of Jews. These helped universities like the City College of New York to become successful by routing talented and overlooked Jews from more elite colleges and universities, but there’s no doubt it also caused talent to be misallocated and overlooked. Today, some universities continue to use quotas, except the purpose isn’t to bar high-performers, it’s to ensure representation from under-performing groups. Admissions discrimination is particularly marked in places like India and Bangladesh, where meritocracy has been superseded by a quasi-ethnic spoils system.
Employers have and continue to engage in discrimination to this day, advertising their extensive “diversification efforts,” implementing quotas for certain sexes, races, ethnicities, and nationalities, and trying to fill top spots with members of certain groups even though group membership has no job relevance. Billionaires like Mark Cuban even brag openly about illegally considering race as a factor in hiring in flagrant violation of Title VII of the Civil Rights Act.
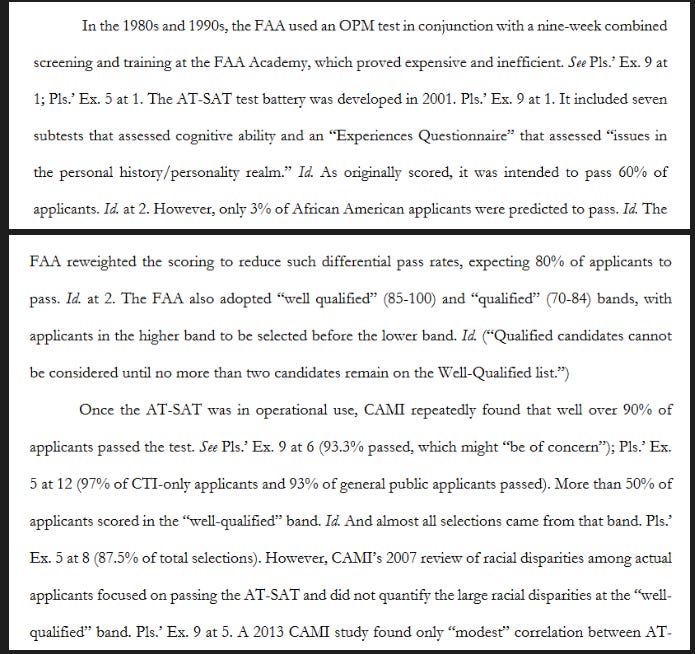
Efforts to discriminate don’t always manifest in official policies or through obvious means, either. For example, journalist @tracewoodgrains recently revived interest in an ongoing suit against the Federal Aviation Administration (FAA) in which there’s clear and copious evidence that, among other things,
the FAA has been tampering with tests to make them worse predictors of performance with the byproduct being higher African American pass rates;1
the National Black Coalition of Federal Aviation Employees was allowed to rig the hiring process for air traffic controllers so they could get more African Americans hired.
After Students for Fair Admissions v. Harvard was decided in favor of the SFFA and explicit racial discrimination in university admissions was banned, many universities made statements effectively stating that they would find ways around the ban through the use of proxy methods of identifying applicants’ races. These statements amount to vows to continue racially discriminating in roundabout ways.
Today, the sorts of surreptitious practices universities are seeking to implement may be the primary ways in which discrimination in admissions and hiring happen.
Attempts to hide discrimination are part of why it is so crucial that we have unbiased means of measuring the abilities and predicting the success of students and employees. Without unbiased measures, we can’t know if someone is introducing bias into the process in order to discriminate against members of whatever groups they may happen to dislike or in favor of whatever groups they happen to want to see more of. Unbiased methods give us a powerful means of checking whether the other parts of selection processes are themselves biased.
Currently, our only unbiased selection method is testing.
I made this point in a recent article on Aporia. The gist of the article is that tests are usually unbiased.2 We’re able to know this because we have methods to empirically examine whether they are biased. When those methods are applied in practice, bias is rare, and when it crops up, it’s usually unpredictable3 and unimpactful.
When bias is tested and found to be absent, a number of important conclusions follow:
Scores can be interpreted in common between groups. In other words, the same things are measured in the same ways in different groups.
Performance differences between groups are driven by the same factors driving performance within groups. This eliminates several potential explanations for group differences, including:
Scenarios in which groups perform differently due to entirely different factors than the ones that explain individual differences within groups. This means vague notions of group-specific “culture” or “history,” or groups being “identical seeds in different soil” are not valid explanations.
Scenarios in which within-group factors are a subset of between-group factors. This means instances where groups are internally homogeneous with respect to some variable like socioeconomic status that explains the differences between the groups.
Scenarios in which the explanatory variables function differently in different groups. This means instances where factors that explain individual differences like access to nutrition have different relationships to individual differences within groups.
Any potentially biasing variables related to group membership are not actually biasing.
The fact that tests are unbiased is why they manage to identify gifted youths from underrepresented groups when teachers and parents do not.4 Unlike tests, teachers and parents are, unfortunately, biased.
Since we generally do not have ways to assess whether particular non-test selection methods are unbiased, they should be considered problematic for three main reasons:
Their interpretations for different groups are opaque.
Without a way to detect bias systematically,5 there hasn’t been a systematic effort to debias them like there has been with tests.
They are often intentionally abused to inject bias into selection processes.
There are many examples to pick from to show these facts. Essays for admissions favor those who can buy essays and those who can be coached to learn or who are reared in the cultural trappings that earn higher scores on these subjectively graded assessments. Requiring research experience for graduate admissions benefits those who had access to labs to work at and who had the resources to do free work during their undergraduate educations.
Letters of recommendation, biographical data, records of experiences, interviews, personality assessments, and even the time and money involved in filling out applications can be biased across groups like race, class, sex, nationality, sexuality, location, and so on and so forth.6 These and more variables involved in selection are often highly unreliable and are frequently in use because they’re biased.
How the Indian Elite Is Made
My favorite problem on how subjectivity is used to discriminate is entitled Making the Elite: Top Jobs, Disparities, and Solutions. It provides an incredibly clear example of how discrimination happens in a novel and unusually well-documented case.
The study involves data from an elite Indian college. Each year, this elite Indian college hosts an on-campus job fair, much like the job fairs hosted at other elite Indian colleges.
At this job fair, U.S. and European multinational companies come out to recruit members of India’s top talent. Because India has a huge population and an incredible level of competitiveness in higher education, these job fairs host an extreme number of highly-talented individuals, so it’s no wonder almost every job on offer at these fairs is in the 99ᵗʰ percentile of entry-level salary in India’s private sector. If you live in the U.S. or Europe and you work in tech, you might have met or even worked alongside some of the people who benefitted from these fairs.
The way the job fair works is straightforward. There are three broadly-defined stages.
Preplacement. In this phase, colleges invite firms to come and recruit prior to June of that year. Between June and midway through August, firms come to visit campuses and to conduct their preplacement talks so they can whip up interest in applying to the positions they’re trying to fill while they gauge interest.
During the preplacement phase, a subset of firms give students who participated in summer internships return offers. In the study’s dataset, fewer than 5% of the graduating cohort accepted such an offer. The remaining more than 95% of the graduating class did participate in the job fair.
In late August, students fill out registration forms to participate in the job fair. In early September, firms bring out employer registration forms for the school’s placement office to distribute among the student body. The forms contain details about available jobs, their compensation packages, and the numbers of slots the firms are trying to fill from the school in question.
This is an important part of why this study is so uniquely suited to identifying discrimination: after employers submit registration forms to the placement office, they are bound to an agreement to fill the number of slots they specified with students from that university and they cannot back out of the agreement. They’re going to get what they asked for. These firms are also bound to the terms of their forms and they cannot deviate from their stated compensation terms. The placement office verifies firms stick to their terms, and if they do not, they can choose to ban them from future job fairs.
The study’s identification gets better, however, because students also cannot negotiate the terms of their employment. There’s no negotiation by students or firms during the placement process and firms weren’t privy to any special information that they could have discriminated on prior to submitting their registration forms. Since anyone at the school can apply, this setup is ideal.
Placement. This is the phase when students start to apply for jobs starting about halfway through September. After this is done, firms make their “first cut” based on skimming through applications to identify reasons to throw them out before they send out invites to students who were selected for additional screening. Cuts are usually made on the basis of characteristics like GPA, major, competition performance, etc., but the paper notes that “conversations with employers suggest that college GPA is one of the main filters used during the application reading round.”
The first step after cuts is testing. Firms conduct written aptitude tests called “technicals,” that often involve coding tests and general aptitude testing. These are generally given online.
After testing comes debates. During debates, groups of thirty to thirty-five students are divided into teams of fifteen to twenty people and are made to discuss non-technical topics with one team assigned to each side of a debate. During these debates, applicants are evaluated on “communication [skills], mannerisms, consensus building [abilities], collegiality, confidence, and teamwork.” In some cases, these debates are for the same positions, and in others they’re for multiple positions. So, for example, Google may conduct a debate among applicants to several different positions simultaneously.
After these increasingly subjective stages comes a stage that is certainly subjective. Between December and January, applicants are personal interviews.
Personal interviews are non-technical and typically unstructured. They are also clearly employee-employer fit interviews rather than truly job relevant ones. We know this because companies like Uber will do the same nontechnical interviews for several job positions with different duties that should not all be bundled into a single interview. Additionally, we can be fairly confident that all or almost all of the interviewers are themselves Indians.
After the completion of the interviews, offers are sent out. Then, students make their job choices and the process of hiring concludes some time in January. Roughly 70% of each graduating cohort ends up with a job as a result of this process.
Aftermarket. From late January through graduation in late July, the placement office helps to facilitate the employment of the remaining roughly 30% of the graduating cohort who wasn’t slated for hiring. Roughly 85% of that 30% or so go on to pursue entrepreneurial careers, advanced degrees, or to take off gap years so they can prepare for civil service or elite MBA examinations. The other 15% find jobs in other firms.
Because the aftermarket recruitment process is so much less standardized than the process that takes place during the job fair, it’s less useful for ascertaining whether there’s been discrimination, so the paper doesn’t focus on it. Before going on, it should be noted that selection into this aftermarket sample or the roughly 5% of students who didn’t take place in the job fair is not meaningfully biasing for the results that follow. In fact, it makes them conservative for reasons I will get to.
Discrimination Against Whom?
In higher education and the public sector, reservation provides members of backwards castes, scheduled castes and tribes, etc. with a large and growing proportion of the admissions and job slots. For example, here are different castes’ shares of central government university and job slots as of 2021:

Despite the privileges afforded to members of disadvantaged castes in the public sector and higher education, they still underperform in the private sector, contributing to the calls to expand reservation to cover that too.
In the private sector, the discrimination is under the table rather than being a matter of official policy, and it tends to flow in the reverse direction, in favor of the castes that don’t benefit from reservation. The targets of discrimination in this study are members of India’s disadvantaged castes.
Documenting the Gaps
The raw earnings gap between disadvantaged caste members and the non-disadvantaged among graduates from this study’s elite college is 23%. After controlling for “pre-college skills, within-college academic performance, previous labor market exposure, and other employer-relevant skills,” the gap is 10%, so it’s still sizable after everything is said and done. Critically, because of how the job fairs are set up, there are no caste differences in pay for identical jobs, so the gap is entirely due to occupational composition differences across castes and those differences are due entirely to differences in the offers made by employers.
Because we know when employers knock applicants out of the job search and the salaries offered in the job fair are non-negotiable, the caste penalty is a simple product of the salary differences in the jobs the groups have left in contention after each stage:
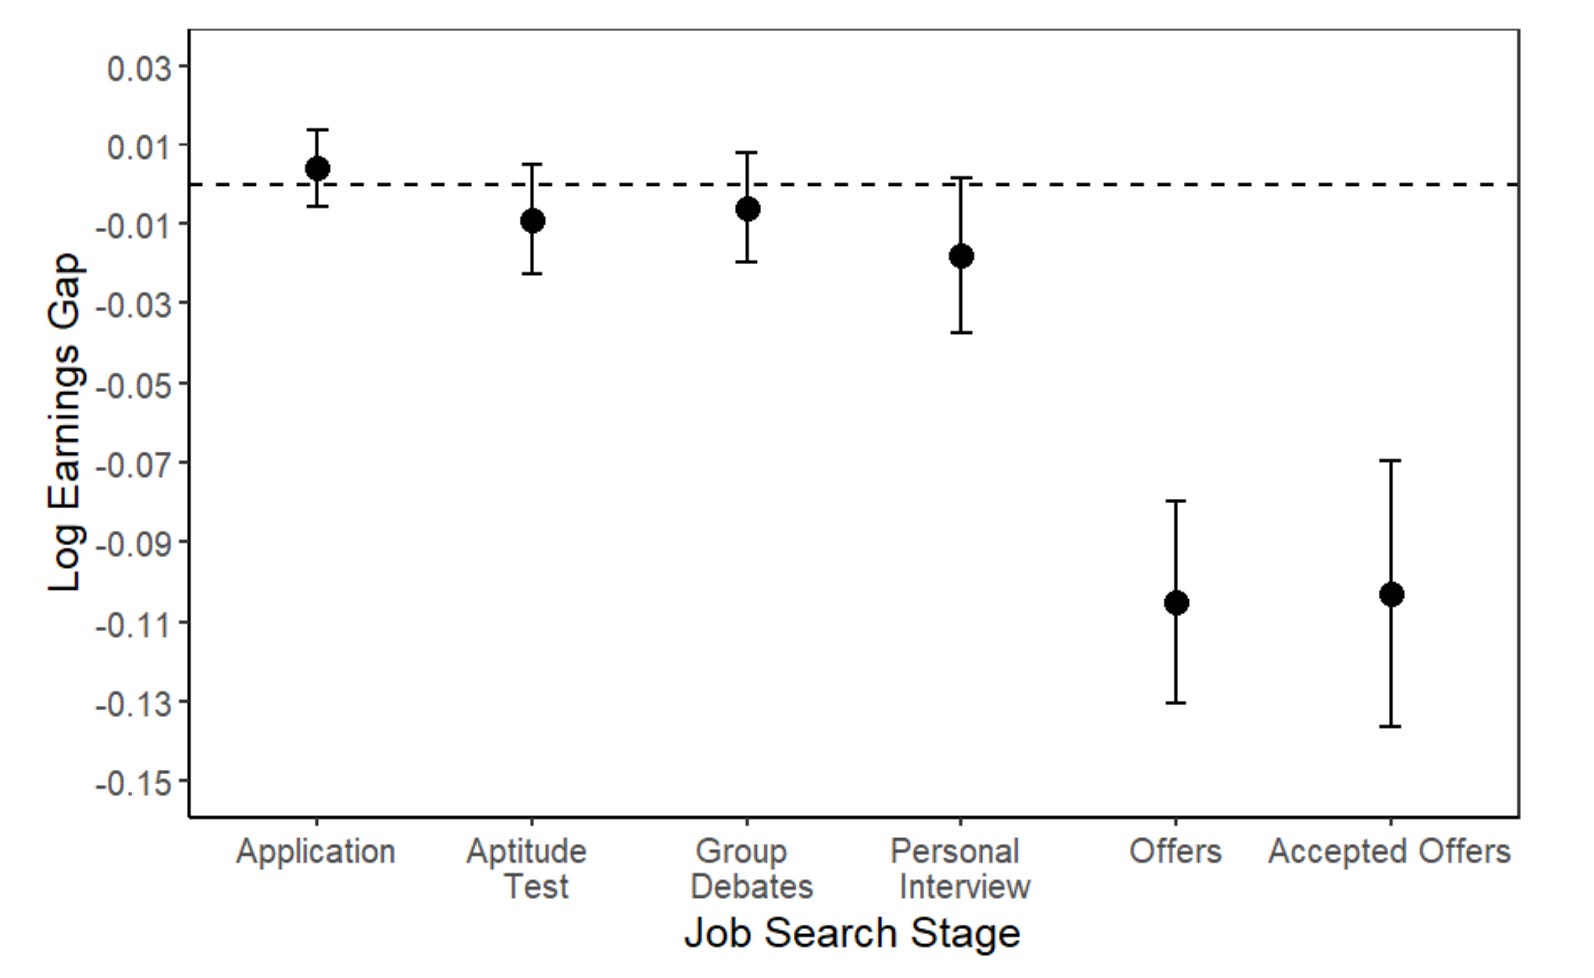
The total 10% penalty to disadvantaged caste members clearly comes into existence between personal interviews and job offers. But this isn’t dispositive yet since employers might have been holding onto resumes until that final stage to make a more informed decision. This alternative theory, however, is not supported by the numbers:

Employers were making cuts the whole way through, it’s just that in the phase where they could be selective with respect to caste, they were. If they wanted to appear fair with respect to caste, these results really just don’t make sense anyway. If that were it, why wouldn’t they simply hire disadvantaged caste members? What they’re doing instead is eliminating them in the hidden stage when caste is made known and prior to the publicly-revealed job offer stage. We can see the impact of caste revelation in the interview stage more explicitly by looking at each stage separately.
Application reading? Balanced:

Cognitive testing? Balanced:

Debates? Balanced:
The first stage where caste is able to be figured out and discriminated on? Unbalanced:
Consistent with discrimination against members of disadvantaged castes, on the job, equally qualified members of disadvantages castes seem to be more productive and are accordingly more likely to be promoted in differently selective jobs and different job settings compared with members of more advantaged castes:

Outside of the top 50% of jobs by selectiveness, this may appear to be a marginal result, but it isn’t, because it really isn’t since it’s conservative. This result is conservative because first job leavers among advantaged castes are more strongly negatively selected than among disadvantaged castes. The differences in on the job performance between discrimination-facing disadvantaged caste members and potentially discrimination-benefitting members of more advantaged castes should be more favorable to the latter group as time goes on but instead, as time advances, it’s the disadvantaged caste members who earn more promotions. The earnings gap as a whole is conservative as well for the simple reason that students omitted from the analytic sample are much more negatively selected with respect to GPAs if they came from disadvantaged castes, while earnings are increasing in GPA.
We also know the likely reason that disadvantaged caste members are able to be promoted within organizations that initially discriminated: it’s only the hiring party who has the caste knowledge and very few companies maintain employee caste for HR reasons.
We have prior knowledge that interviews and subjective associations are biased anyway, so why shouldn’t they be considered a source of bias in this instance?
Let’s review:
Carroll et al. found that parole boards’ subjective judgments about the risk of recidivism and the reality of rehabilitation did not produce accurate predictions about post-release outcomes, but simple actuarial predictions did.
DeVaul et al. found that medical school students who seemed to have been rejected for what looked to be primarily subjective reasons—preprofessional evaluations, interviewer ratings, and committee ratings—were just as successful as their non-rejected peers when they were admitted to medical schools.
Campion, Palmer and Campion argued that structured interviews have an “obvious fairness” advantage over the unstructured interview since candidates are all asked the same questions. This is very plausible even if both tend to be biased. This argument is apparently so plausible that it’s “viewed as defensible by attorneys”.
Highhouse argued that people are stubbornly reliant on “intuition and subjectivity in employee selection” and that they have a bias against decision aids like tests and structured interviews or the combination of predictors. At one point, he demonstrated the biases involved in subjective judgment by showing the results of Sarbin’s investigation of the predictive power of a combination of high school rank and an aptitude test versus high school rank, an aptitude test, and counselors’ intuitive judgments. For the former combination, academic achievement was predicted at r = 0.45. For latter, subjectivity provided negative information and the resulting r was 0.35. Highhouse also noted that “experience does not improve predictions made by clinicians, social workers, parole boards, judges, auditors, admission committees, marketers, and business planners.” Moreover, “Although it is commonly accepted that some (employment) interviewers are better than others, research on variance in interviewer validity suggests that differences are due entirely to sampling error.”7
Rivera used interviews from “the recruiting department of an elite professional service firm,” and found that they tended to screen potential employees on their cultural fit with the organization. At law firms (75%) and investment banks (65%), but not consulting firms, evaluators were even willing to admit that cultural fit was the most important criteria to them in their interviews. In consulting firms, this was only the top criteria in 40% of cases. Explicit bias evidently wasn’t taboo enough to hide.
Dana, Dawes and Peterson conducted a series of three studies about the use of unstructured interviews.
In the first, they compared predictions about students’ GPAs based on their earlier GPAs to predictions based on unstructured interviews. In one unstructured interview condition, the participants gave random responses and unaware interviewers still claimed to have made sense of them just as confidently as when the responses were genuine. These interviews resulted in interviewers making worse predictions about GPA compared to using GPAs alone. GPAs alone predicted subsequent GPAs at r = 0.65, whereas GPAs plus interviews predicted subsequent GPAs at r = 0.31.
In the second, participants watched rather than gave interviews. Some of the interviews contained accurate responses and some contained random responses, but in both conditions, participants claimed to make sense of the interviews to equal degrees and they felt they obtained useful information. The predictive validity with interviews was r = 0.28 versus r = 0.37 with GPAs alone, which was only significant after this study’s result was combined with the prior study’s result. There were considerable correlations between interview evaluations and GPAs of 0.58 for the random and 0.55 for the random condition and these weren’t distinguishable, but they are notable because they likely speak to the phenomenon of interviews, at best, being poor proxies for objective measures.
In the final study, participants had the various types of interviews explained to them and they stated that they still preferred a random interview to no interview, believing that they would gain more information from seeing something rather than having their available information diluted by all of the noise inherent in the interviews. The belief in the interview is stubborn.8
It’s a wonder we allow subjectivity into any admissions or hiring process. It causes harm and we still trust it, seemingly because intuition trumps statistical information. The legendary psychologist Paul Meehl once famously pointed this out, showing that of twenty research studies comparing human and statistical predictions, statistics were superior in eleven cases, tied in eight, and one showed a human advantage. A decade later, he published an article in which he found thirty-three wins for statistics, seventeen ties, and one human win. Three years later, Goldberg noted that the human win was actually methodologically flawed and the result was really a tie. Almost twenty years after that, Meehl published a follow-up that noted he was more successful than he had known when he started talking about this issue, but clinical practice hadn’t responded.
Seven years after Meehl’s 30-year follow-up he published a book chapter in which he used many examples including predictions of academic success, business bankruptcy, longevity, military training success, myocardial infarction, neuropsychological diagnosis, parole violation, police termination, psychiatric diagnosis, and violence, among others, to show that his conclusions held up even more broadly than he had initially imagined. Others have noted Meehl’s correctness, and even reported that Meehl’s initial win he chalked up to humans was itself another mistake.9
With all of this said, one might still reasonably argue that the group debates should be when the caste penalty emerges. This belief takes an uninformed view of recent Indian history and plays fast and loose with plausibility. Consider the fact that the debates involve large groups of students and the debate participants are split randomly between castes. Consider also that scholars have found there to be “no association between skin color and caste” and among “educated elites, like those in my sample, English has emerged as a caste-neutral language with little to no remnants of caste dialects that are prevalent in most Indian languages.” Furthermore, what dialects there are in this sort of sample have taken on a regional (north/south) character rather than a caste-based one, and even those accents have converged recently due to “migration, urbanization, and improved levels of education.”
The debates are not a setting where discrimination on the basis of caste can take place unless the hosts are experts at phenotyping caste, which they almost-certainly are not. To repeat: it is only in the personal, one-on-one interviewing stage where the possibility of assessing cultural fit and caste identity happens that the penalty sets in.
We now know two things. Firstly, the disadvantaged caste penalty is consistent with taste-based discrimination because those who overcome it outperform. Secondly, we know that the effect only emerges in the exact moment when it’s possible to identify someone’s caste, albeit imperfectly. With those two things in mind and fairly certain knowledge that interviews can detract from the hiring process through inaccuracy and adding bias, I think that’s enough to make the case that it was the interviews that resulted in the penalty for members of disadvantaged castes. Or in other words: “Interviews are common avenues where unwarranted disparities emerge.”
But there’s more!
As it turns out, for roughly 15% of the study’s analytic sample, participants names reveal their caste. For the remaining 85% or so, their names don’t distinguish their caste background. For those with these nonidentifiable names the results are in gray, and for the people whose names indicated their background, the results are in red. The difference is marked:

The results for the smaller identifiably-named subset are less precise, but nevertheless, it’s clear that, in their case, discrimination is immediate. When they’re not identifiable, the impact of caste only shows up in the stage where it’s possible to identify someone’s caste, but if their caste can be figured out immediately, there’s no waiting period for discrimination.10 The evidence for discrimination becomes even more direct if we simply look at the first cuts:

If your caste can be identified from your name alone, your application is more likely to end up in a rubbish bin. The uncontrolled comparisons in the paper show the same thing, such that even with uncontrolled quality differences, a smaller share but still most of the larger 23% uncontrolled penalty emerges only after caste revelation.
Reviewing Alternative Explanations
Non-discrimination attempts to explain these results are hard to imagine. The differences are not down to a lack of screening between stages, differences in the hiring process, differences in measured skills, superior alternative options for those who don’t belong to disadvantaged castes, bargaining, public sector competition, differences in preferred job characteristics, or delaying the desire to discriminate.
If anyone would like to propose some unmentioned or unaddressed alternatives, I’m all ears, I just don’t see any that can explain this large of a result.
I am reasonably confident that there was harmful taste-based discrimination against members of disadvantaged castes in an elite Indian college’s job fair.
Our One Tool
We have one unbiased and objective tool for indicating whether an employee will do a good job and it’s testing. The other options contain varying degrees of bias, unreliability, and subjectivity. That is why all alternatives to testing are morally and pragmatically inferior and their usage can easily result in de facto discrimination and compromised prediction.
As noted in Footnote 1, there have been attempts to gerrymander the results of tests. People don’t like that they portray the capabilities of different groups accurately, revealing job-relevant differences in performance between them. These attempts can readily result in bias and compromised validity, harming employers and incentivizing discrimination. For example, if the transition to “Pass/Fail” for the Step 1 United Stated Medical Licensing Examination portends the same change for each subsequent step in the examinations, the case for discriminating against African American doctors will be very powerful. Affirmative action already makes that case; affirmative action by other means just makes it stronger.
Some people try to denigrate tests as things that some group or another has had more of a chance to prepare for, with results thus indicating that group’s ability less and generally biasing test results in favor of those with high levels of socioeconomic status.11 The effects of preparation generally aren’t large enough to make that true, and while retesting has considerable benefits, it usually doesn’t matter in the world of work. Moreover, there really isn’t that much class bias in the availability of opportunities to prepare for tests or to retest when that option is available.
If the types of preparation people engaged in were things like exact preparation via memorizing scoring topics and rubrics for essays or practicing the rules of figural matrices, that would be a different matter. Since that is not usually the world we live in, it shouldn’t be considered worrying. When that possibility does crop up, it’s usually only true for school-based achievement tests12 or in organizations like Mensa.
I do not believe that the people making the case against testing on the basis of allegedly unequal test preparation and retesting opportunities are usually engaged in making a good faith argument. After all, the alternatives are all worse, so their argument amounts to a proposal to have selection processes that are actually verifiably biased in favor of the wealthy and the unqualified.
The fact of tests being our only unbiased selection tool may have been true for more than a thousand years. Consistent with claims about China’s examination system as the source of an incredible level of meritocracy, in the Tang Dynasty, the results of taking the Keju examination became more prominent predictors of persons’ professional success over time, while their background as members of elite families declined in importance. As researchers like Arcidiacono and Chetty have documented at length, testing today could also reduce class-related privileges. Via Chetty:
We… consider a counterfactual admissions scenario in which colleges eliminate the three factors that drive the admissions advantage for students from high-income families—legacy preferences, the advantage given to those with higher non-academic ratings, and the differential recruitment of athletes from high-income families—and then refill the newly opened slots with students who have the same distribution of SAT scores as the current class. Under such an admissions policy, the share of students attending Ivy-Plus colleges from the bottom 95% of the parental income distribution would rise by 8.8 percentage points, adding 145 students from families earning less than $222,000 (the 95th percentile) to a typical Ivy-Plus college. This increase of 145 students from lower-income and middle-class families is similar to the reduction in the number of Black and Hispanic students that would arise from eliminating race-based affirmative action policies absent any other changes in admissions practices. Hence, eliminating the admissions practices that benefit students from high-income families would increase socioeconomic diversity by a magnitude comparable to the effect of racial preferences on racial diversity.
Even more interestingly:
Importantly, the increase in socioeconomic diversity would not come at the cost of reducing class quality as judged by post-college outcomes: the share of students from Ivy-Plus colleges who reach the upper tail of the income distribution would remain similar and the share who work at prestigious firms would increase because the factors leading to admissions advantages for students from high-income families are not predictors of better outcomes.
It’s clearly time for less subjectivity and more tests.
This has been corroborated repeatedly throughout the case. For example:

And:
And:
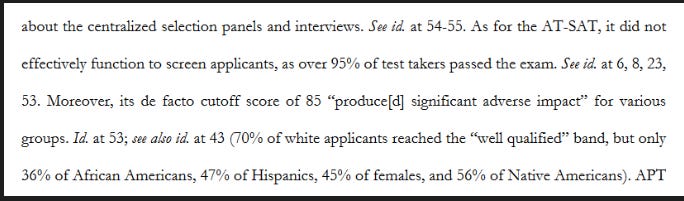
And there are even research papers on this subject that show it is possible to reweight the AT-SAT to reduce group differences while validity only declines a bit.
This paper is worth discussing. For starters, the validity of the AT-SAT declined from 0.69 to 0.60, but that was the validity of the reweighted score, not the pass rate. The object of the reweighting was to increase the pass rates for low-performing groups, while avoiding going too far and creating an adverse impact scenario by giving any group a 100% pass rate.
For potential employers who are only provided with an indication that an employee passed or failed an examination, the validity, the performance distribution, and the threshold are what matter for determining the impact of that test result on employee’s performance. With a validity of 0.69 and a threshold such that 63.6% of Whites make the grade as in the paper’s Table 3, if we assume Whites have a mean of 0 (μ) and an SD of 1 (σ), where Z = qnorm(1-0.636), using that threshold leaves behind a \hat{μ} of μ + σ * (dnorm(Z)/(1-pnorm(Z))) = 0.590.
And thus, the employer’s expected gain, G, is just E[G] = r * the deviation, X, so 0.69 * 0.590 = 0.407 SDs of job performance. However, using the reweighted scores, 82.2% of Whites passed the threshold and the validity dropped to 0.60. Using this new threshold, employers would only gain 46.7% as much from the revised selection tool because the resulting value of \hat{μ} is just 0.317 and thus E[G] is 0.60 * 0.317 = 0.190 SDs.
This is the first problem with the paper: the bait-and-switch. The idea of many papers that talk about making more equal solutions is to claim that validity is preserved by talking about the predictive power of the scores when thresholds are used in practice, often for legal reasons.
Next, the changes seemed to be differential by group, although the power to detect that possibility was limited. Consider the Black-White gap. In the general population, this gap is approximately 1 d in size. Because this sample was selected on the basis of taking prior tests like the Office of Personnel Management’s written test (thus truncating the ability distribution), previous employment as an air traffic controller (as in the military, which cognitively screens applicants), and volunteering to participate (which is selective with respect to ability), the gap was plausibly constrained by prior selection on the basis of test scores and other test-relevant factors.
The originally-weighted score gap in this sample was 0.602 d. The Black group scored 0.581 of the White group’s standard deviations lower than the White mean. Assuming equal true variances, if we selected employees on the basis of race at random from the Black group, we would expect -0.581 * 0.69 = -0.401 SDs of performance compared to doing that in the White group. If we applied the same truncation threshold at the White 36.4ᵗʰ percentile to the Black group, we would expect them to have a post-threshold mean of 0.371, so 0.371 SDs above picking unselected Whites. But a, signal of the group’s lower mean remains beyond this threshold, and the signal suggests employers gain less on average from picking a Black employee who is qualified on the basis of passing the test. E[G] would be 0.371 * 0.69 = 0.256 instead of the White group’s 0.407 SDs of gain.
The reweighted score gap is 0.494 d. In the White group’s standard deviations, it’s 0.476 SDs below the White mean. With the passing threshold at the previously-considered level for Whites (1-0.822), the post-threshold Black mean becomes 0.061. With this new threshold, there’s very little gain from selecting a Black applicant who passed the test compared to a random White applicant. With the validity being reduced to 0.60, the gain would be just 0.037 SDs.
Throughout this simulation, we’ve assumed the Black and White variances were equal, but the initial Black variance was 86.4% of the White one, and afterwards, it was 85.9% of it.
Accounting for this difference in variances using the originally-weighted scores, selected Blacks clock in at a mean of 0.315, delivering 53.3% of the expected gain for employers who pick among passing Whites instead of 62.9% of the expected gain assuming equal variances. With the revised score threshold, there is absolutely no way that employers would gain anything from a Black pass/fail score because the selected Black group’s mean drops to 0.004, leading to an expected gain for employers of just 0.0024 SDs over just picking from among unselected Whites. That is not distinguishable from zero. It is a much better result than picking from Blacks without a threshold in place, but it also means that a potential employer who knows a Black person passed a test and a White person passed a test and the two are otherwise equivalent will tend to gain much more on average by just going with the White applicant.
A combination of lowering standards and reducing validity means that this revised test is basically worthless for some groups. Since a mere pass/fail with the revised weighting now means Blacks who pass are virtually equivalent to Whites selected at random regardless of whether or not they pass, why give any care at all to Black applicants if you have White ones available? The obvious reason is because of the higher variance of the White selections since they haven’t been truncated; but even then, there’s no difference in E[G]. Since this is a highly select sample and the performance gaps are smaller in it than in general, that reduced variance likely doesn’t matter since Black performance will tend to be even worse.
But if the initial score was unbiased—as is usually the case with tests—then it seems likely that the new score is biased, if not in measurement, then in structural parameters and, likely, in how well it predicts performance between groups.
Compare the various pass rate-based gaps before and after the revised scoring method is implemented. The Black-White gap is estimated as 0.072 SDs above the gap in terms of Glass’ delta initially; afterwards, it declines to 0.334 SDs, or fully 0.142 SDs below the revised Glass’ delta. That’s a pretty wide swing. It either suggests scores were weighted in a favor that favors the ‘Black scoring pattern,’ that range restriction came into play for the White group more severely than for the Black one, or a combination thereof.
If the sample were much larger, we could say that this is unlikely to be due to range restriction, because the result as it is, is consistent with differential reweighting since, after all, as means change equally for different groups, the percentages beyond a given threshold should provide an invariant indication of the differences in group means. But that doesn’t seem to have been the case.
Since I have that data and can verify the analogy holds, consider an analogy to the WAIS-IV/WMS-IV. If I produce a weighted score that is heavily weighted towards memory, I can reduce the Black-White gap compared to the test’s FSIQ or a g factor score for the same set of tests. More importantly, I can apparently preserve the validity of the test in terms of its correlation with grades, at least, for the most part, and in the full sample. When I compare races and sexes after this reweighting, however, I obtain a very different result: there are biased intercepts and there are biased slopes. The apparently high whole-sample validity misled because there was notable subgroup heterogeneity that was induced by my differential weighting and the fact that it was weighted in favor of the Black group.
Even more impressively, if I just hack everything together and try to calculate ‘optimal’ weights, I can increase the validity if I want to while keeping the group differences down. There are several problems with doing this. The first is that this weighting scheme produces a composite score whose weights do not resemble anything like the loadings for the factors underlying test performance. I am unable to fit a factor model with these weights that is also capable of reproducing the scores for the different groups. This composite also has biased predictive validity and, in the whole sample, it capitalizes on between-cluster differences in scoring and grades to obtain its higher predictive validity. Within groups, there’s no such boosted validity, so it was illusory all along. I can do this with biodata too.
Perhaps the worst problem is that these weights’ predictive validity doesn’t replicate on a holdout sample, although the reason for that seems to be the lack of clusters to make into a problem. This is a problem for this AT-SAT reweighting attempt too, and the reason is simple: the sample the reweighting was done on was a low-stakes sample. If people aren’t putting in the sort of effort they would if the exam was actually high-stakes, should we expect the reweighting scheme’s effects to generalize to high-stakes scenarios? It might, but we have no a priori means of knowing that.
In general, we should suspect that reweighting schemes designed to preserve validity while reducing group differences will produce biased predictions since they are almost explicitly biased. After all, how do you reweight a score to help some group out while keeping the predictive power in general and within subgroups?
Any answer that doesn’t take heed of the slopes and intercepts of the resulting regressions in different groups is a foolish one. Any answer that takes heed of them without details about the use of the use of the score in practice is likely to be one too. Any answer that exploits low power to claim a revised weighting scheme results in unbiased prediction is a dishonest one.
Even in scenarios without bias, attempts to reweight away differences while maintaining validity suffer from a fatal issue even if we don’t switch to pass/fail: they limit the resulting range of performance. Employers will suffer from anything that makes groups more equal, because it makes potential employees less distinguishable. If employees do not have the opportunity to distinguish themselves because the validity of examinations has been reduced along with the range of scores, well, why not simply go with the probabilistically better bet and pick someone from a higher-performing group? This is especially useful if people from different groups now more often end up with the same scores when they wouldn’t have before. After all, the higher-scoring group member will tend to have a higher true score and thus a score that regresses to a higher mean.
Even if we assume that a reweighting attempt has increased the variance in a score that can be attributed to some other reasonably predictive trait that’s perhaps less differentiated between groups, like trait conscientiousness, we have to contend with the fact that our only general-purpose predictor is g and that the underlying g variance still matters and it might, post-reweighting, be trading off against something less general-purpose. If the thing that’s increased in its representation is biased, we have just made the situation worse.
The psychometric problems inherent in these attempts to obviate test score gaps without addressing the gaps themselves are manifold, and they promote employers statistically discriminating against members of lower-performing groups if they have an iota of background knowledge.
Some researchers have investigated whether closing gaps without addressing their causes is effective at producing meaningful changes in attainments. In one interesting case, Riehl found that it was not in an investigation of Colombian national college admissions exam test-takers. Riehl leveraged a scenario in which an exam redesign resulted in low-income students doing better on the exam, leading them to attend better colleges, but causing them to have lower earnings afterwards because the exams had become poorer predictors of performance. Riehl posited that power of artefactually closing gaps depended on preserved validity. Accordingly, McDaniel and Kepes’ and Dahlke and Sackett’s work seems relevant.
Since I wrote this, Trace has put up a Twitter thread on the effort to change these tests.
To see how bias is defined, see that article.
Among the exceptions are things like linguistic bias against second-language learners and questions about things that members of a particular sex should be more likely to know about, like women’s health questions.
The authors of this made the interesting point that: “It is also worth noting that while biases or disparate impact of IQ tests are a common concern, our findings are consistent with the argument often made by proponents of IQ testing that it can serve to limit biases associated with subjective judgment. We thank a referee for this point.”
The word “systematic” is critical, as it signifies how we lack a general-purpose means of vetting non-test selection methods like we have for tests. We can see that many non-test methods are biased through various means, as I’ll example, but the investigation process for a given method’s implementation may be entirely different from how another should be investigated.
Consider the scenario where scholarships are only available for members of certain groups.
“Existing evidence suggests that the interrater reliability of the traditional (unstructured) interview is so low that, even with a perfectly reliable and valid criterion, interview-based judgments could never account for more than 10% of the variance in job performance. This empirical evidence is troubling for a procedure that is supposed to simultaneously take into account ability, motivation, and person-organization fit. Keep in mind also that these findings are based on interviews that had ratings associated with the interviewers’ judgments. Thus, the unstructured interviews subjected to meta-analyses are almost certainly unusual and on the high end of rigor. The data do not paint a sanguine picture of intuitive judgment in the hiring process.”
Similarly, as noted by work and personality psychologist Brenton Wiernik, it takes around eight letters of recommendation to achieve a reliability of 0.75, which is somewhat amazing since the typical ask is for one-to-three letters, they take a good deal of effort to write, even with them, it’s not clear how to evaluate them, and they’ll be especially bad if they’re narrative letters. One could obtain greater validity and a reliability of around 0.90 by using the Wonderlic, which takes twelve minutes to administer and produces an unbiased result. Other work has shown poor construct validity for things like mentor reports of mentee research skills as well.
When subjectivity is present, it’s generally safe to assume there’s low reliability, poor prediction, prediction that’s biased in practice (e.g., by class, race, sex, nationality, location, etc.), and limited construct validity underlying what predictive validity there is.
The dilution noted in Dana, Dawes and Peterson’s study was given its name by Nisbett, Zukier and Lemley. They showed that the worry expressed by prior researchers that only using diagnostic information would lead to extreme predictions and actions towards people is complemented by the problem of having too much nondiagnostic information, leading to diluted predictions. The presence of nondiagnostic information leads to predictions that are not extreme enough, and which are still too confident: “If the case record, or other information available to the gatekeeper, contains large amounts of information which, taken singly, would be believed by the judge himself to be valueless for purposes of prediction, extreme predictions, even when correct, may be set aside in the context of the complete file of information. As a consequence, individuals who are a danger to themselves or others might be likely to be untreated, released, or paroled, simply as a function of the amount of worthless information about the individual which the gatekeeper happens to possess. The present results thus provide yet another reason for expert judges to abandon intuitive strategies of judgment whenever more formal methods of assessment are possible.”
Similarly, see sentencing via judicial discretion versus the use of sentencing guidelines.
Meehl was always insightful. Consider this quotation of his about low-quality critiques of path analyses: “Why these constraints are regularly treated as ‘assumptions’ instead of refutable conjectures is itself a deep and fascinating question….” His colleague Thomas Bouchard elaborated on a related subject in Chapter 6 of Modgil and Modgil’s Arthur Jensen: Consensus and Controversy.
It’s not significant, but the non-monotonicity of this with respect to the cognitive testing stage among the identifiable sample is consistent with tests debiasing a biased selection process.
This is also just untrue, perhaps because the effects are so modest.
Which are all too often meant to be gamed by students who decide to put in the effort, hence the well-worn trope of “teaching to the test.”
I didn't see it in the text but Linda Gottfredson documented a case where government tampered with tests to make them show smaller gaps between races and in the effect make them nearly useless.
Racially gerrymandering the content of police tests to satisfy the U.S. Justice Department: A case study
http://www.udel.edu/educ/gottfredson/reprints/1996gerrymandering.pdf
'Bias is a major problem' is a major understatement. "In exhaustive detail Heather Mac Donald demonstrates that allegedely disadvantaged students (especially if black) have in fact long been the beneficiaries of a raft of racial preference policies whereby they gain admission to elite institutions with far lower entry qualifications than white or Asian students. In 2003 it was “disclosed that Berkeley had admitted 374 applicants in 2002 with SATs under 1000 – almost all of them students of colour – while rejecting 3,218 applicants with scores above 1400”. At Arizona State University in 2006, white and black students with the same academic credentials had respectively a 2% and a 96% chance of admission. She refrains from driving home the obvious corollary that the white and Asian applicants were the real victims." https://grahamcunningham.substack.com/p/how-diversity-narrows-the-mind