
Sex Differences in Intelligence
In the battle of the sexes, who comes out on top?

This was a timed post. The way these work is that if it takes me more than three hours to complete the post, an applet that I made deletes everything I’ve written so far and I abandon the post. You can find my previous timed post here.
Sex differences in intelligence are of perennial interest to large swathes of the reading public. Being fair to practically everyone, I’ll concede that they are a potentially interesting topic, and if there are differences, they might help us make sense of the world: If men are smarter than women, that can help to explain why there are more men in positions of eminence; if women are smarter than men, that can force us to confront a reality where culture has somehow suppressed the contributions of half of the population. Getting to the bottom of this could be important!
In a recent article on the topic (you should also check out my earlier article on sex differences in knowledge), I critiqued a paper that claimed to show women were smarter, but which used an invalid method to do so. In short, they awarded women extra points for being more risk-averse and concluded that was an underrated sign of intelligence. Clearly absurd. Whatever the case, in that article, I also described what would be required to actually test which sex was smarter. The ideal study features:
Excellent sampling. In many cohorts, the intellectually disabled, troublemakers, goofs, and drop-outs tend to be excluded, and this tends to artificially boost male performance. We need a cohort that’s not impacted by sampling problems.
Latent variable modeling. To provide a valid group comparison, you need to achieve measurement invariance and to ensure that you’re measuring the right thing—that is, intelligence, g, general intellectual ability as distinct from specific skills that might be more common in one or the other sex because of mere content exposure.
A quality test battery. Latent variable modeling can’t overcome a bad or sex-biased set of tests. We need good tests with diverse content, or the tests might favor one or the other sex by construction.
The closest study that I’ve found to actually overcoming this issue is Deary et al.’s 2007 analysis of the National Longitudinal Survey of Youth (1979; NLSY ‘79) sample. This study features a high-quality test battery with ten tests covering diverse content domains, given to a large, nationally-representative sample, and analyzed in an admittedly crude way with a latent variable model, comparing opposite-sex siblings. This comes close to overcoming every issue with typical sex difference studies, and their result was interesting:
Males show a very small (Cohen's d = 0.064) but significant advantage on the g factor extracted from the AFQT. Males score significantly higher on the g factor from the ASVAB, though the effect size is again very small (Cohen's d = 0.068). The strongest finding is for significantly greater variance in male scores. The standard deviations of the g factors from the ASVAB and the AFQT have male:female standard deviation ratios of 1.16 and 1.11, respectively.
This result is strong and important, and it is a shame that it hasn’t been replicated. So, with that said, I will do two things: I’ll reproduce and extend the result in the NLSY ‘79 and I’ll replicate it in the Children of the NLSY (CNLSY) and the NLSY ‘97 cohorts. With that said and done, it’ll be possible to finally make a pronouncement on that always-interesting question: Who’s smarter, men or women?
The Data, The Models
All of our raw data is publicly-available and comes from the Bureau of Labor Statistics. It can be accessed through the NLSInfo website. All of the data linking together participants by household and indicating their levels of relatedness (e.g., full-siblings, half-siblings, cousins, etc.) can be accessed through the publicly-available NLSYLinks R package.
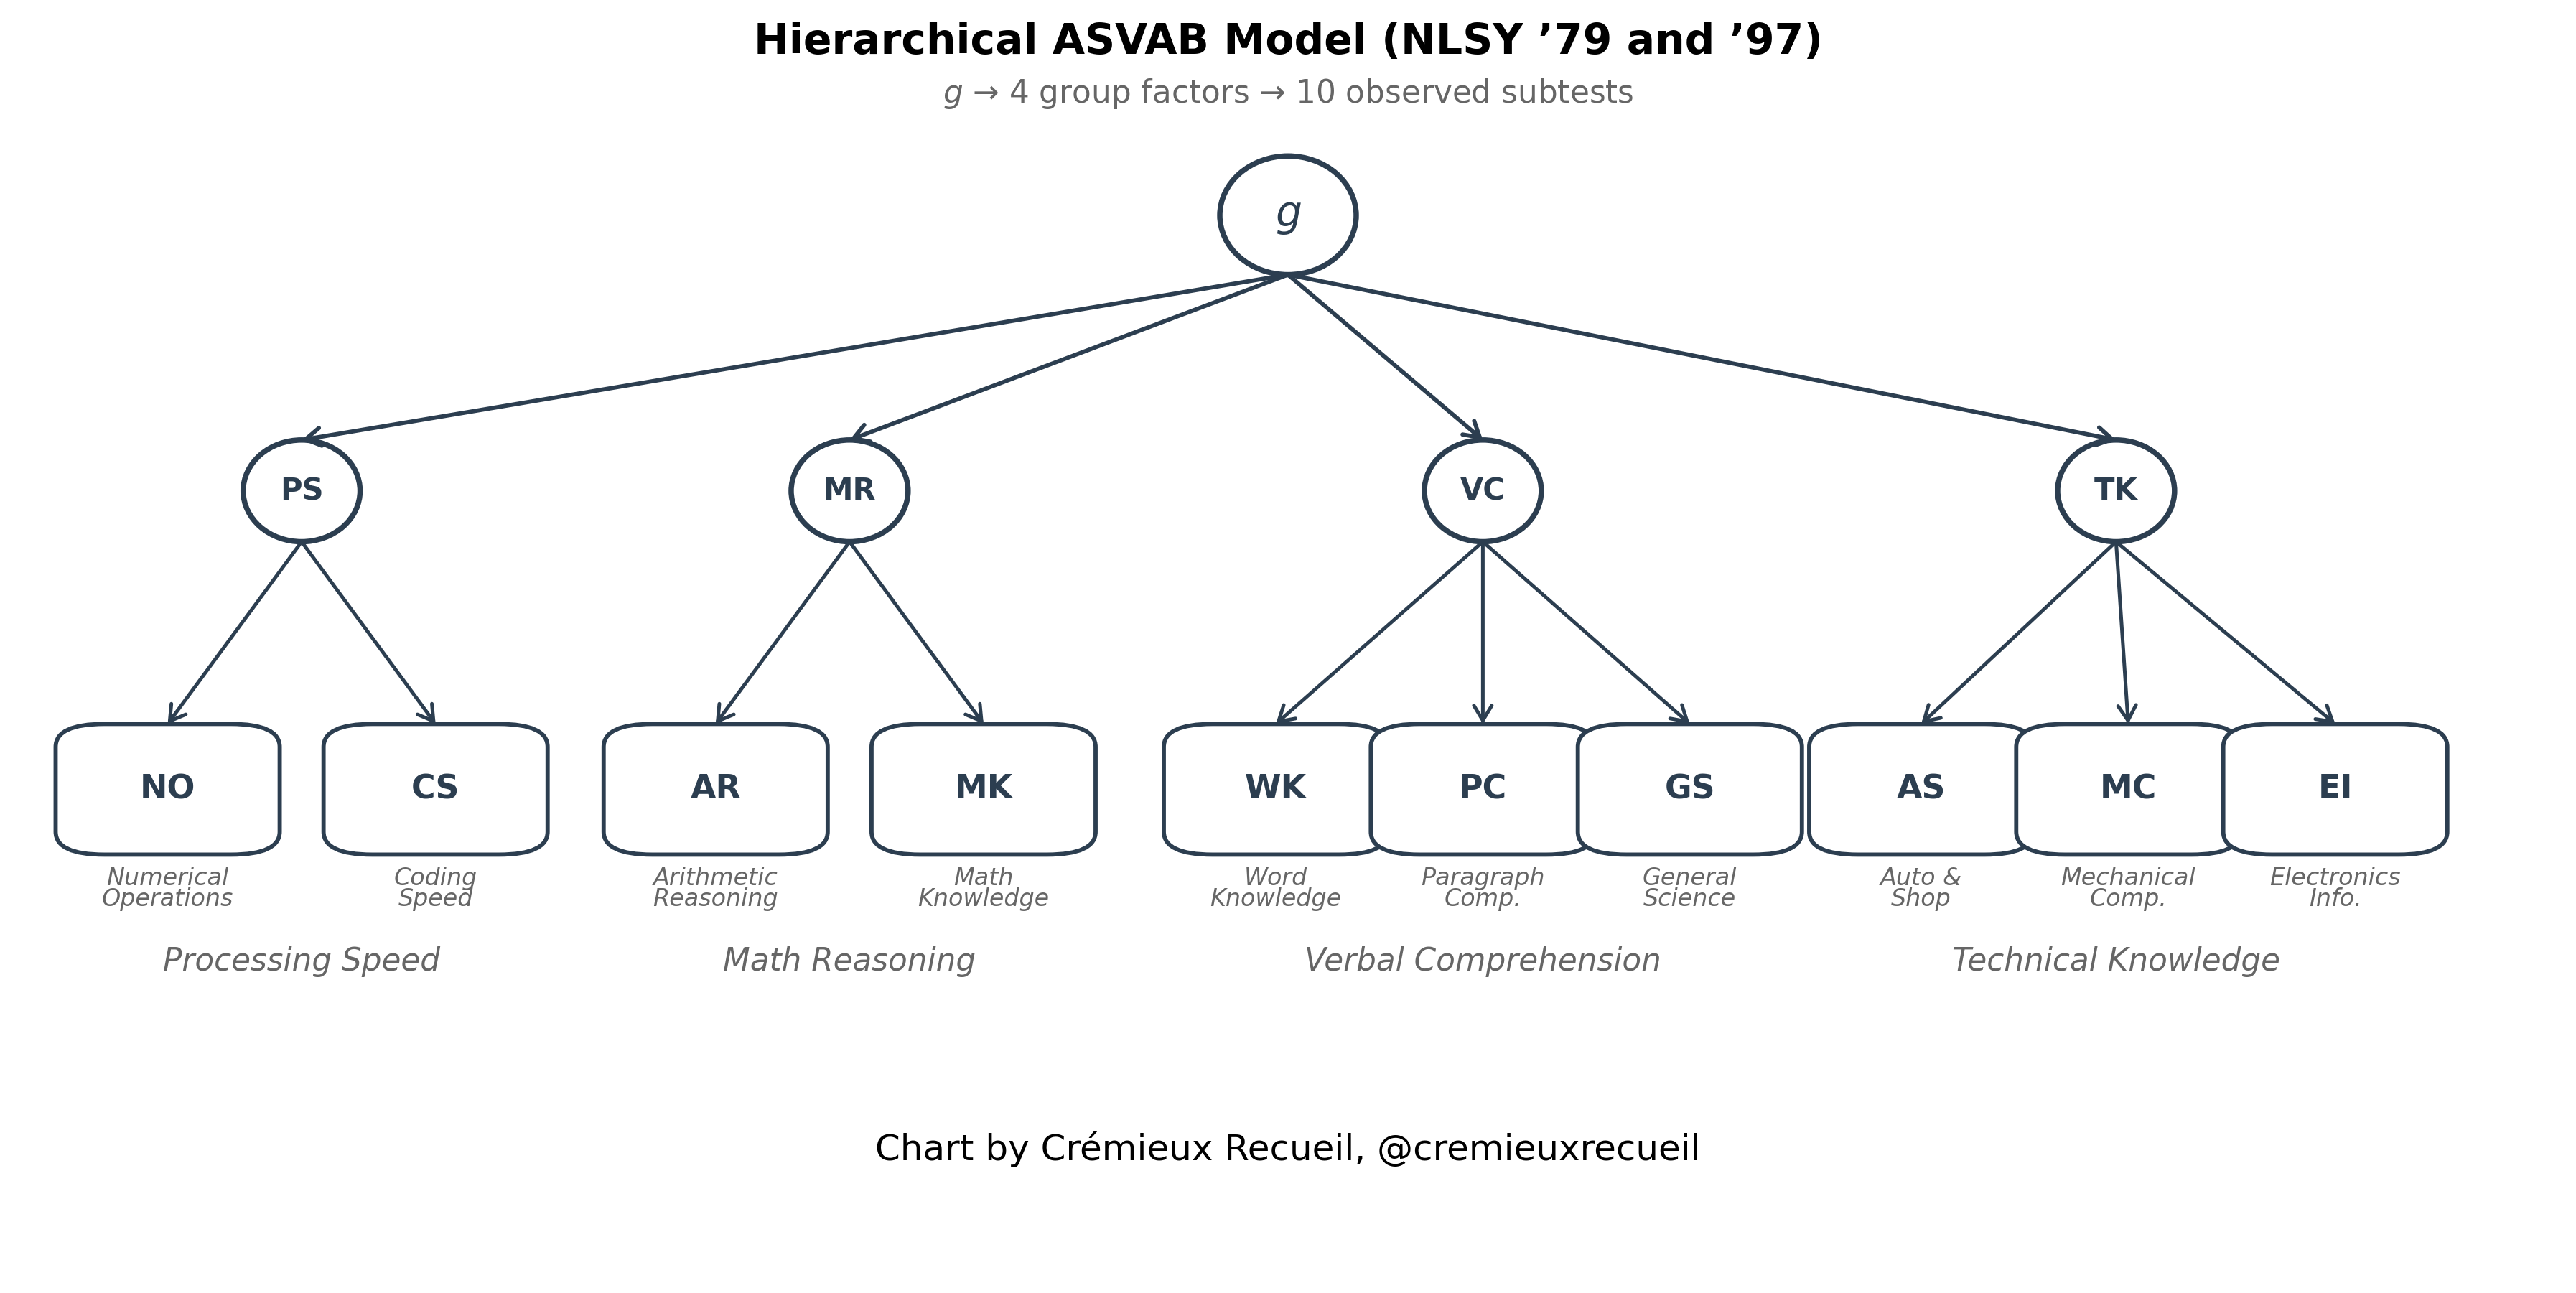
The models we’re using are theoretically-motivated. They’re based on published analyses of the tests batteries used in these studies, and they’re supplemented by noting and observing the theoretical coherence of different factors in the analyses. For the NLSY ‘79 and ‘97 cohorts, we’ll be using this hierarchical model that features a general factor, g, and four group factors that have to do with speed, mathematics, verbal ability, and technical knowledge. By using a higher-order g, we obviate psychometric issues with oversampling particular abilities like spatial or reading.
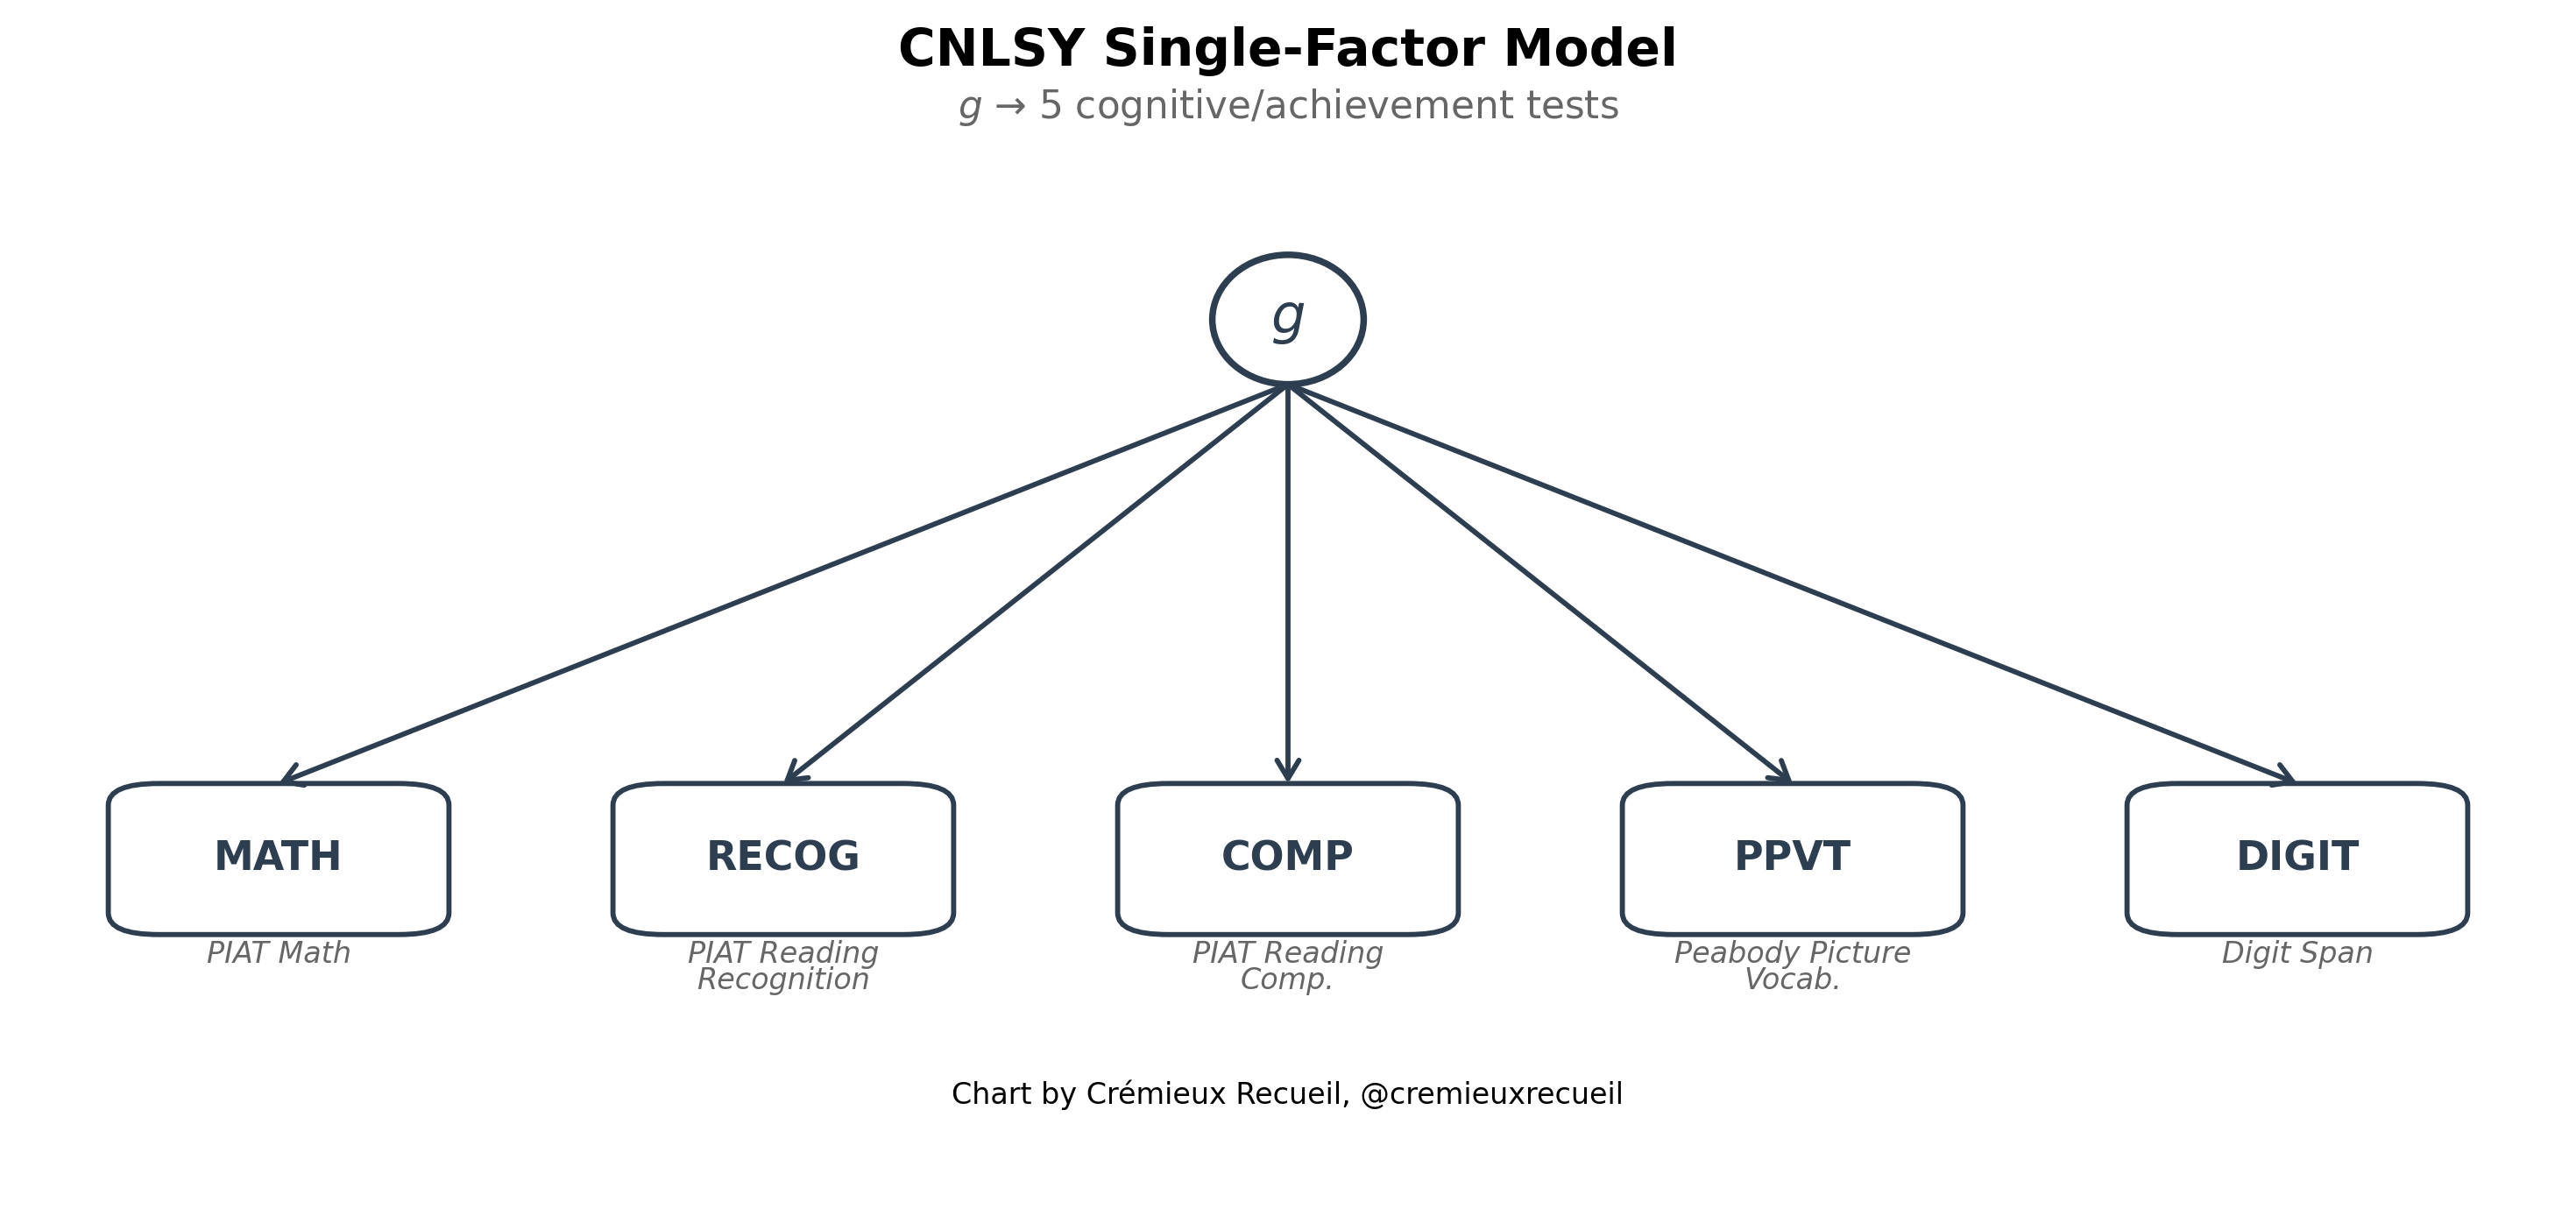
For the CNLSY, we have fewer subtests, and so we’re forced to fit a single-factor model with a set of tests that arguably favors girls because of its greater focus on one of the abilities that girls tend to excel in net of g: reading. This could confound both mean estimation and variance estimation, so in order to get the most coherent results, we will endeavor to estimate the variance difference where the mean difference is zero.
For our sampling, we’ll match the prior literature and use published schemes, but in the section below entitled Robustness, I will match all the samples on sampling schemes, and I’ll be presenting several results with different schemes anyway, for a glimpse into how strong these results are. By cohort:
NLSY ‘79:
All 10 ASVAB subtest results present
Age-residualized on birth year with a quadratic polynomial (age range = 16-23)
All male-female sibling pairs within households or relatedness, R = 0.50 (“Gen1Housemates”)
Deduplicated (each person once in the CFA)
MLR estimator with FIML imputation (effectively listwise)
NLSY ‘97:
All 10 ASVAB subtests present
Age-residualized on birth year (quadratic; age range = 13-17)
R = 0.50 pairs only, since the NLSY ‘97 lacks a household grouping variable comparable to the ‘79 one
Deduplicated
MLR with FIML
CNLSY:
At least 3 of 5 tests
At least one observation per child
Age-residualized on interviewed age (CSAGE; quadratic; age range = 5-18)
All male-female pairs within MPUBID (a household variable) or R = 0.50 (“Gen2Siblings”)
Deduplicated
MLR with FIML (68% complete cases and FIML handles the rest)
Do Our Models Fit?
Yes! Our latent variable models are almost fully invariant, meaning that males and females are comparable and that the factors influencing their performance are shared between sexes.1 The only areas in which there are deviations from full strict factorial invariance have to do with the intercepts, and specifically for the NLSY ‘79’s General Science and Auto & Shop subtests and the NLSY ‘97’s Paragraph Comprehension subtest.
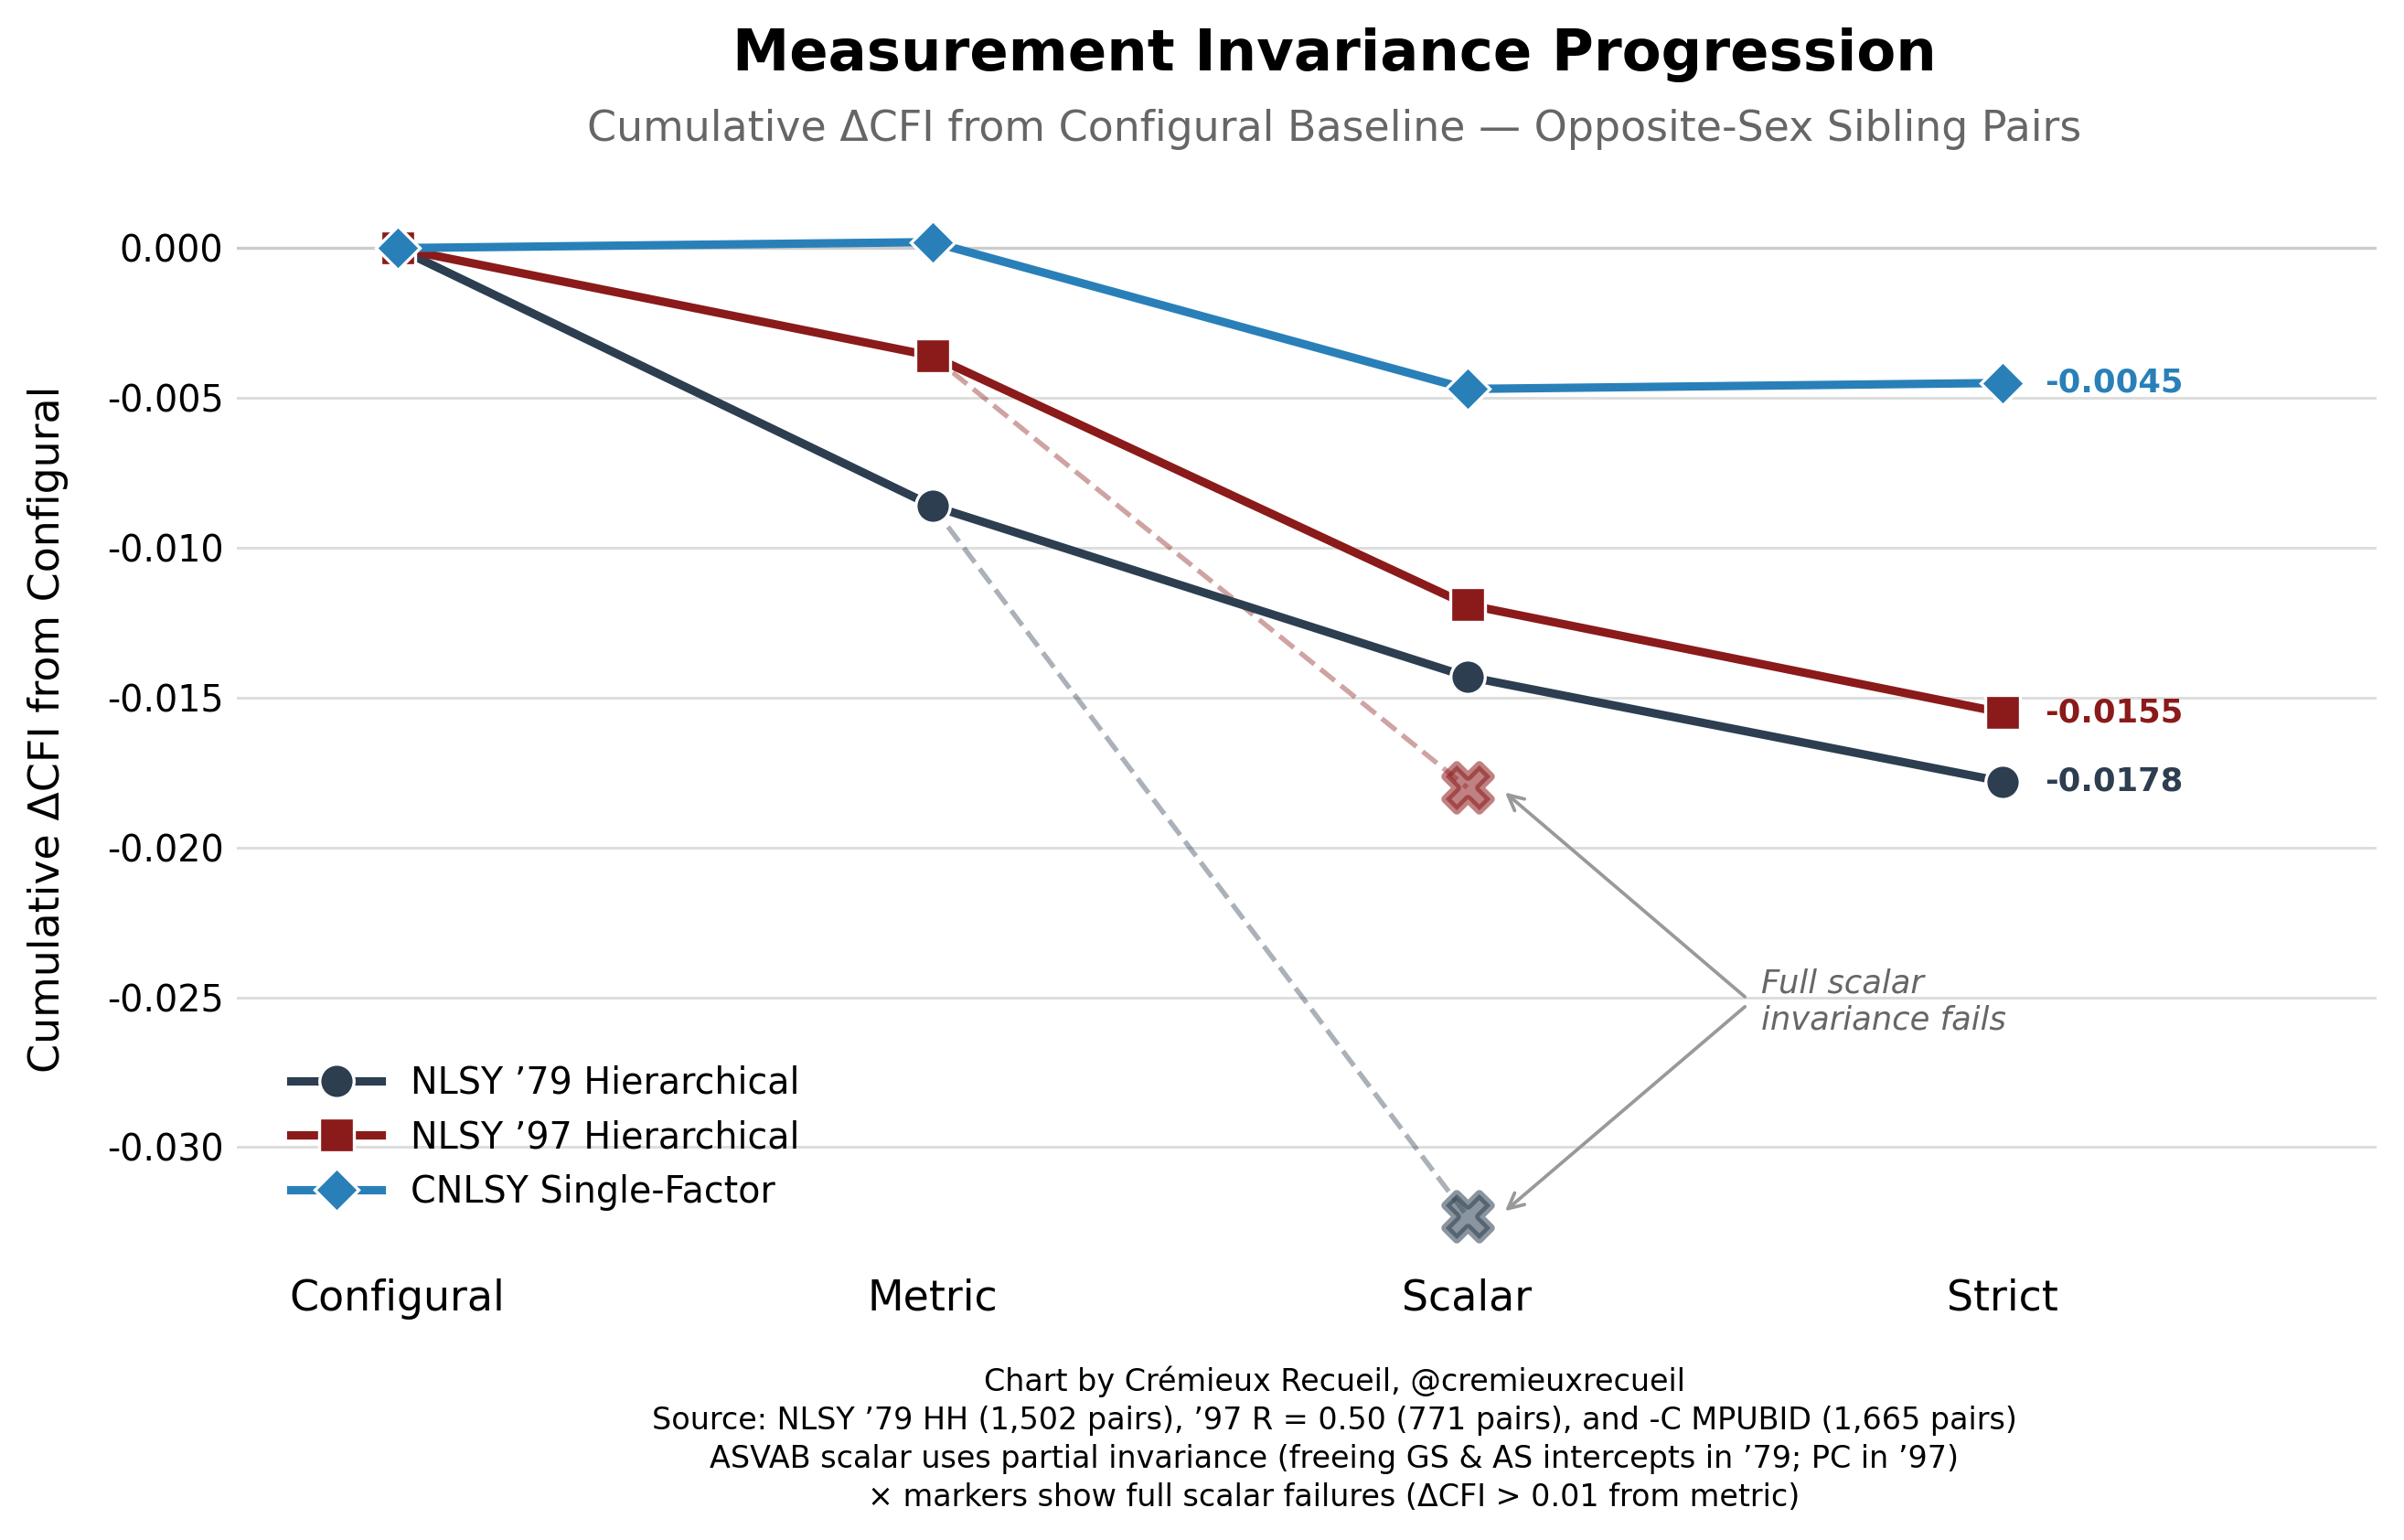
Partially invariant models freeing these parameters leave more than enough constrained parameters to measure latent g credibly across the sexes, and they at least make some theoretical sense. For example, for General Science and Auto & Shop, boys might have been more interested in the subjects, leading to additional learning about them and raised intercepts as a result. That means that, net of measured ability, boys did better (roughly 0.25 d better) in those specific subtests.
Curiously—and this makes less theoretical sense—boys also did better than expected in Paragraph Comprehension and they did so by a similar degree to their boost for General Science and Auto & Shop. This means that even though girls did better in this subtest, they would’ve done even better without bias. In fact, the gap would’ve roughly doubled in size in girls’ favor, but only for the NLSY ‘97 and not the ‘79.
With our modeling efforts being such a success, we can now review our actual results!
So, Who’s Smarter?
The question of who’s smarter has to do with differences in g, not specific abilities. This question is directly testable within our latent variable models. All we have to do to test it is constrain the means to equality and see if the model fits better or worse. To get to the means, we have to start by first testing if the variances are equivalent, and as it turns out, they are not.
In each dataset, male g is much more variable, as it is in most datasets out there. Importantly, this means that the observation of greater male variance is not attributable to sampling.2 In fact, because sampling issues tend to cut off the left tail, they should generally reduce the male-female variance difference. Consistent with that, the generally-observed variance ratio of 1.16 is smaller than these. If you look on the right-hand side of this plot, you’ll see far larger variance ratios: 1.49, 1.21, and 1.37!
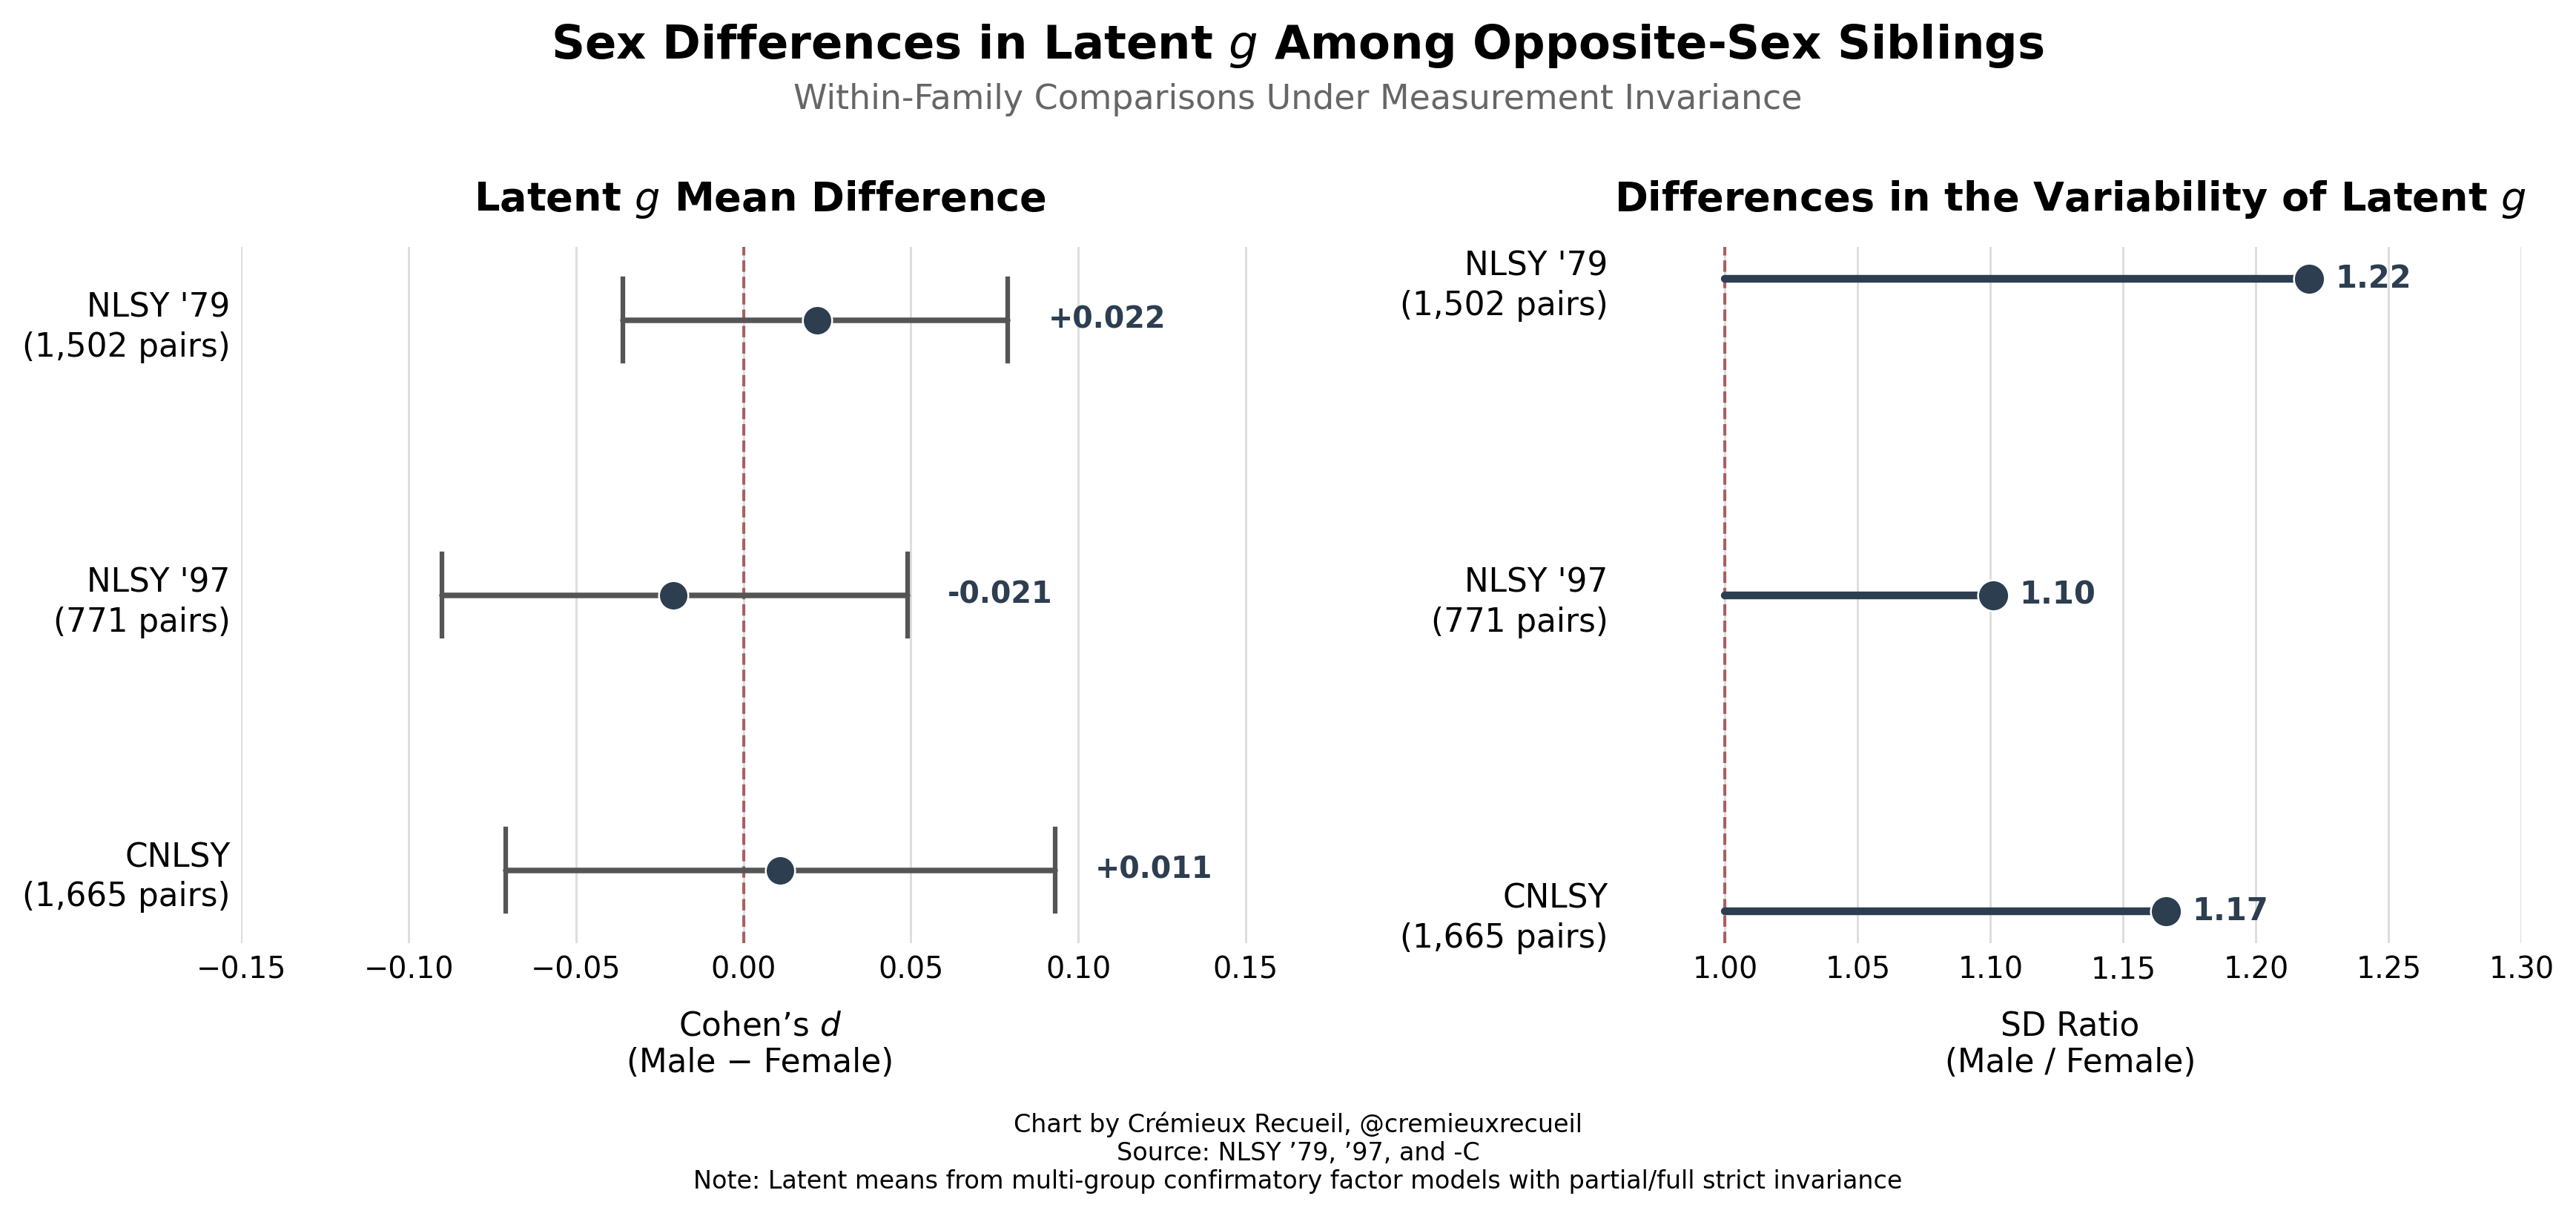
If you look on the left-hand side of the plot, you’ll see the other interesting detail: virtually zero difference in g! The mean differences in the NLSY ‘79, the NSLY ‘97, and the CNLSY are between 0.32 IQ points favoring girls and 0.33 IQ points favoring boys. Using the extreme tips of the 95% CIs doesn’t make things much different (-1.35 to 1.40). In other words, the difference is minuscule!
Let’s make a strong statement:
S1: Sex differences in intelligence have to do with the variances, rather than the means.
Some people prefer to conceptualize intelligence differently. They are wrong to want to do so and they are concerned with considerably more minor constructs, but we can still help to satisfy them by looking at the differences in the group factors in the hierarchical models from the NLSY ‘79 and the NLSY ‘97. Take a look at the gaps:
The mean differences in Processing Speed and Technical Knowledge were consistent between cohorts. For Mathematical Reasoning and Verbal Comprehension, they were not, and now the male-favoring difference in Mathematical Reasoning is slightly reversed.3 But how much does this matter? Not a lot. These group factors explain very little performance. You can see this very clearly from the implausibly high variance ratios for these different factors, which follow naturally from the limited variance.
Let’s make another strong statement:
S2: Sex differences in cognitive ability have less to do with intelligence and more to do with specific abilities. These appear to be more malleable than intelligence.4
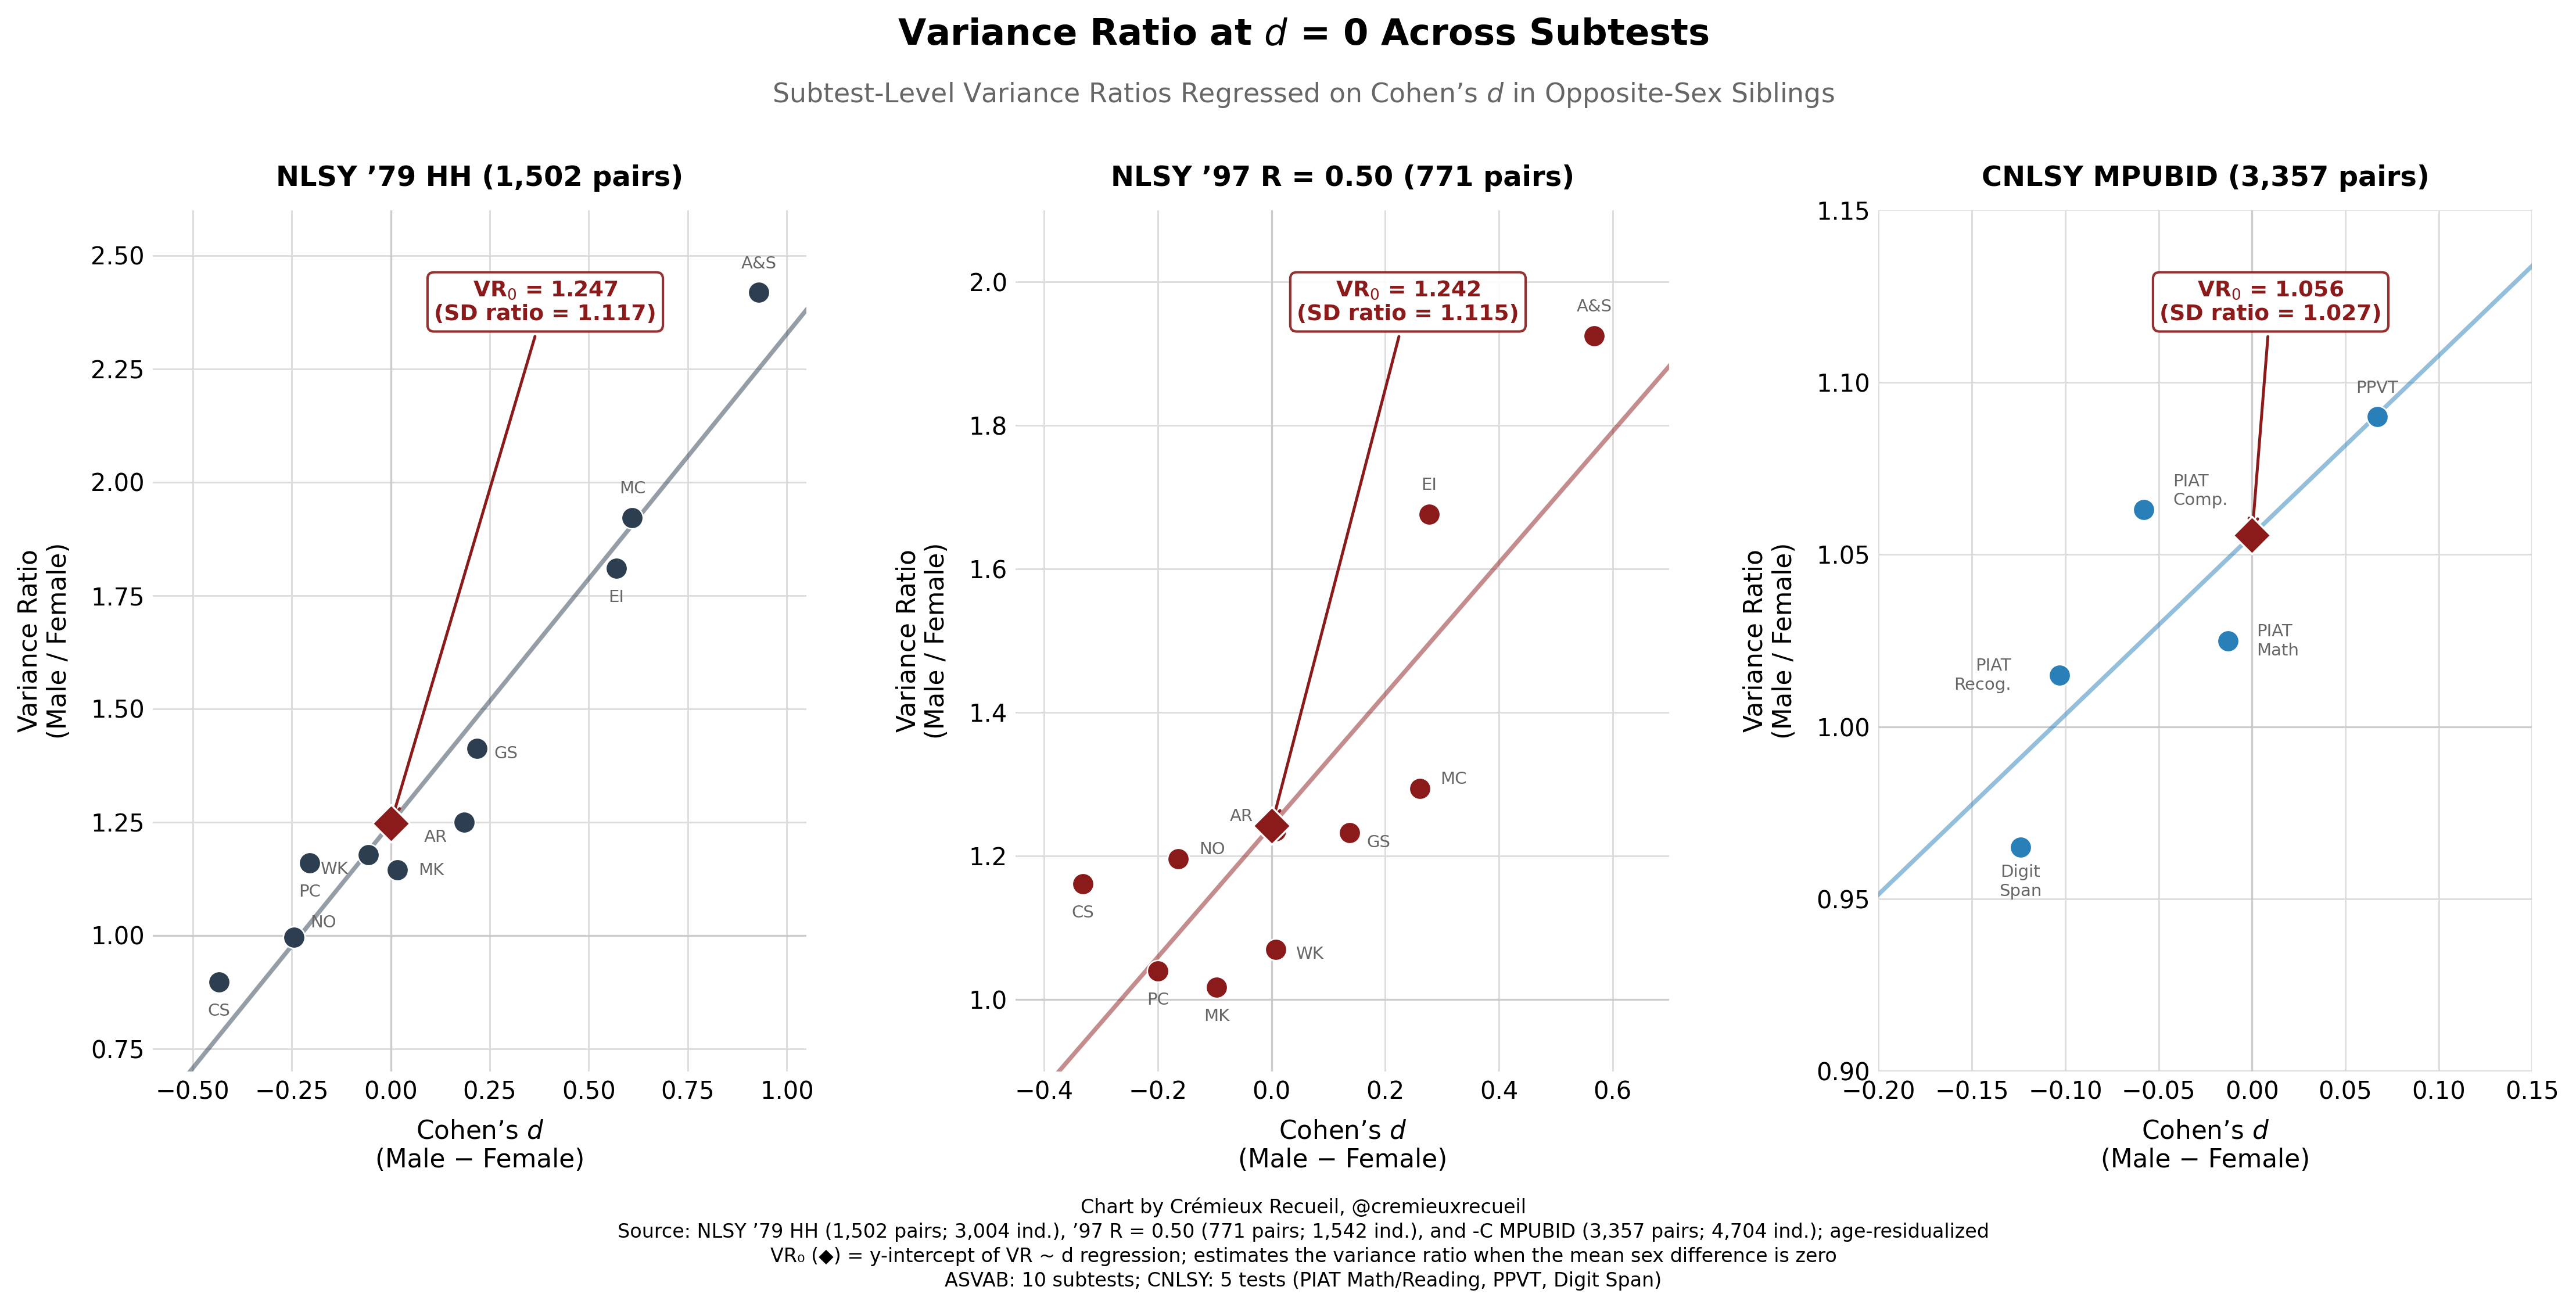
Let’s also look at this at the subtest level so we can get a better idea two things: (1) of the impact of specific skill differences between the sexes, and (2) of observed mean differences on observed variance ratio differences. We’ll do the latter first.
Simple averaging of the VR₀ figures across batteries delivers a male:female variance ratio of 1.182 when there are no sex differences.
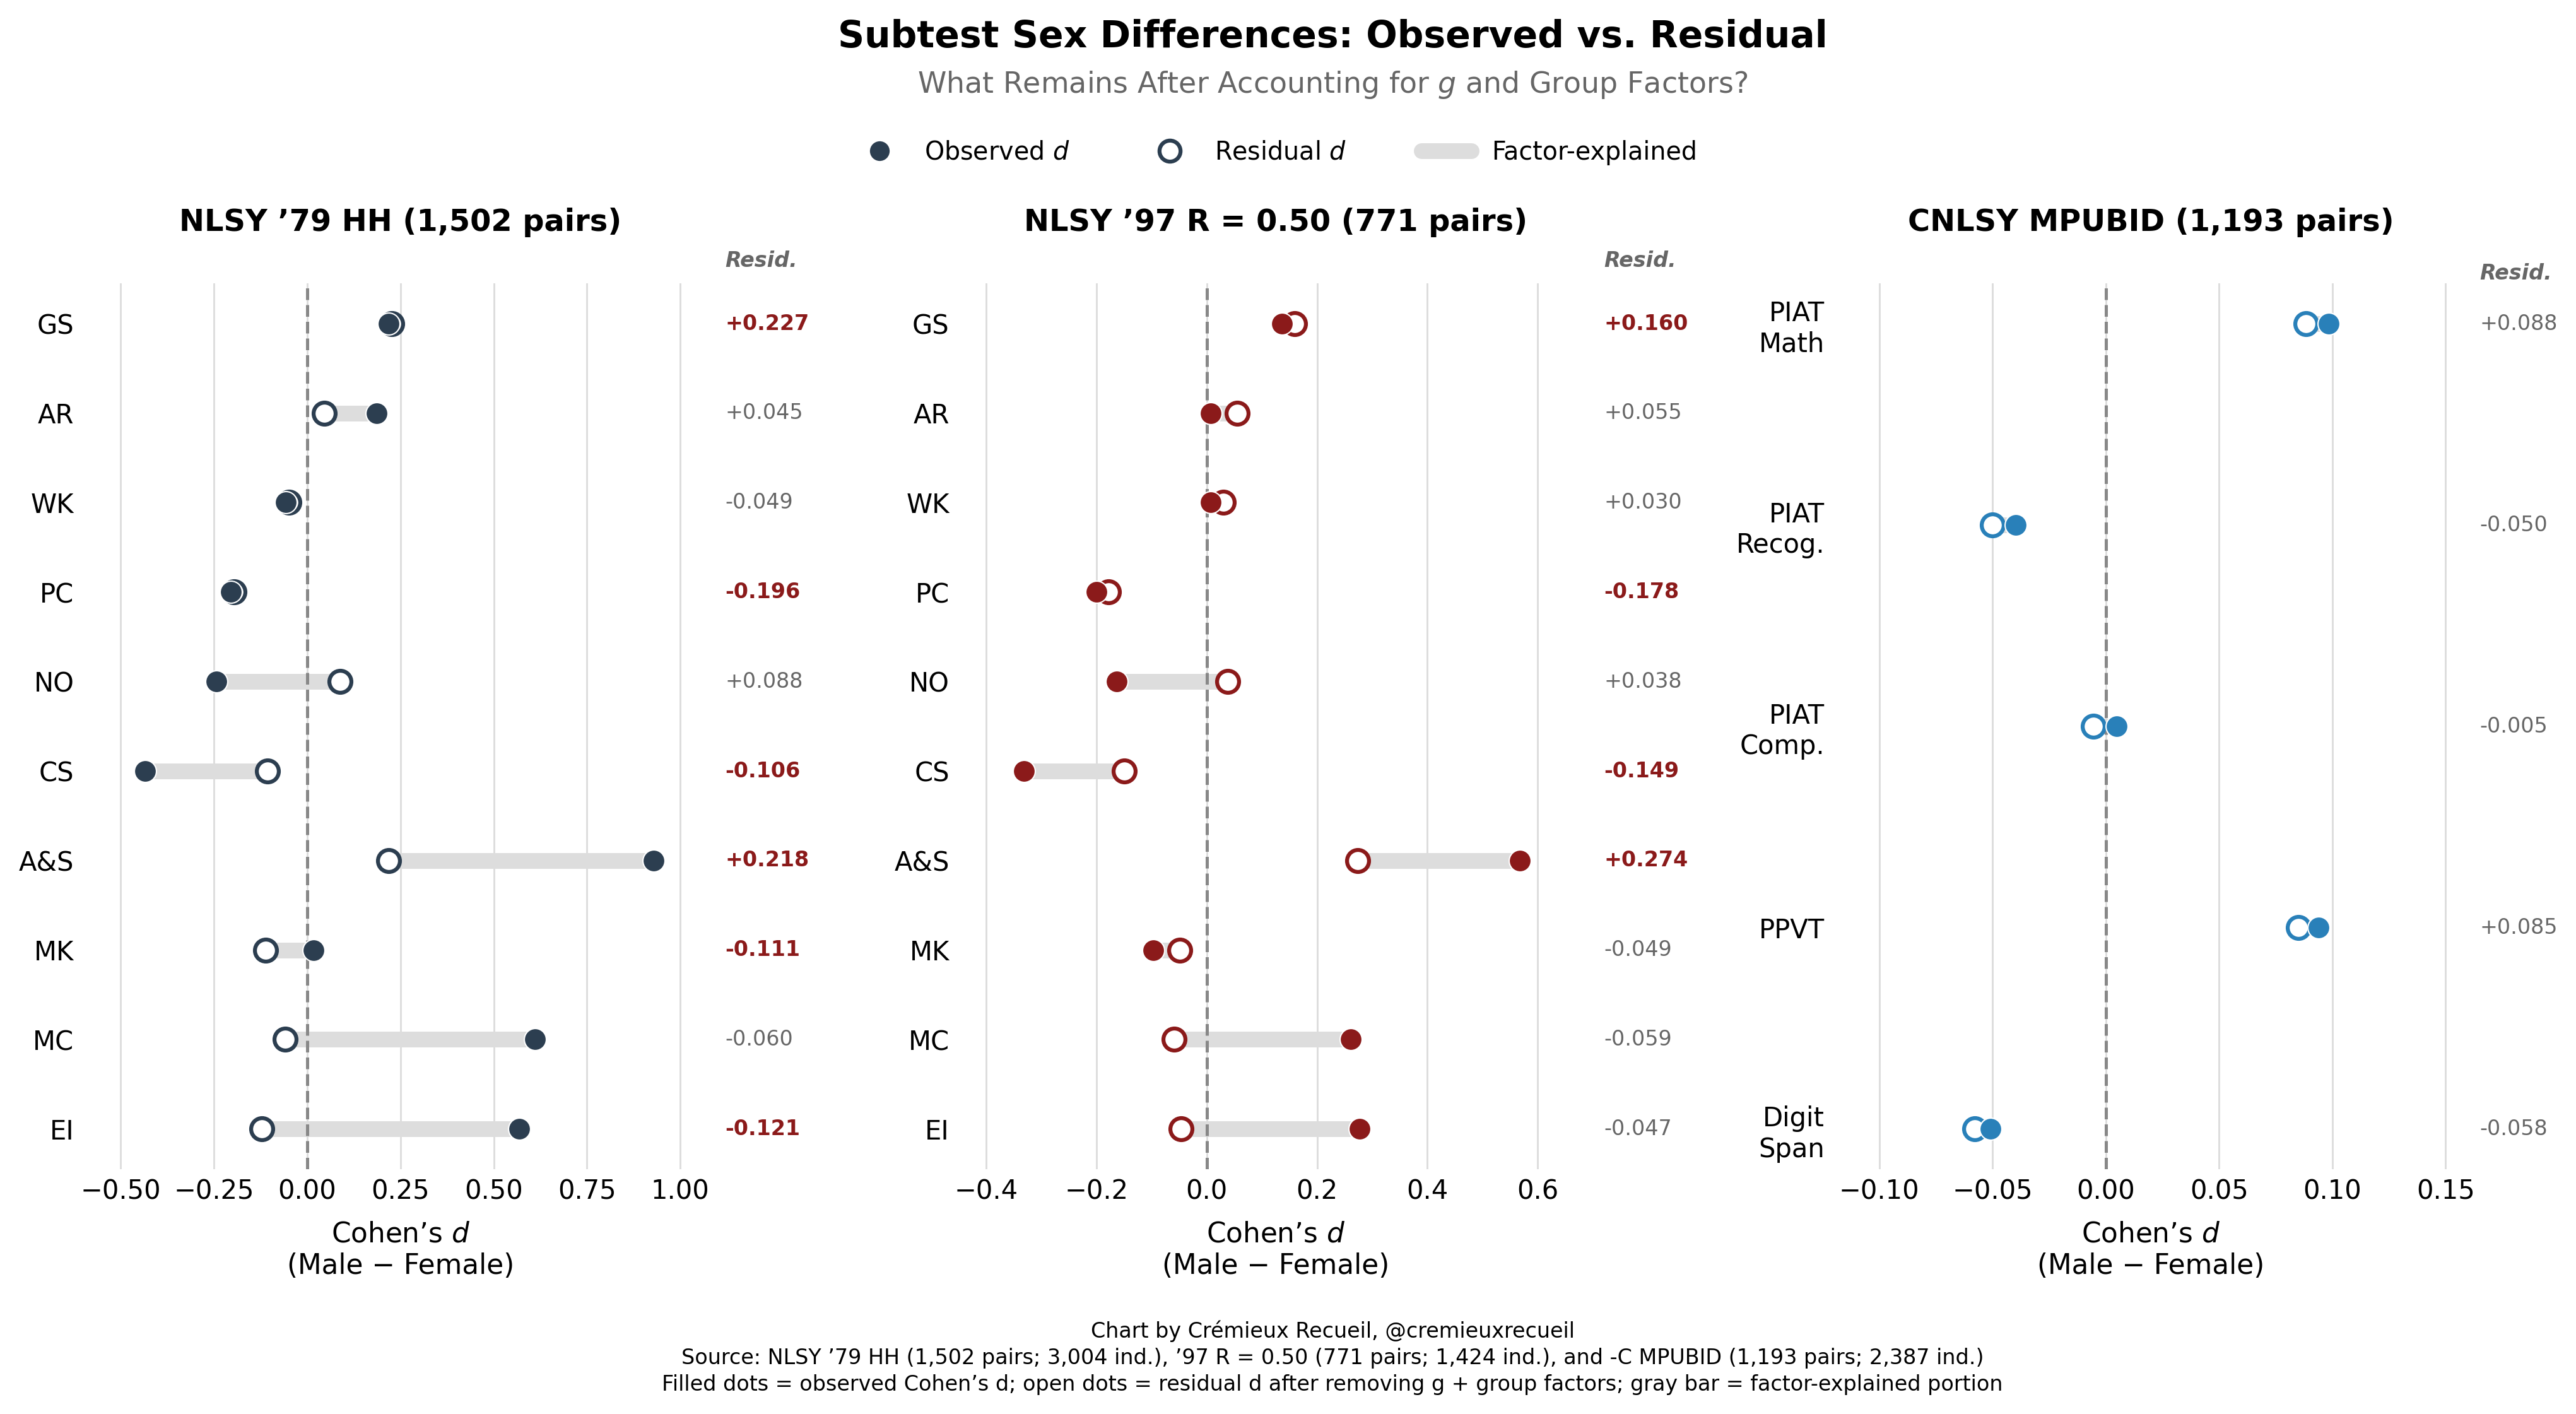
Now, let’s look at differences in the subtests after we take out g and the group factors. What we see is that there’s not a whole lot left over5 but sometimes there’s something, implying that there are average sex differences—not just individual differences—in specific test-relevant skills.
Let’s make yet another strong statement:
S3: There are male-female differences in test performance that go beyond measured intelligence and broad ability factors, having more to do with skills that are specific to particular tests.
Finally, let’s look at the development of male-female differences.
One thing you might’ve noticed is that the variance ratio VR₀ in the CNLSY sample is a lot smaller than the ones concerning developed adults from the NLSY ‘79 and ‘97. The age range for the CNLSY is 5-18, so it concerns a lot of the time when boys and girls are still developing, starting and then completing puberty. This could theoretically impact sex differences in both the means and the variances. Luckily, the CNLSY is a longitudinal cohort, so we can use its data to assess what’s going on.
First, let’s look at the CNLSY cross-sectionally. For the sake of power, I’ve binned the results instead of attempting to get continuous results, because there are sometimes not enough people at later ages to get anything even remotely certain. To get more power than I would have just using full-siblings, I’ll also look at the results for any other kids in the house, which includes things like co-resident cousins and half-siblings. The results are interesting. Take a look:
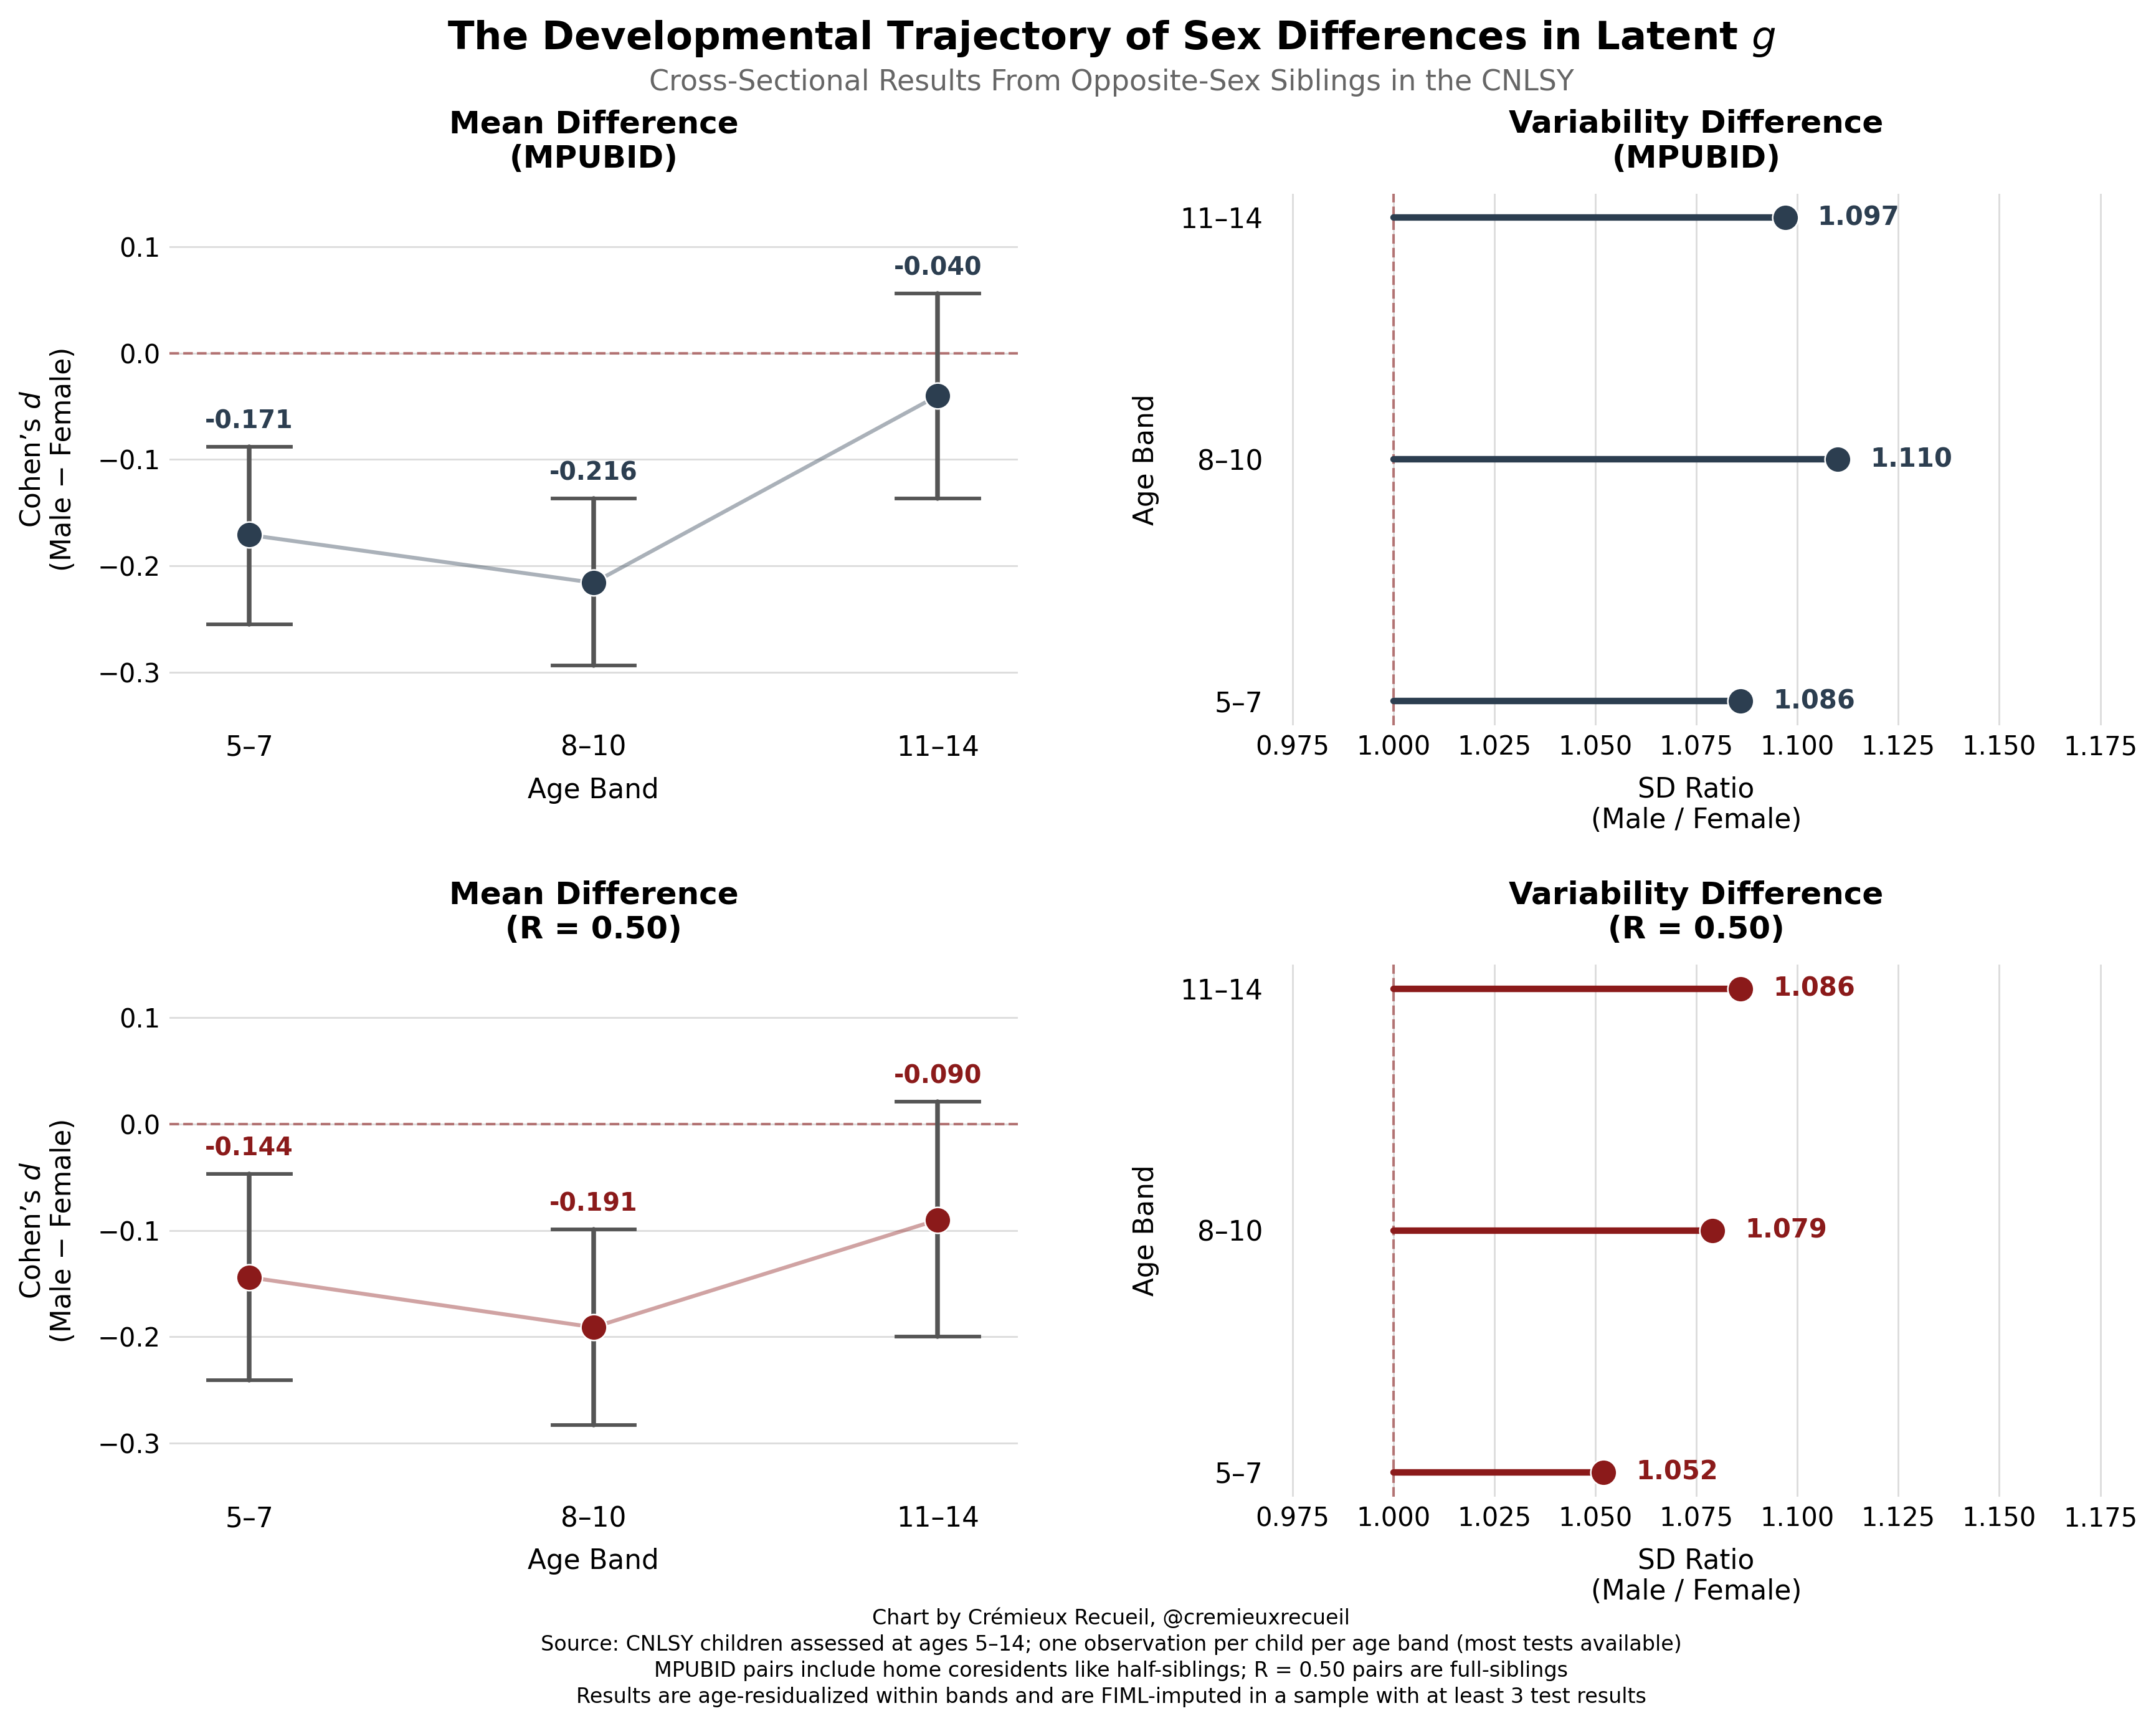
For the mean, it looks like differences might decline with age as boys enter puberty. We know that by early adulthood—as indexed by the older NLSY ‘79 and ‘97 samples—the gap is gone, so this suggestive result here looks to be confirmed. But to really make this certain, we need to look at the same individuals over time in a longitudinal analysis. We can do that with the CNLSY data, and the result looks highly similar:
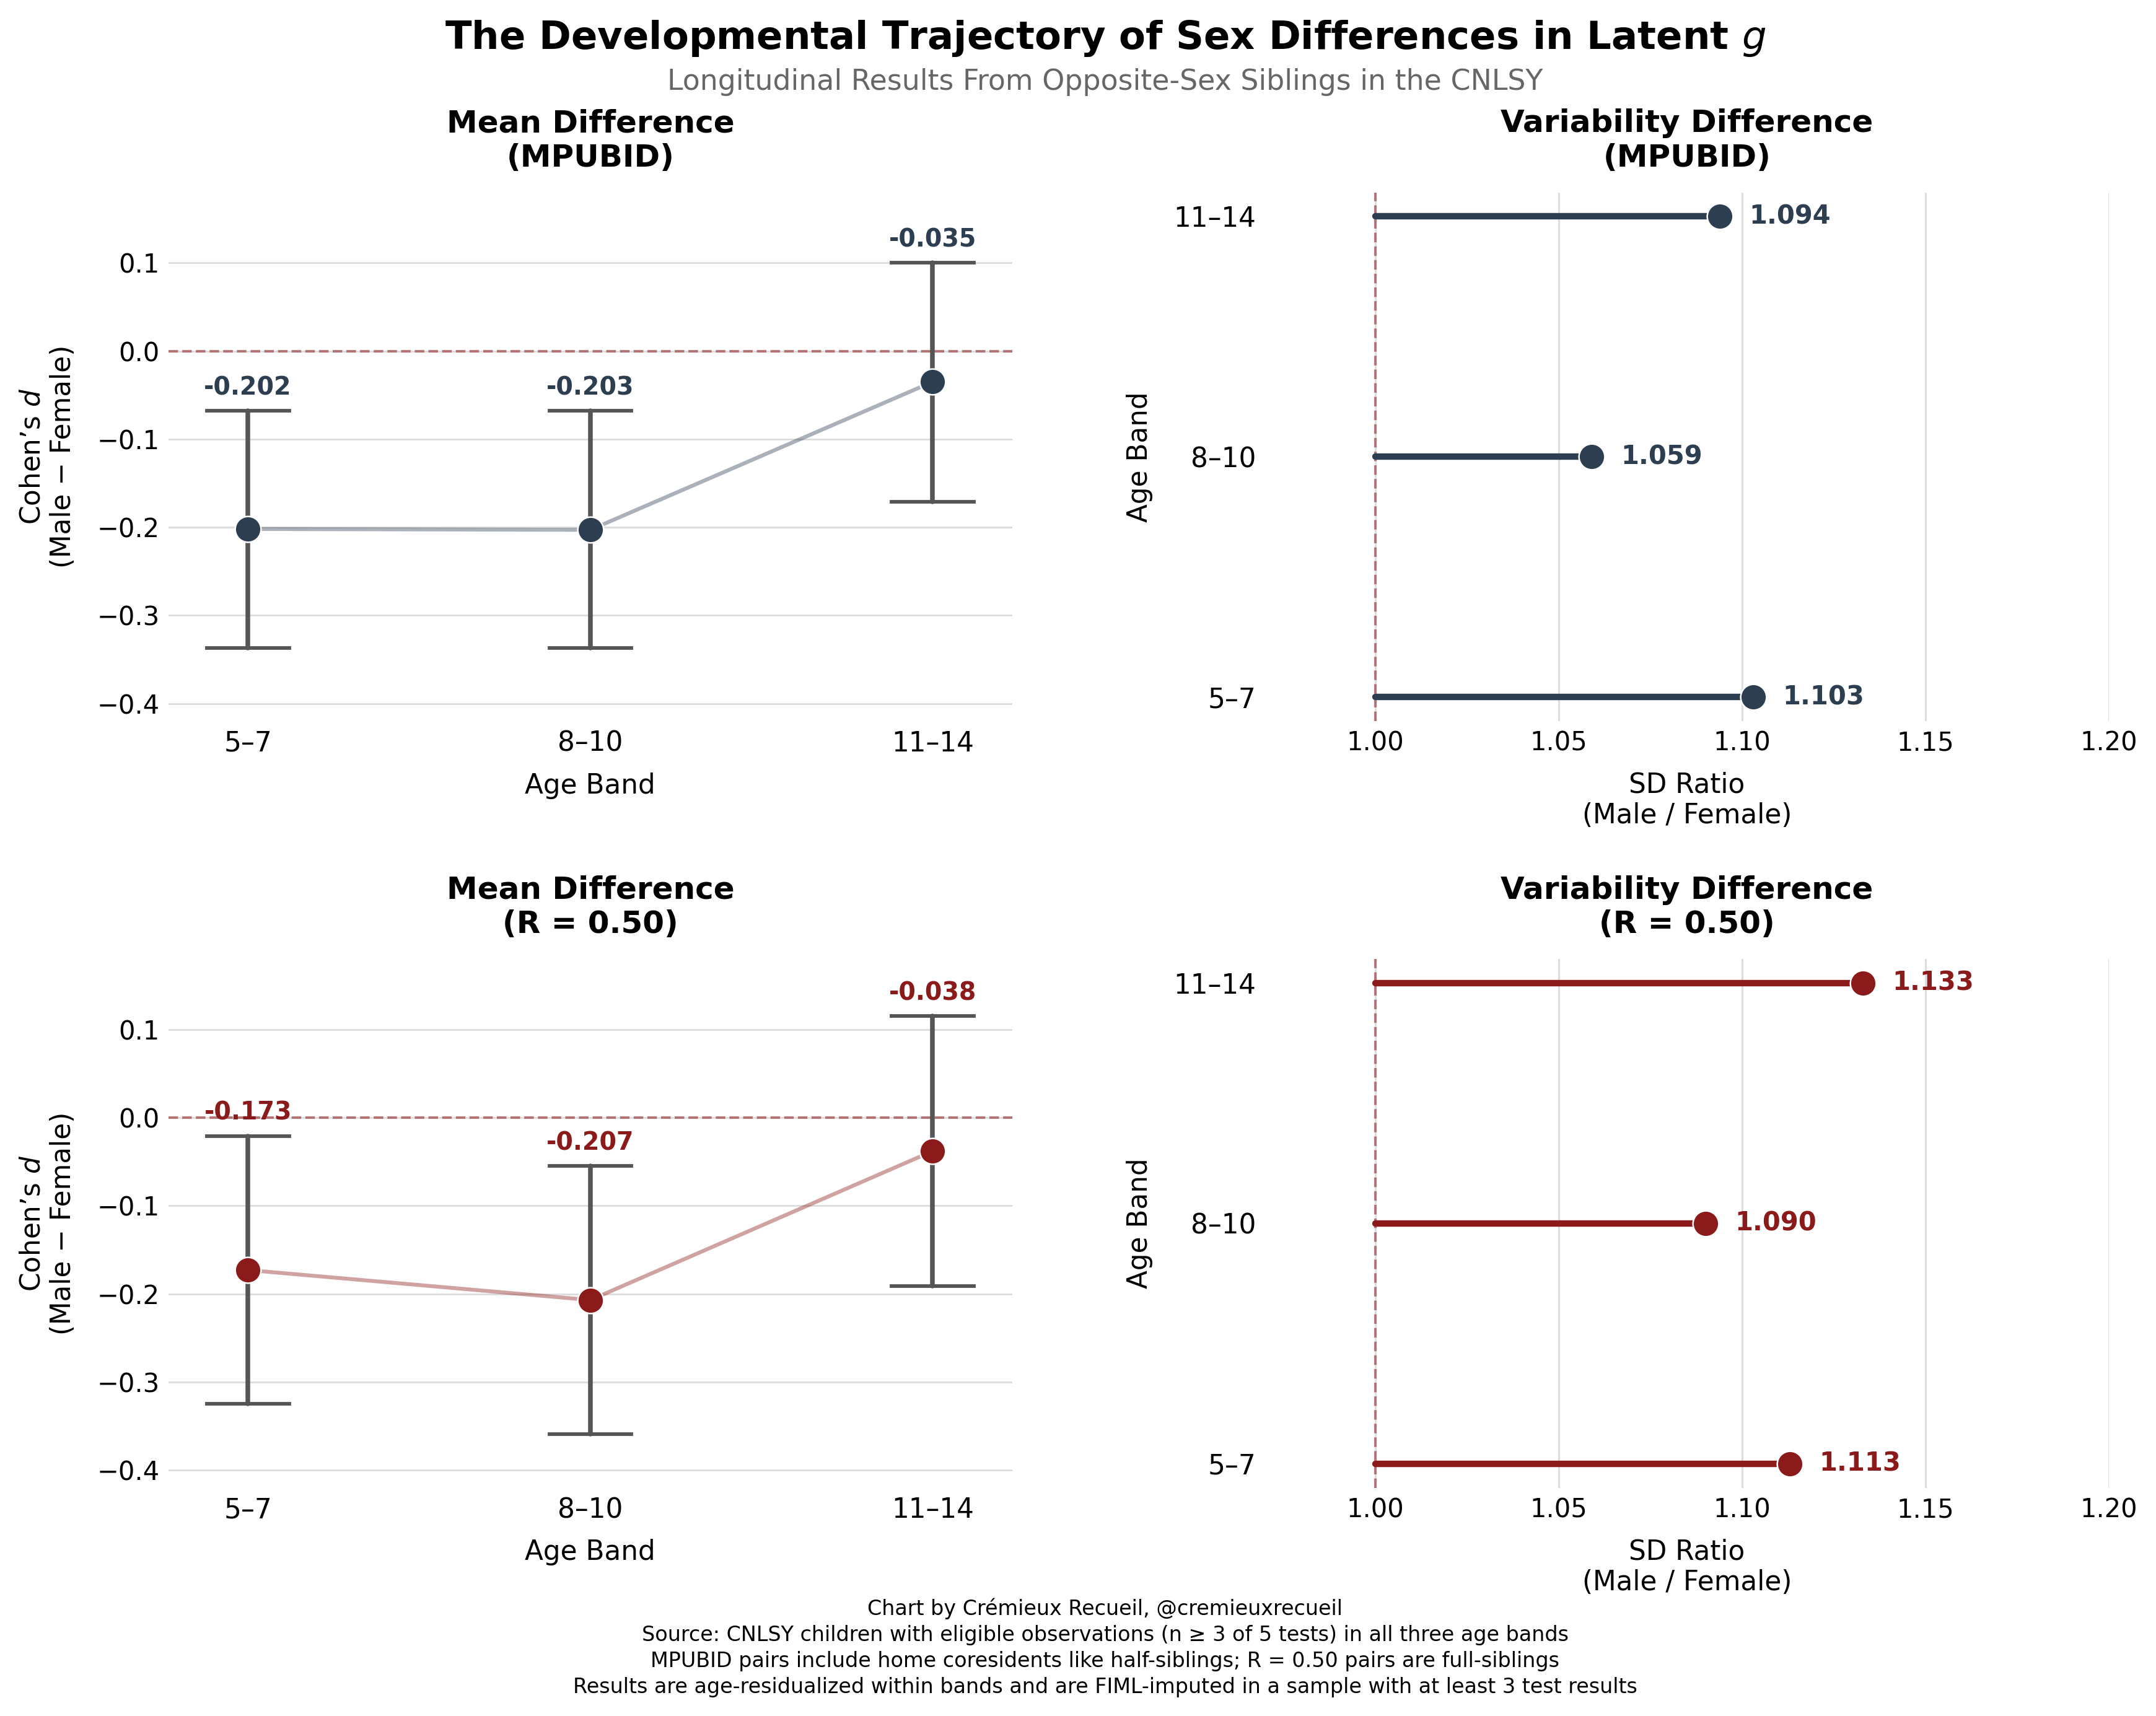
These results support an early female advantage that fades into nothingness alongside some consistent, possibly increasing level of greater male variability, but they aren’t very statistically certain yet. Nevertheless, let’s make a final, albeit weak statement:
W1: There are developmental trends in the male-female differences in g which may lead to the dissipation of early female advantages as people mature into adulthood.
Post-publication addition: A reader asked me to look into the development of the differences cross-sectionally in each cohort, so I’ve produced an updated plot doing just that. You can see it at this footnote.6
Sex Differences in Intelligence: Broad Strokes
There are often sex differences in performance on IQ tests. The reasons for those differences do not appear to be due to differences between the sexes in intelligence, but instead, to differences in lower-level abilities—like specific mathematical, verbal, and spatial ability, speed, and so on—and differences in skills specific to certain tests. Differences also have to do with males being more variable at all levels: g, s, residuals.
This much seems to be certain. These findings are confirmed thrice over in nationally-representative data with high-quality tests and large samples, with results spanning multiple generations. They are substantially robust to different methodological choices, sample inclusion criteria, adjustments for age, and so on (see below).
To my mind, the questions that remain about sex differences in IQ are much less generally interesting than the ones that have been answered. Many people are fascinated by big potential differences between races, sexes, countries, ages, and more, but they’re much less likely to have their interest piqued by questions about developmental minutiae. So, hopefully I’ve sated their interest and they can move on. Hopefully, the rest of us can move on to deeper questions than top-level ones about the mere existence of differences in means and variances and their general locations.
Hopefully.
Subscriber Sections:
Robustness
Let’s talk about how our specifications affect our results and how well things hold up.
