
One Weird Trick to Get Significant Results
A trick everyone uses but no one knows how to use correctly provides strong evidence for p-hacking

To get their studies published, researchers often need statistically significant results. But life doesn’t always make that easy. Sometimes researchers just aren’t able to get results that are significant or in the ‘right’ direction. So, what do they do?
Sometimes they’ll give up and the result achieved will live on in the file-drawer, that place where results go to rarely ever be seen again. Sometimes researchers will try hard and they’ll be able to publish a null result or one with an effect in an unexpected direction. Unfortunately, one thing researchers often do—sometimes without even knowing there’s a problem—is they’ll figure out a way to misrepresent their results.
Researchers who get a null they didn’t want or a result they didn’t expect will sometimes look at different outcomes where the result might be different.1 Other times, they’ll decide to test the effect of different control variables, since those can change the significance or sign of the results. And in yet other cases, they’ll play around with excluding certain observations, transforming their variables, and just generally doing anything they can to change their result—sometimes a lot, sometimes a little, but usually ‘favorably’: the result becomes what they wanted, whether that’s the same result but significant or a different one entirely.

One seriously under-discussed strategy to do this that gets used all the time is searching for a subgroup in the data to re-estimate the effect. For example, say we run a drug trial and we find an effect of size d = 0.12, but the result isn’t significant. Unpublishable! But what if the effect is significant among women? You can split the data and… voila! The effect is significant in women (p = 0.047), so you’re good to go.
It’s time to rewrite your paper and conclude that you found something that affects women, but not men. Among men, the effect was nonsignificant (p = 0.663), and by standard procedure, that means nothing happened to them. Right? Perhaps you can see the problem in this chart:
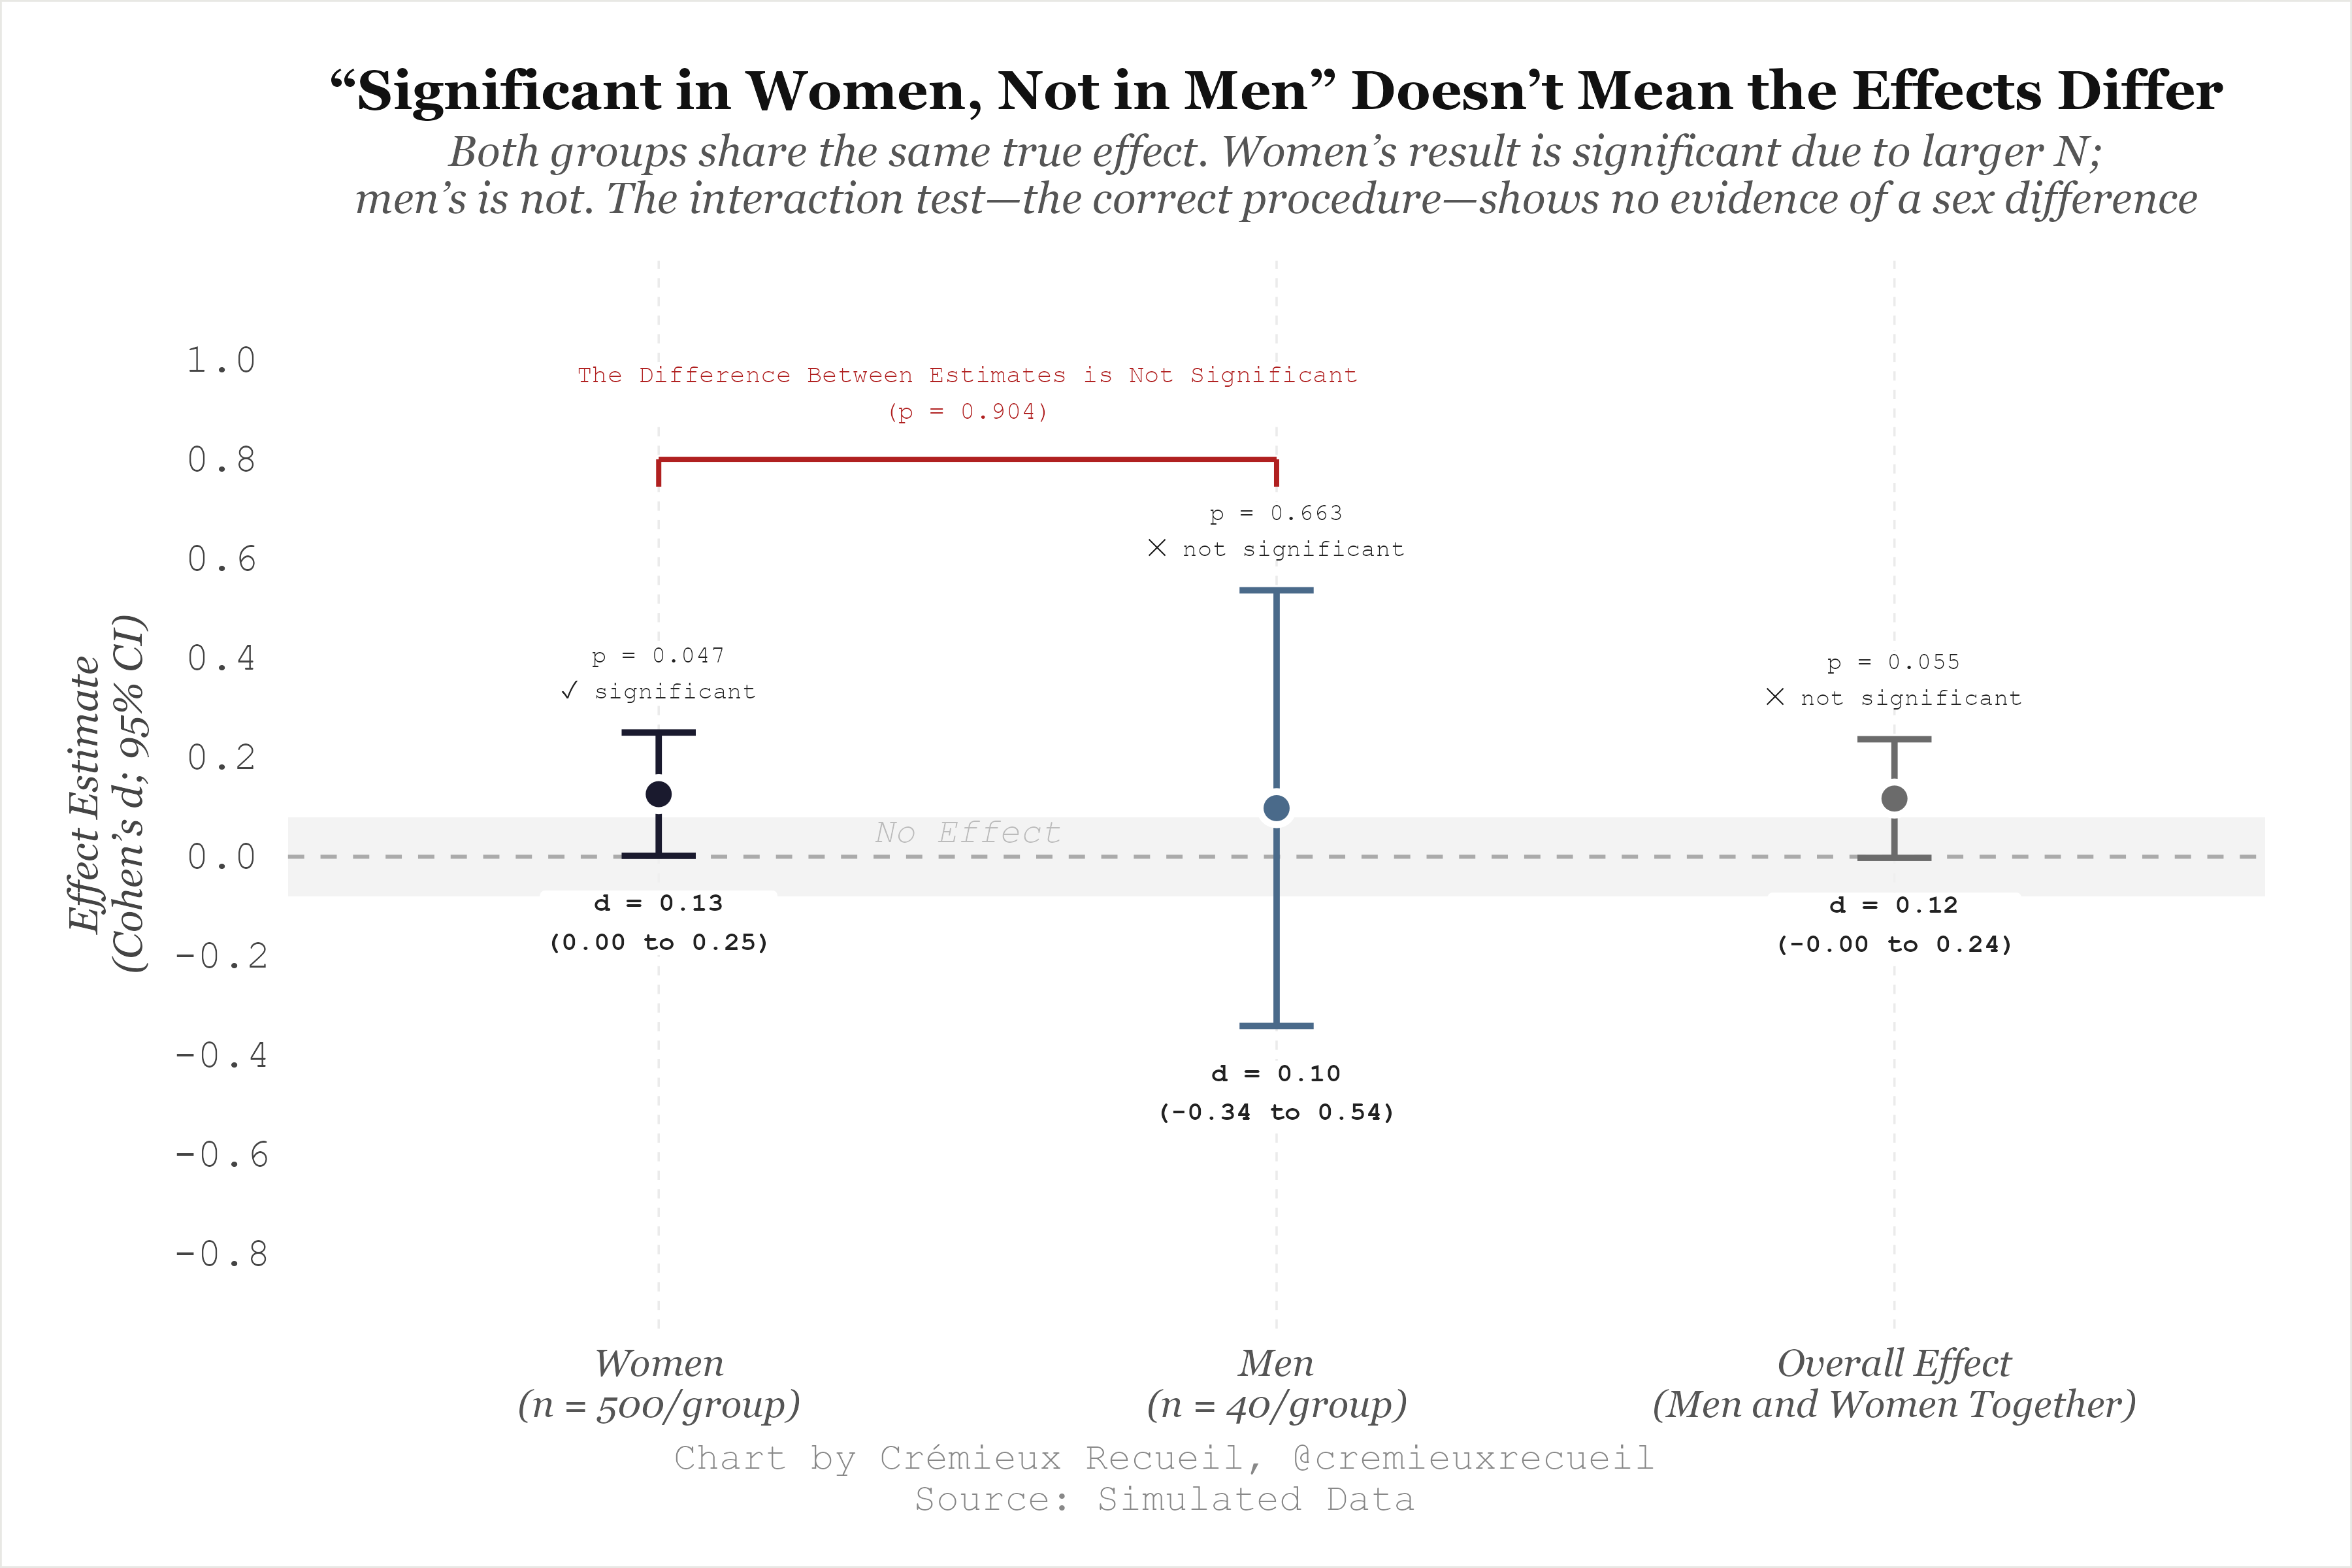
The results for men and women is strikingly similar, so even though the results for men were not significant, it’s still not right to say that the effect varied by sex. The male result is just noisier, and that’s explained by the sample size difference. But the rule in academia is ‘publish or perish’, so you’ll have to focus on the significant female result while ignoring, downplaying, or implying—and perhaps even outright saying—that it contradicts the male one.
This might not seem like a mistake—you did find a significant female result—but it’s a pretty major one. What’s happened here is that, through data dredging, a fragile result that’s likely to be a fluke was dug up. This is an “interaction”: a difference in coefficients between subgroups, and it’s not significant, meaning that the difference in coefficients between groups is not statistically supported, so cutting up these groups and making conclusions about their different effects is not justifiable
Interaction effects take much larger samples to justify than do estimates of regular effects. To put that into perspective, you need an eight-times larger sample to detect an interaction than you do to detect a main effect with an effect size of 0.25 d.2
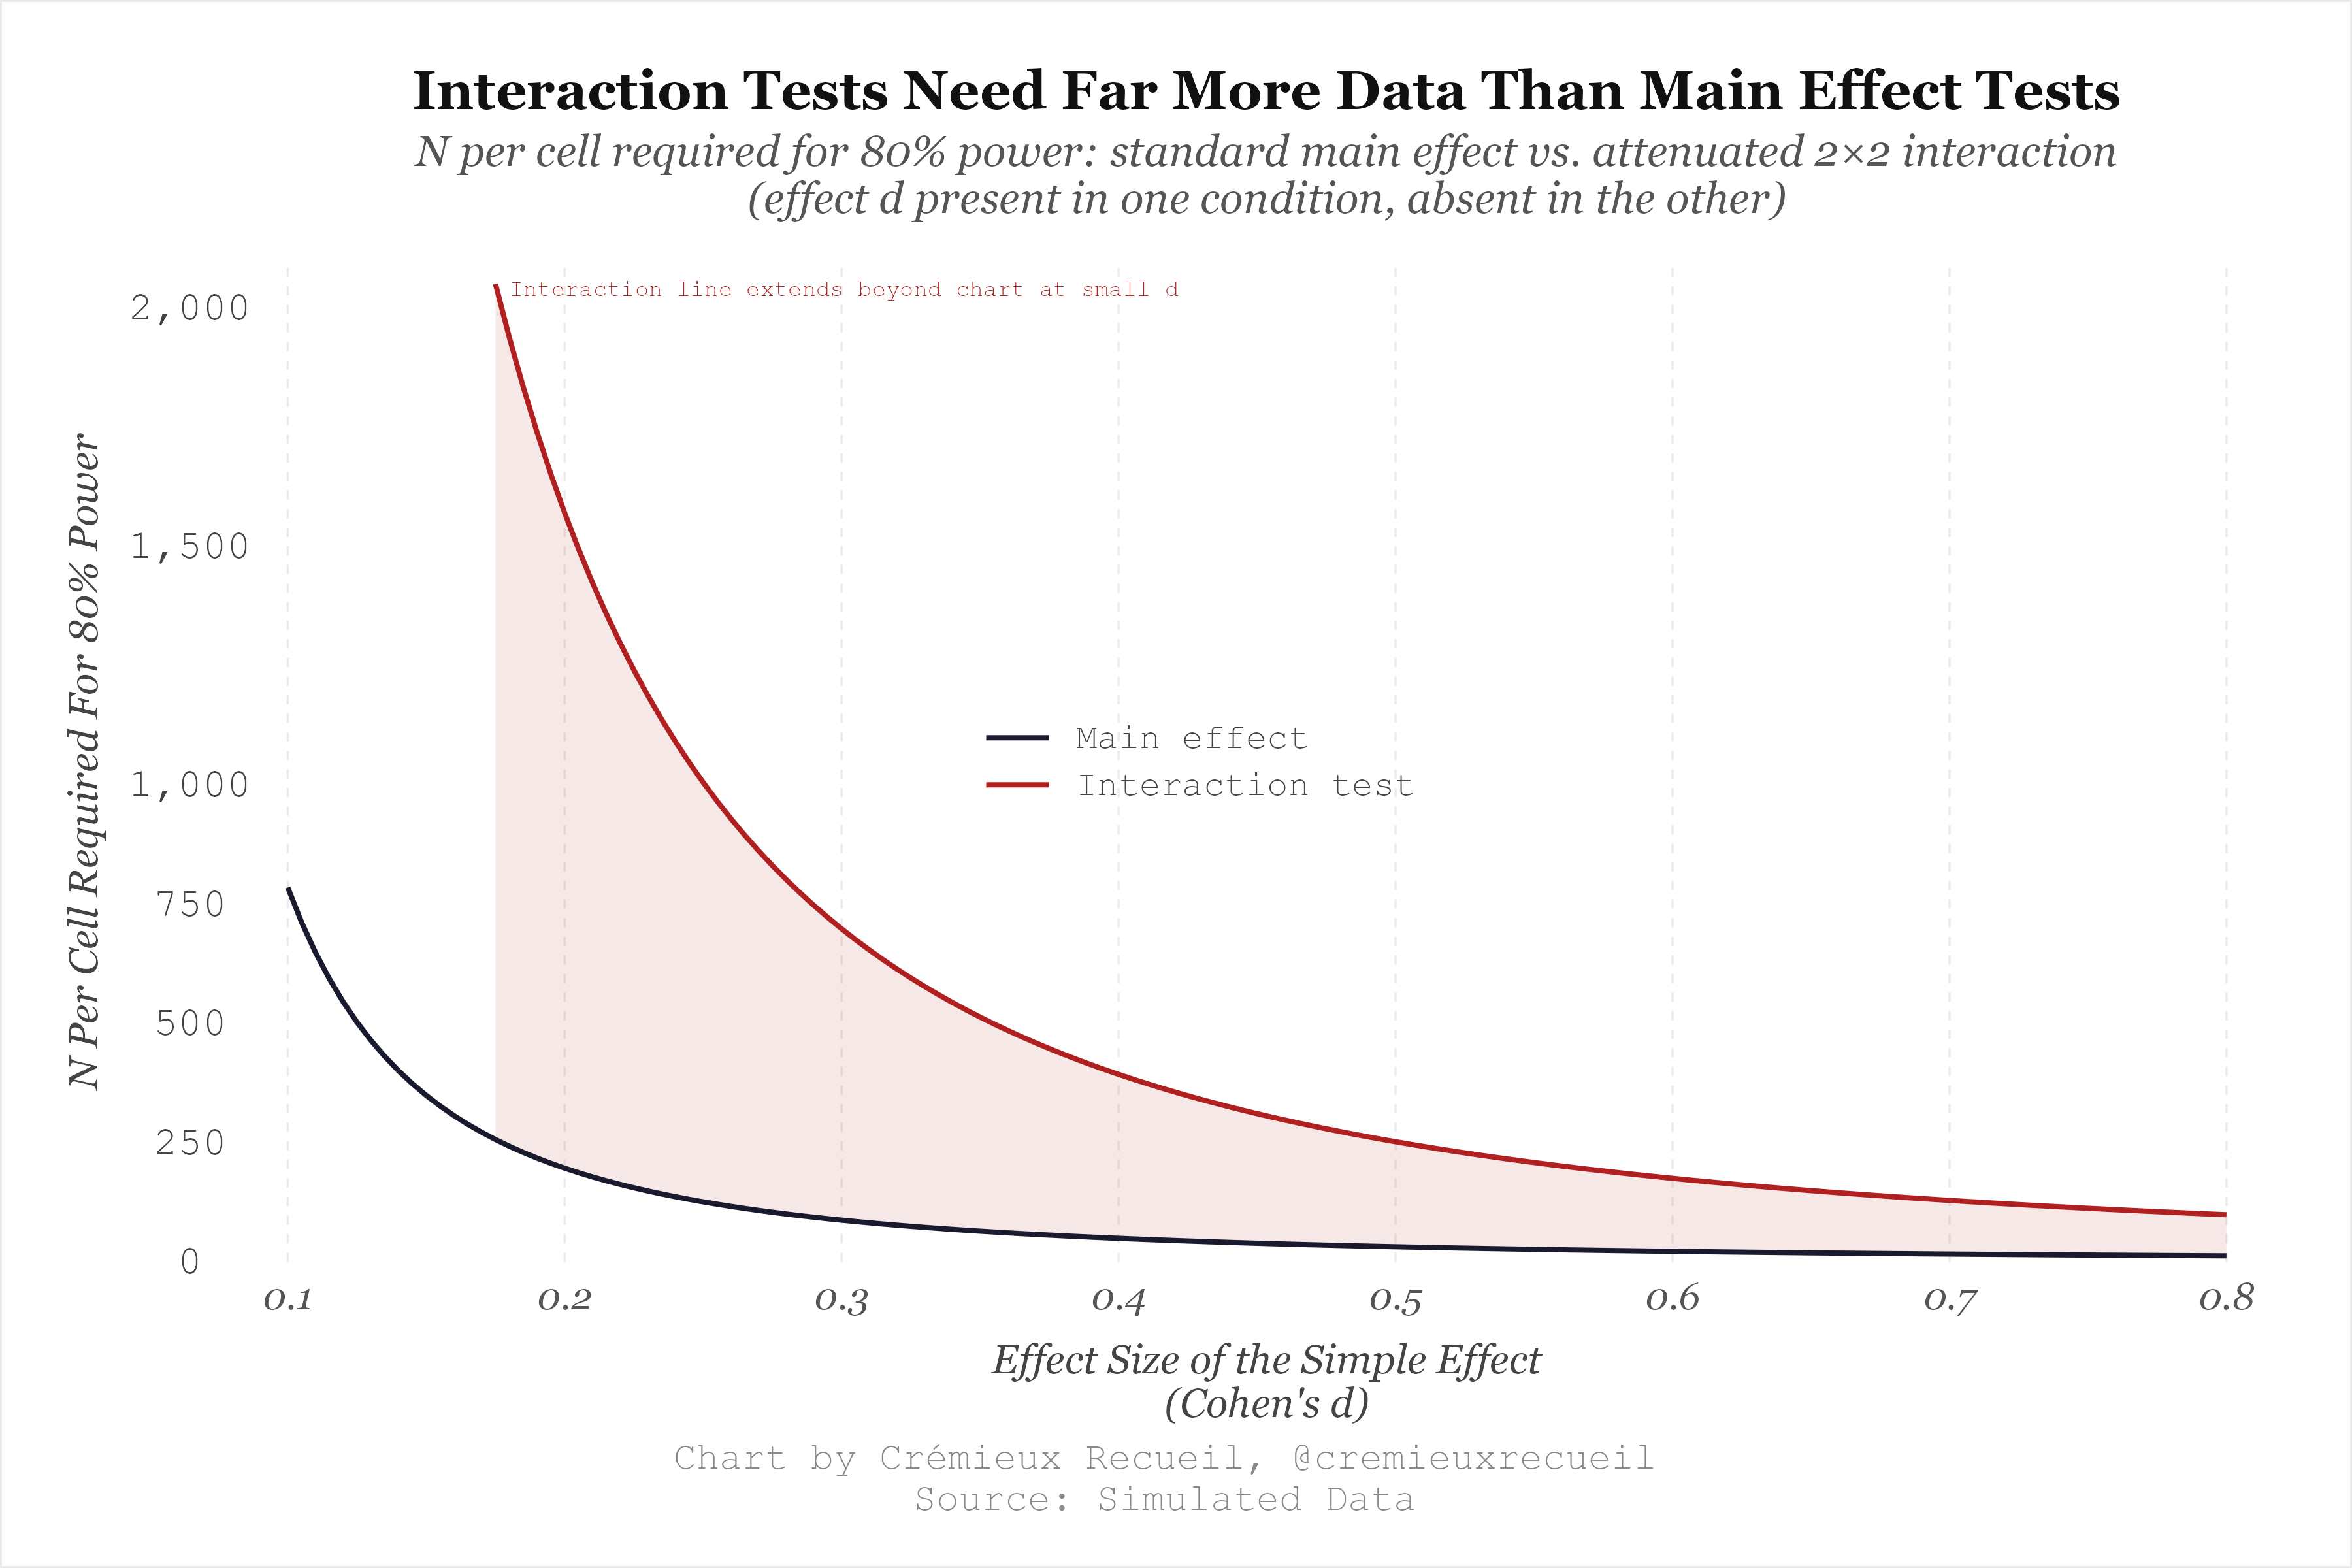
If you have enough grouping variables in your data, you can easily get significant results by looking for subgroups where the effect is significant, but because interactions take so much power to support reliably, they’ll also tend towards coming from null interactions and failing in replication. This has an unexpected upside: it makes it easy to detect p-hacking!

The reason why this is a shortcut to p-hacking detection is that most researchers—including those who go dredging for significant results—forget to test their interactions. In a lot of cases, these interactions are talked about but are not significant, so you can tell someone was p-hacking when they report them without a preregistration to prove their decision to test the interaction wasn’t just an ad hoc way to achieve significance.

There are so many examples of post hoc interaction tests the authors forgot to actually test to dredge up significant results, and they are often stunningly incriminating. I’ll provide one example from a potentially fraudulent study. The study I have in mind is the single randomized, controlled trial (RCT) for functional medicine, and it’s about coaching for elimination dieting.
For reference, functional medicine is a pseudoscience that its practitioners claim can reveal ‘root causes’ of people’s health problems through the use of unproven diagnostic tests and therapies that lack rigorous scientific backing.3 The premise is that chronic diseases are downstream manifestations of upstream imbalances in things like gut health, toxin burden, nutritional status, hormones, etc. After a functional medicine doctor (if you can call them that) runs enough specialized biomarker panels, they’ll claim they can address these ‘root’ imbalances through dietary change, supplements, ‘detoxification’, and other lifestyle alterations, resulting in a reversal of disease states that traditional medicine supposedly overlooks.
What functional medicine actually does is it bilks desperate people through prescribing extensive, often unnecessary, unvalidated, and unreliable lab tests like advanced lipid panels, organic acid tests, food sensitivity panels—which they often make in-house and rarely subject to empirical scrutiny—and so on, then funneling those patients into long-term supplement regimens and repeat testing to ‘monitor their progress.’ Patients are caught in a test-supplement-retest cycle that costs lots of money and delivers nothing better than traditional medicine—at best. At its worst, it prescribes quack cures that waste patient time and money while causing serious harm.
A near-synonym for this approach is ‘integrative medicine’, denoting medical care that involves elements of both traditional medicine and alternative medicine. With luck, the alternative medicine is useful, but it rarely ever is. Functional medicine is like that in that it’s usually quackery, not ‘integrative’ in any meaningful sense: it takes real biological concepts like the existence of the microbiome, epigenetics, and inflammation, and builds unfalsifiable clinical narratives around them. Functional medicine practitioners can always find something wrong about a patient by running enough tests, so they can always recommend another supplement or intervention. Then, to check how well that’s working, they can always order another set of labs.
Functional medicine has no endpoint where patients are told ‘you’re fine, stop coming.’
The authors of this functional RCT compared “functional medicine health coaching support” to “a typical self-guided elimination diet” with respect to effects on “dietary compliance and patient-reported health and quality of life.” They preregistered their plan on the NIH’s clinical trials website, stating that they planned to test one main outcome and two secondary ones. The registered main outcome was “Change from baseline PROMIS-Global Health score” (PROMIS GH) and the secondary ones were “Change from baseline Medical Symptoms Questionnaire score” (MSQ) and “Adherence/compliance to the elimination diet.”
This RCT was run by functional medicine practitioners and coaches with a vested, financial interest in functional medicine and it was funded by The Institute for Functional Medicine in collaboration with the Functional Medicine Coaching Academy. The three affiliations that the eight authors provided were The Center for Integrative Medicine, The Institute for Functional Medicine, and Functional Medicine Coaching Academy. But, they stated incorrectly: “The authors have no conflicts of interest to disclose.”4
Before even getting to the first word of the abstract, there seems to also be a second incorrect statement: “The datasets generated during and/or analyzed during the current study are publicly available.” But there is no repository link—no OSF, Zenodo, Figshare, or Dryad deposit to be found, and not even a link to the authors’ personal websites or a repository maintained by their funding institution. This makes sense, too, since when they registered their clinical trial, they stated that there was no “Plan to Share Individual Participant Data”.
The authors of this trial submitted a registration on September 16th, 2022 and the first version of their registration that was considered to have passed quality control checks was submitted on September 20th. That first viable version said that they were aiming to enroll 150 people. In their September 30 progress update to the NIH, they said the trial had started on the 26th, and that 150 people were enrolled. They maintained this claim in their final update on December 1st of that year, but when you check the paper, you see 139 participants mentioned. What happened to the other 11? One person allocated to control didn’t sign a consent form and ten people allocated to the intervention arm didn’t receive the intervention, had no time to commit, had health issues, etc. Is this important? We’ll see.
The authors’ provided rationale for their sample size is inconsistent, suggesting that they likely didn’t plan their trial based on the power analysis they claim to have performed. They wrote:
Assuming a 2-tailed α of 0.05, 80% power, and a standard deviation of 3 points in the difference of PROMIS GH means between arms, a sample size of 120 participants was estimated to detect a difference of approximately 1 point in PROMIS GH scores between study arms. This minimally detectable difference fell comfortably beneath the minimally important change in PROMIS GH scores. In order to account for unknown levels of dropout in this intervention in which the consent, intervention, and data collection were all performed online, a conservative estimate of 25% dropout was employed when recruiting potential participants. As such, 139 participants were randomized to either the functional medicine health coaching intervention or self-guided control arms of the study.
Can you see the arithmetic problem here? If you need 120 completers, then you need 160 participants. If you start with 150, cutting 25% gets you to 113 (112.5), so by their own admission, they were underpowered given “a conservative estimate of 25% dropout”. The “As such” before stating that they enrolled a sample size that their own calculations showed was too small with their “conservative” attrition estimate is curious, to say the least.
But, at least for power, those missing participants really didn’t matter because, to make their situation worse, the power analysis is completely wrong. With a two-tailed p-value of 0.05 for 80% power and an SD of 3 points, the required per-arm sample size is given by:
Using their provided values, z₀.₉₇₅ is 1.96, z₀.₈ is 0.84, σ is 3, and δ is 1. Plug in the numbers and you get just over 141. That means the required sample size to achieve 80% power per arm is 141-142, but they only enrolled 139 total. They needed 282-284 and got less than half that! The actual power maths out to <50%. Even being incredibly generous and using a one-sided test5, they would have had 72% power for detecting a 1-point difference with a standard deviation of 3.
And I want to reiterate: I am being incredibly generous. PROMIS scores are T-scores, so they come with a mean of 50 and a standard deviation of 10 in the norming sample. The authors knew this: they explicitly stated that “PROMIS GH t score distributions are standardized such that a 50 represents the mean… with the standard deviation around the mean of 10 points.” That means that they should have done their power calculations with a standard deviation that was more than three-times what they claimed to do their power analysis for. If we calibrate based on that, then with a one-tailed test, they would need more than 1,200 people per arm to achieve 80% power. With a proper two-tailed test, they’d need almost 1,600. With a standard deviation of 10, 120 people total, and an insistence on detecting a 1-point difference, the power is just under 14%6; with a proper two-tailed test, their power comes out to just under 8%—less than one-tenth of what they aimed for.
Looking at their baseline standard deviations for either group confirms that the PROMIS scores they had were substantially more variable (e.g., PROMIS GH — mental health SD = 7.6 for the control group, pre-intervention; SD = 6.8 for the intervention group, pre-intervention) than what they might have planned for.
I say “might have planned for” because it seems the preregistration of this trial was not real. The authors first submitted a failed clinical trial registration attempt on September 16th, but in their paper they wrote “Participants… were recruited via email invitation between September 10-19, 2022.” The International Committee of Medical Journal Editors (ICMJE) definition of a prospective registration for a trial requires registration before the first participant is enrolled, not before the study start date. Sending recruitment invitations is considered enrollment activity, so by their own admission, prospective participants were enrolled on the wrong dates.
If enrollment began after submission on September 20th, then the trial was prospectively registered by the ICMJE definition. But, if it began on the 26th—as they claimed—, then it was also not, as the authors claimed, a 10-week trial. If you check the clinical trial registration again, you see that the study completion date is listed as November 30th, meaning that the trial lasted ~9.3 weeks, not 10 weeks. The only ways they could’ve arrived at 10 weeks for the length of the trial would have been to start it before registering it officially, to have rounded the number of weeks upwards without saying it, to have used an atypical and unstated definition of a ‘week’, or to have made an error.
The study has yet more issues. For example, in Table 3, they claim to be reporting the baseline characteristics of the study sample, but they’re not really doing that. They are, instead, reporting the baseline characteristics of the follow-up sample—that is, the sample after attrition. This is a big deal because that means we don’t see the post-randomization sample’s characteristics, only what remains after randomization has potentially been broken.7 Alarmingly, the authors also said they had 100% follow-up from participants who provided baseline data, which is 125 people. But in their flow diagram, they don’t say anything about excluding participants because of a failure to provide baseline data. The only way to make sense of their result is to suggest that they made an error—I don’t doubt they did!—or something like that they didn’t actually collect baseline data at baseline, meaning that it’s retrospectively gathered. But, as will be revealed, we know this too is wrong.
Throughout the study, the numbers reported in the tables also don’t seem to really matter, because the authors change the baselines randomly. For example, they wrote that 87.8% of the sample was younger than 55 years old, it was 89.9% female, it was 70.5% White, and it was 69.1% Americans. These numbers are impossible to get from a sample size of 125, but they work with 139. These numbers are stated to be for “the study sample”, but immediately following their presentation, we’re greeted to a table saying that the study sample has different, discrepant values for these things, and a sample size of 125.
When it comes to actually estimating effects, the authors claimed that they used an intention-to-treat (ITT) approach, meaning they used the data from everyone who was randomized into each group. However, this is not correct given their statement that they randomized 150—or 139, as they also stated—but only 125 provided the baseline data and were included in the analysis, meaning that, for one, an ITT analysis was impossible, and for two, they admit they didn’t do it. They did a completer analysis, and received results for a potentially nonrandom sample!
The actual substance of those estimates is—you guessed it!—wrong.8 The table they’re presented in shows a pre sample size of 74 for the control group and 65 for the intervention group, with post sample sizes of 64 and 61, yet they say only 125 participants provided baseline data. But I see they provided data right there in Table 4! Did the authors actually collect psychological measurements without more prosaic information like age, race, or the other details that they probably had to collect during the training module the sample was recruited from, a training module that we know they collected at least some demographic criteria from, because they reported the training and licensure breakdown for it?
The study is also full of careless, numerical mismatches and misstatements. For example, in the abstract, they state that there were 64 people in the intervention and 61 in the control group, but later on in the Results section, the numbers become 61 in the intervention group and 64 in the control arm. The article does have an Erratum on it that corrects two other errors in the abstract, but it missed these issues! Their flow diagram describing the sample size through recruitment, randomization, follow-up and analysis also shows 150 people were randomized, but elsewhere they said “139 participants were randomized”, indicating that the authors conflated randomization with receipt of treatment.
One can forgive small errors, but only if there aren’t so many major ones. Onto results!
The p-values for the estimated differences between groups were not consistent with the authors’ reported means and standard deviations, nor with an ITT approach, a post-score comparison, or a change score comparison from the initial sample, or for that matter, from the types of t-tests they claimed to run. The result could be compatible with something to do with completers, but we just don’t know given what’s provided. Under any analytical model that can actually be reconstructed from their paper, the difference between groups for the MSQ score and the PROMIS GH physical score is highly significant. Why didn’t they report this? Instead, they reported that the difference was not significant. As such, they had to resort to other methods to reach a functional health-favoring conclusion.
After getting nonsignificant main results, the authors came to the conclusion that:
[F]unctional medicine health coaching was feasible and associated with superior elimination diet compliance as compared to a typical self-guided elimination diet control situation… [And] between-group improvements favored the functional medicine health coaching arm among participants who were experiencing greater symptomatology at baseline.
They got to this from nonsignificant results by explicitly doing subgroup analyses—searching for a group the result was significant in, without reporting the interaction.
The feasibility claim and the claim of superiority for functional coaching was based on doing a median split of each measurement and then checking if the changes between the intervention and control groups were significant in either of the groups that had higher and lower levels of symptoms.
This part of the paper is extremely poorly reported, even beyond how poorly the rest of the paper is reported. We receive no sample sizes or standard deviations, and we don’t know which pre means were used, so the result is impossible to reproduce. The result is apparently greater improvement with the functional health intervention for the people with more symptoms, to the tune of p = 0.0038 for the PROMIS GH mental health scale—which was not what they preregistered they were going to analyze—and p = 0.047 for the MSQ scale.
They didn’t preregister this analysis, they created the subgroups in a way that dramatically increases the risk of false-positives, and they did a large number of additional tests, all without any multiple comparisons correction. Doing any multiple comparison correction would have rendered all of these ad hoc and underspecified results nonsignificant!
And all of these problems exist before the perhaps more important problem that their measures were just awful! To get to the result that functional medicine coaching leads to superior elimination diet compliance, they just asked participants to provide one self-rating of how well they followed the elimination diet. A 1-10 self-rating! This is highly subjective, vulnerable to social desirability, demand effects, and the mere fact that the people in the intervention were more involved by virtue of receiving five direct coaching sessions versus those in the control arm getting to view some webinars. A single-item self-perceived adherence rating is not a robust measure of actual dietary compliance, and especially not in a sample that was recruited from among a group of people who had already shown an interest in functional medicine.
The only ‘gold standard’ study of how functional methods work seems to be irredeemably bad and there are many grounds on which it not only deserves, but commands a retraction, from the authors’ major undisclosed conflicts of interest, to their faulty registration and analytical deviations, to the numerous reporting errors, discrepancies, and even the erroneous claim about data being provided, along with their inexplicably poor understanding of study design, and their all-too-obvious p-hacking.
Looking for more to read? Why not learn how one study often outperforms a meta-analysis:
Beware the Man of Many Studies

In 2014, Scott Alexander penned a post that has been widely-cited ever since. He described something everyone can agree is a problem: placing too much trust in singular studies instead of the results of literatures.
This is called “outcome switching” and it is a major source of replication and generalizability problems for medical trials.
When one outcome is not significantly affected, trial-runners will sometimes be able to show that they got a significant result with some other outcome that’s considered to be just as good as or at least sufficiently like their originally intended outcome. But these secondary outcomes will, in some cases, be less useful—like “minimal residual disease” instead of “overall survival” in oncology trials—or will be affected by the ‘Winner’s Curse’, where, due to the trial-runner searching for results that are significant by chance, the odds of that result replicating are lower, since they went searching for a fluke.
There are other forms of interaction such as moderation, but I am talking about the most common.
Often enough, the uses of their tests and the procedures they call for are contraindicated by the best evidence, but they continue with them anyway, and I suspect they virtually never warn patients that what they want to do is likelier to be harmful than helpful.
Failures to disclose conflicts of interest are the norm in alternative medicine. They are less typical in real medicine.
Which cannot be justified because there is no way to credibly justify it. To do so would require a justified prior that the effect will be in a certain direction, and since there are no trials to establish some baseline like ‘functional medicine tends to work better’, they cannot even reason to that credibly.
Let’s work this out. Their total sample size is 120, the arms are equal (imbalance means less power), we’re using a one-tailed test with a significance threshold α of 0.05, and they want 80% power with a standard deviation of 10. For a 1-point between-arm difference:
And for a one-tailed α = 0.05, z₁₋ₐₗₚₕₐ = 1.645, so for 80% power, z₁₋₆ₑₜₐ = 0.842, so the minimum detectable effect (MDE) with 120 total is
This is incredible, since the authors noted that the smallest “important” change was at least 2 points. Anyway, the power is
The p-values suggesting balance for this improperly-described sample also seem to be incorrect. It’s unclear what statistical test they used. Everything I ran returned different values.
The authors also apparently did a linear regression with controls, but they don’t provide any details about the model, the controls, or the result, only that it agreed with the rest of the results. They call this a complement to randomization, but that just suggests the authors don’t know anything about experimental design, since this is not a complement to randomization, per se. It is a post hoc model they may or may not have run.
What makes this really galling is that the authors used the CONSORT guidelines for reporting randomized trial results, but they just didn’t follow them. One of those guidelines is to report results for each group, to report effect sizes with their precisions, and to include all these details for any adjusted analyses. They replaced that with a single sentence saying that the linear regression model agreed with the main results.
Reading this was like sitting down to a "Greatest hits of p-hacking / trial misreporting" double album. Great review
FYI there is an extra word “at” in: “To put that into perspective, you need an eight-times larger sample to detect an interaction than you do to detect a main effect with at an effect size…”
Typo in footnote #7: “…seem to beg incorrect”
Very minor, but the comma should be inside the quotation mark in the following: “These numbers are stated to be for “the study sample”, but”
Actually, the comma issue appears more than once: “but elsewhere they said “139 participants were randomized”, indicating that the authors conflated”