
The Tale of the Strawberries
Trends are meaningless if you don't know what you're measuring

This was a timed post. The way these work is that if it takes me more than one hour to complete the post, an applet that I made deletes everything I’ve written so far and I abandon the post. You can find my previous timed post here.
I think I’ve finally found an easy way to explain measurement invariance: with berries!
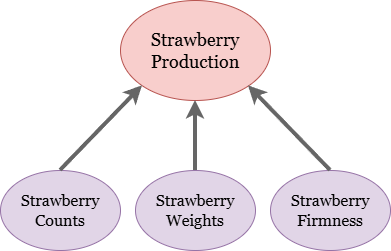
Total strawberry production is a formative variable, meaning that it’s the sum of its parts. Those parts include the numbers of strawberries and how heavy they are, and if we’re talking about farming for sale, it also includes how sellable they are, as indexed by their firmness. Diagrammatically, that means this:
If you were to plot trends in strawberry production over time in Europe and America, you would see parallel trend lines: both places are producing more and more strawberries as the years go by. So, you might conclude, they must both be increasing strawberry counts and weights! But you would be wrong. Peruse this figure:
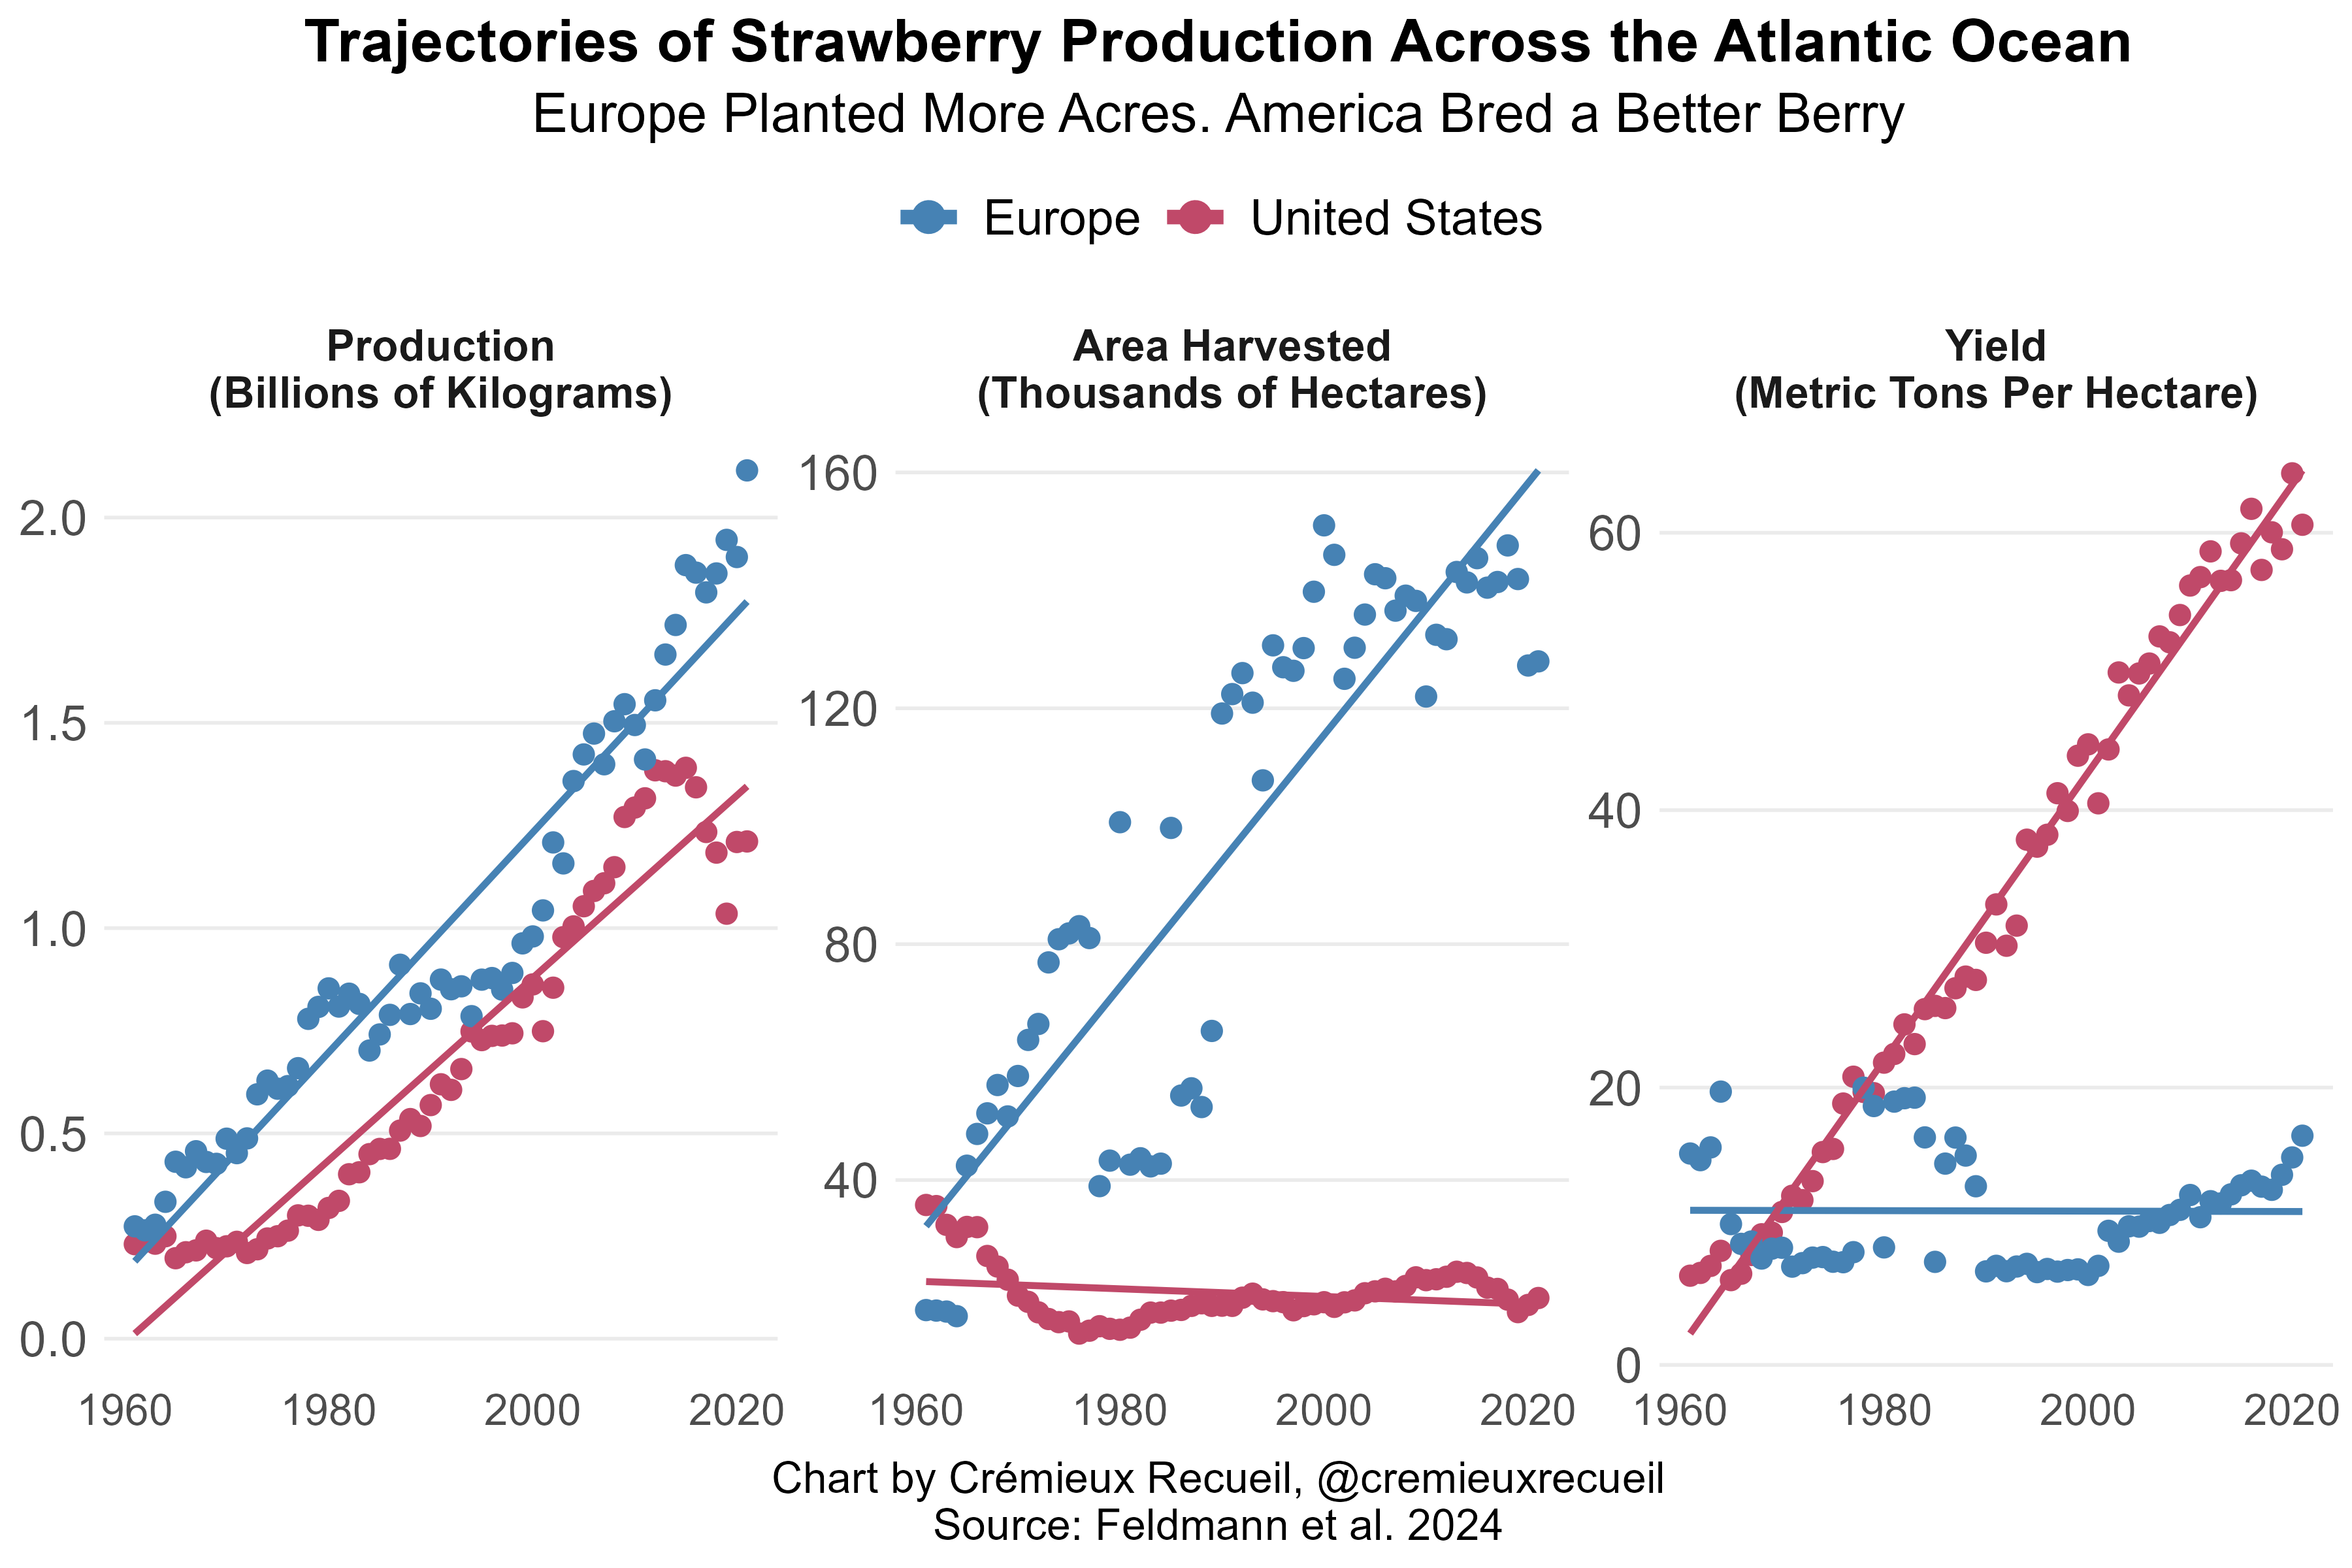
The U.S. and Europe are indeed on parallel total strawberry production trajectories, but the reasons are completely different. In the European case, they’ve been planting the same strawberry cultivars decades ago and today, but they’ve decided that the way to boost production is to plant more acres. The Americans, by contrast, have decided that the solution isn’t to plant more acres of berries, but to breed berries that perpetually flower, produce almost 2,700% more berries per hectare, with almost 370% greater weights per berry, and about 500% greater firmness, for a total yield increase totaling approximately 4,800%.
What’s In A Trend?
When you look at American and European strawberry production over time, you can tell that they’re both going up, and at comparable rates. But what you can’t see is the reason behind each location’s rise. If you just knew about the rise in production, you might conclude that they were driven by the same things, but as we now know, you would be wrong. Fundamentally: You cannot look at trend lines and know that the reasons behind them are, in fact, the same. One line might be going up or down or whichever way for one reason and the other might be going up, down, or sideways for completely different reasons. This is “measurement non-invariance”: the state where some measure just doesn’t mean the same thing for some comparison. To make the concept more annoying, without additional information that might not be available, you might not be able to identify the reasons measures aren’t comparable!
I bring this up all the time, but I think it falls on deaf ears because it’s so abstruse.
The first question people have when you tell them that a familiar quantity—like an a given batch of student SAT scores, strawberry production numbers, or household wealth—isn’t comparable over time (let alone across regions, countries, or some other grouping variable) is ‘What?’ And if the person you’re telling this to grasps the issue, usually their next question is ‘So why aren’t the numbers comparable?’—to which, unfortunately, we may just not have a good answer.
The other unfortunate reality is that we might just not know if incomparability means anything. Take PISA scores as an example. Across much of the OECD, they are down. This is true in the U.S. and many other places globally. Thankfully, we have the raw data, so we can see that (A) a small portion of the decline in the U.S. is driven by demographic changes that took place between different testing years, and (B) the rest is because scores just aren’t comparable for whatever reason. Once you correct for these things by matching the demographics over time and forcing the measurement parameters to be constant too, dismal score trends disappear and the line goes flat.
Does this mean that the score declines are meaningless? For some things yes, for other things no. Trend flattening means that we can no longer contend that kids today are less intelligent than kids in the past. But trends flattening doesn’t rule out an important role for things like the introduction of smartphones as a distraction learning. The observed scores might have fallen because kids aren’t learning as much. This could matter, or it could not matter. If the information kids aren’t learning these days is important in its own right—say, for cumulative learning, reasoning about the world, whatever!—then observed decline in uncorrected scores matters. But if that information is not useful, then we should put all of our focus on the corrected trend.
It isn’t just trends that this applies to either. Plenty of point-in-time estimates aren’t comparable. Above, I mentioned wealth. Sometimes you’ll see some statistic like ‘Norwegians are three-times as wealthy as Americans!’ and you’ll go to look and you’ll see… the Norwegian estimate includes each household’s split of the sovereign wealth fund. This is not wealth accessible to those people in any fashion, nor something that would follow them if they left the country. But it’s included in household wealth estimates, and it makes those estimates entirely incomparable with ones from countries without sovereign wealth funds even if every other part of the calculation, from property values to bank account balances to gift card values, is the same.
I demonstrated that the same is true when you compare how LLMs and humans perform on matrix reasoning tests like this one, where the goal is to pick the correct item to fill in the blank based on the pattern among the other items. An LLM might obtain a score consistent with an IQ of 120, but they do not reason to that score the same way a human does, and you’ll find that they get items wrong that humans find easy, while correctly answering plenty of items that humans tend to find difficult. That 120 IQ is not like a human obtaining a 120 IQ because the process underlying getting that score is just not comparable. And sorry, but no one knows why either!

If you sat down an autistic savant, a mathematical prodigy, and some otherwise normal person obsessed with practicing mathematical party tricks, and you had them all output the product of 823,451,927 × 771,404,592, and they all did it in thirty seconds with the same correct answer, who would be most impressive? Is it the autistic savant who just ‘felt’ the answer, the prodigy whose impressive working memory let him or her work it out from the basic methods that regular people are familiar with, or the guy who ‘cracked the code’ by practicing solving problems like this for the past ten years? Personally, I’d say that ‘it depends’ is a defensible answer, but ‘they’re incomparable’ is too. These results are the same; their meaning is radically different.
I’ve not run out of examples, but I think I’m getting repetitive, and I’m running low on time so I’ll quote Lyman Stone and cut myself off here: “You shouldn’t assume that common trends mean common causes.”1
I’ll also append a little note, written within my time limit: acknowledging and accounting for measurement invariance is the essence of avoiding cargo cults in many domains of science. In the quintessential example from Feynman, a researcher discovered all the ways to not have animals run a maze, and this wasn’t regarded as an important set of findings. But it is, because you have to account for all of the things that researcher discovered going forward. If you don’t, then future results might be explained by one or more of the biasing factors that researcher documented. Likewise, people occasionally recognize the issue of measurement invariance, but much of the time you can find those recognizers going about their merry day comparing the incomparable a few moments later.
Since, pragmatically, we cannot always assess measurement invariance, I’ve decided to live with this fact. I wish I could say I was excepted from talking about things that may not be comparable over time without qualification, but I’m not when it’s not possible to be. The cheery, Meehlian note I’ll add is that it doesn’t always matter. Sometimes measurement non-invariance has a small effect or it washes out, and things that might in some technical sense be incomparable can be comparable once again. This piece includes some examples.
Is there some regulatory reason Europeans can’t use the better strawberry?
I thought this would be about Captain Queeg.